| Param | Original file | Final file |
|---|---|---|
| Filename | modeM0/AS1G07_068T02_9000001508_10422cztM0_level2.evt | modeM0/AS1G07_068T02_9000001508_10422cztM0_level2_quad_clean.evt |
| Size (bytes) | 423,947,520 | 81,008,640 |
| Size | 404.3 MB | 77.3 MB |
| Events in quadrant A | 3,331,644 | 478,390 |
| Events in quadrant B | 2,733,148 | 520,138 |
| Events in quadrant C | 2,700,208 | 549,429 |
| Events in quadrant D | 3,719,741 | 540,292 |
| Mode SS | |||
|---|---|---|---|
| Quadrant | BADHDUFLAG | Total packets | Discarded packets |
| A | 0 | 206 | 81 |
| B | 0 | 206 | 81 |
| C | 0 | 206 | 85 |
| D | 0 | 200 | 80 |
| Mode M9 | |||
|---|---|---|---|
| Quadrant | BADHDUFLAG | Total packets | Discarded packets |
| A | 0 | 29 | 11 |
| B | 0 | 31 | 13 |
| C | 0 | 31 | 14 |
| D | 0 | 30 | 11 |
| Mode M0 | |||
|---|---|---|---|
| Quadrant | BADHDUFLAG | Total packets | Discarded packets |
| A | 0 | 30079 | 16984 |
| B | 0 | 27933 | 16806 |
| C | 0 | 21516 | 9929 |
| D | 0 | 28349 | 13953 |
| Quadrant | Total seconds | Saturated seconds | Saturation percentage |
|---|---|---|---|
| A | 4757 | 73 | 1.534581% |
| B | 4887 | 65 | 1.330059% |
| C | 5615 | 36 | 0.641140% |
| D | 5378 | 245 | 4.555597% |
Noise dominated data is calculated using 1-second bins in cleaned event files. If a bin has >2000 counts, and if more than 50% of those come from <1% of pixels, then it is considered to be noise-dominated and hence unusable.
| Quadrant | # 1 sec bins | Bins with >0 counts | Bins with >2000 counts | High rate bins dominated by noise | Noise dominated (total time) | Noise dominated (detector-on time) | Marked lightcurve |
|---|---|---|---|---|---|---|---|
| A | 7581 | 5479 | 1 | 1 | 0.01% | 0.02% |  |
| B | 7583 | 5489 | 1 | 1 | 0.01% | 0.02% |  |
| C | 7583 | 6182 | 0 | 0 | 0.00% | 0.00% |  |
| D | 7583 | 5773 | 178 | 178 | 2.35% | 3.08% | 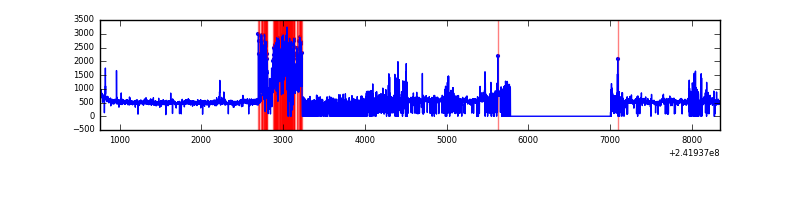 |
Top three noisy pixels from each quadrant. If the there are fewer than three noisy pixels in the level2.evt file, extra rows are filled as -1
| Pixel properties | Quadrant properties | ||||||
|---|---|---|---|---|---|---|---|
| Quadrant | DetID | PixID | Counts | Sigma | Mean | Median | Sigma |
| A | 13 | 251 | 1079499 | 9128.12 | 582 | 570 | 118.2 |
| A | 14 | 254 | 5973 | 45.71 | 582 | 570 | 118.2 |
| A | 0 | 226 | 5273 | 39.79 | 582 | 570 | 118.2 |
| B | 4 | 239 | 314402 | 2728.23 | 606 | 592 | 115.0 |
| B | 0 | 214 | 22771 | 192.82 | 606 | 592 | 115.0 |
| B | 10 | 245 | 20417 | 172.36 | 606 | 592 | 115.0 |
| C | 14 | 234 | 8578 | 49.8 | 688 | 693 | 158.3 |
| C | 13 | 61 | 4969 | 27.01 | 688 | 693 | 158.3 |
| C | 3 | 254 | 3388 | 17.02 | 688 | 693 | 158.3 |
| D | 2 | 33 | 593542 | 3851.04 | 652 | 634 | 154.0 |
| D | 1 | 20 | 300603 | 1948.35 | 652 | 634 | 154.0 |
| D | 8 | 195 | 221318 | 1433.38 | 652 | 634 | 154.0 |
Histogram calculated using DETX and DETY for each event in the final _common_clean file
| Quadrant A |  |
 |
Quadrant B |
|---|---|---|---|
| Quadrant D |  |
 |
Quadrant C |
| Plot type | Count rate plots | Images |
|---|---|---|
| Comparison with Poisson distribution Blue bars denote a histogram of data divided into 1 sec bins. Red curve is a Poisson curve with rate = median count rate of data. |
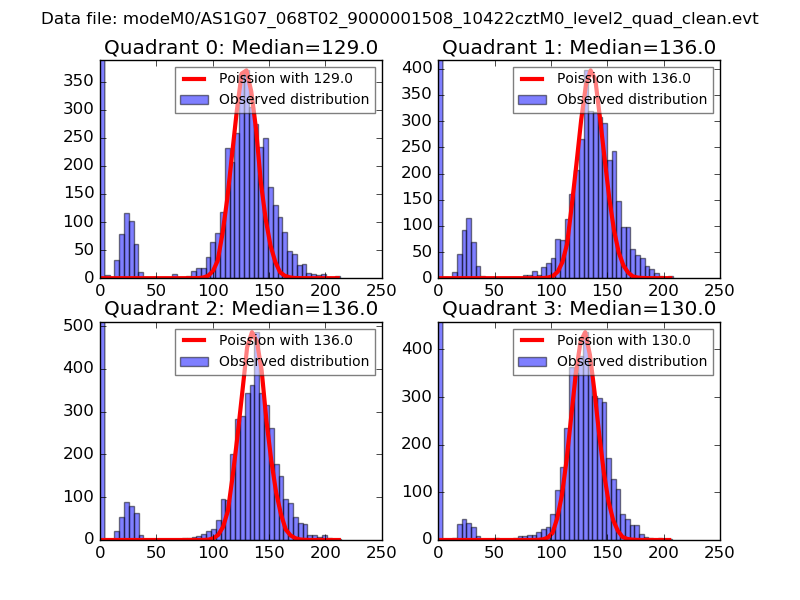 |
 |
| Quadrant-wise count rates Data is divided into 100 sec bins |
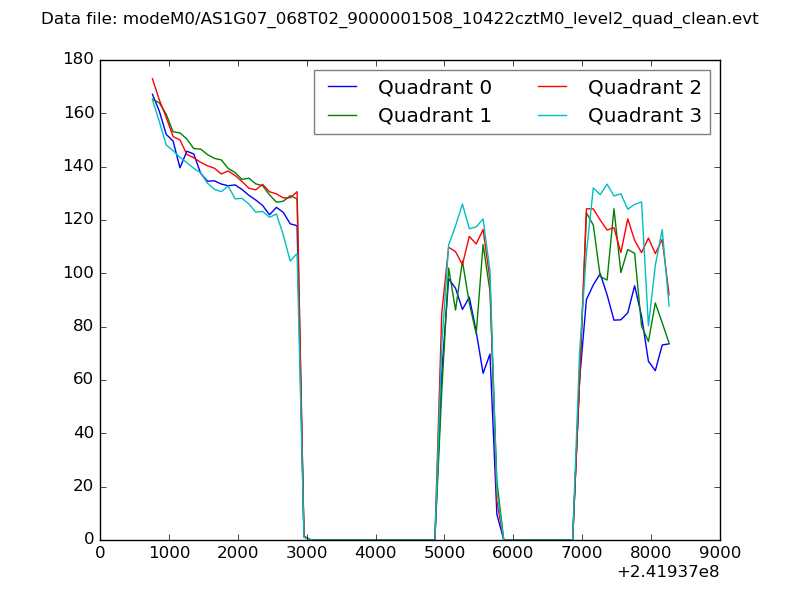 |
|
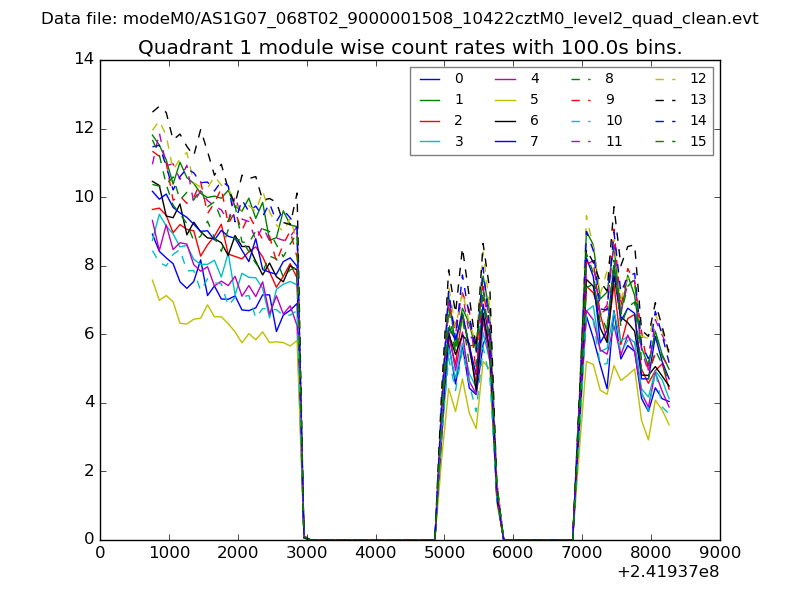
| Module-wise count rates for Quadrant A Data is divided into 100 sec bins |
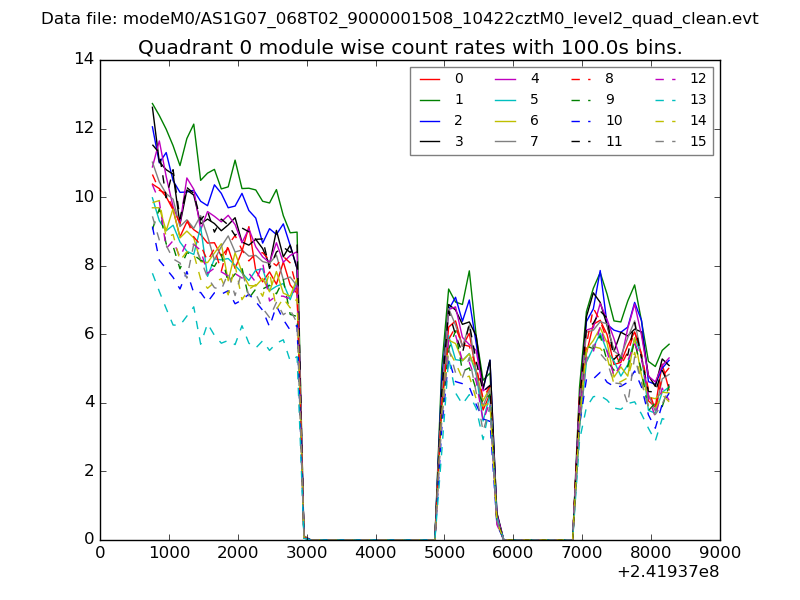 |
 |
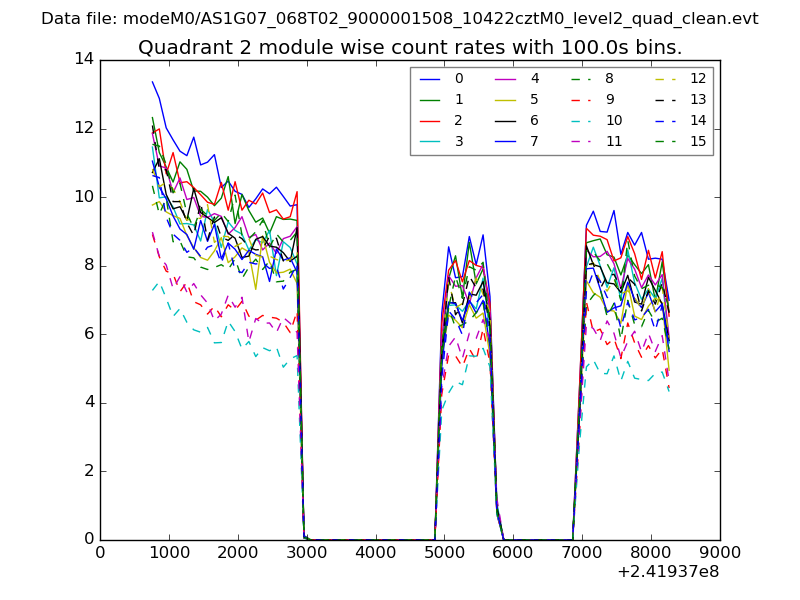
| Module-wise count rates for Quadrant B Data is divided into 100 sec bins |
 |
 |
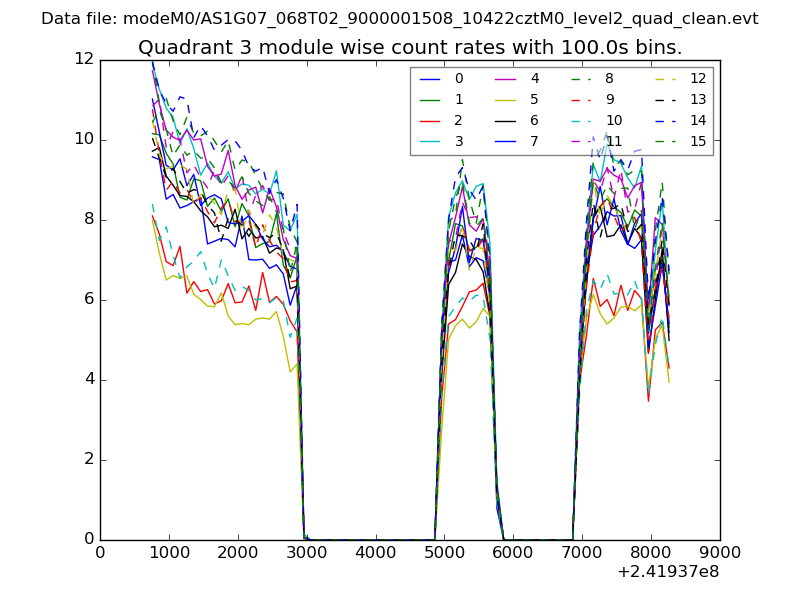
| Module-wise count rates for Quadrant C Data is divided into 100 sec bins |
 |
 |
| Module-wise count rates for Quadrant D Data is divided into 100 sec bins |
 |
 |
| Parameter | Plot |
|---|---|
| CZT HV Monitor | 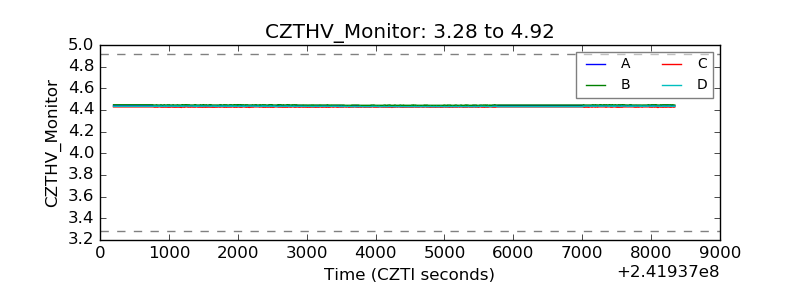 |
| D_VDD |  |
| Temperature 1 |  |
| Veto HV Monitor |  |
| Veto LLD |  |
| Alpha Counter | 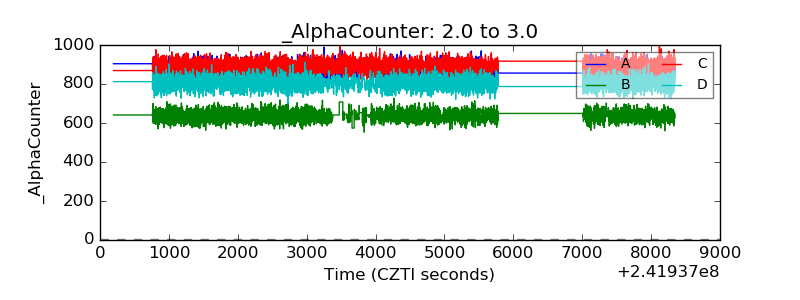 |
| _CPM_Rate | 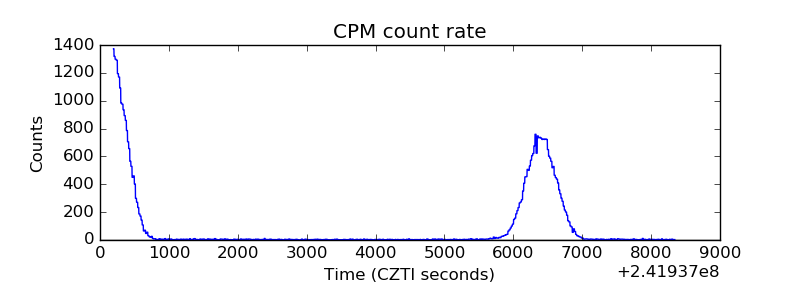 |
| CZT Counter |  |
| +2.5 Volts monitor |  |
| +5 Volts monitor |  |
| _ROLL_ROT | 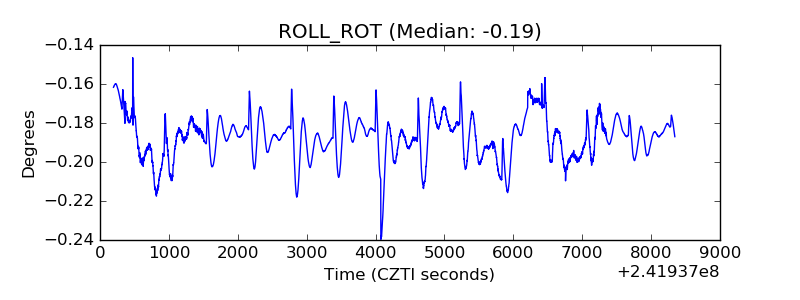 |
| _Roll_DEC |  |
| _Roll_RA |  |
| Veto Counter | 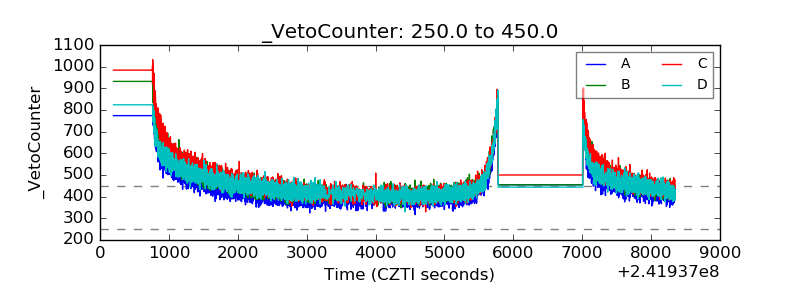 |