| Param | Original file | Final file |
|---|---|---|
| Filename | modeM0/AS1G07_068T02_9000001508_10423cztM0_level2.evt | modeM0/AS1G07_068T02_9000001508_10423cztM0_level2_quad_clean.evt |
| Size (bytes) | 1,233,725,760 | 188,167,680 |
| Size | 1.1 GB | 179.5 MB |
| Events in quadrant A | 10,189,805 | 1,129,739 |
| Events in quadrant B | 8,971,101 | 1,189,958 |
| Events in quadrant C | 7,070,449 | 1,221,706 |
| Events in quadrant D | 10,152,137 | 1,155,053 |
| Mode SS | |||
|---|---|---|---|
| Quadrant | BADHDUFLAG | Total packets | Discarded packets |
| A | 0 | 378 | 72 |
| B | 0 | 378 | 74 |
| C | 0 | 378 | 75 |
| D | 0 | 369 | 68 |
| Mode M9 | |||
|---|---|---|---|
| Quadrant | BADHDUFLAG | Total packets | Discarded packets |
| A | 0 | 36 | 0 |
| B | 0 | 36 | 0 |
| C | 0 | 36 | 0 |
| D | 0 | 36 | 0 |
| Mode M0 | |||
|---|---|---|---|
| Quadrant | BADHDUFLAG | Total packets | Discarded packets |
| A | 0 | 54716 | 14873 |
| B | 0 | 50055 | 14182 |
| C | 0 | 38810 | 8138 |
| D | 0 | 50490 | 10532 |
| Quadrant | Total seconds | Saturated seconds | Saturation percentage |
|---|---|---|---|
| A | 14098 | 474 | 3.362179% |
| B | 14254 | 567 | 3.977831% |
| C | 14772 | 179 | 1.211752% |
| D | 14922 | 569 | 3.813162% |
Noise dominated data is calculated using 1-second bins in cleaned event files. If a bin has >2000 counts, and if more than 50% of those come from <1% of pixels, then it is considered to be noise-dominated and hence unusable.
| Quadrant | # 1 sec bins | Bins with >0 counts | Bins with >2000 counts | High rate bins dominated by noise | Noise dominated (total time) | Noise dominated (detector-on time) | Marked lightcurve |
|---|---|---|---|---|---|---|---|
| A | 18849 | 14757 | 120 | 120 | 0.64% | 0.81% | 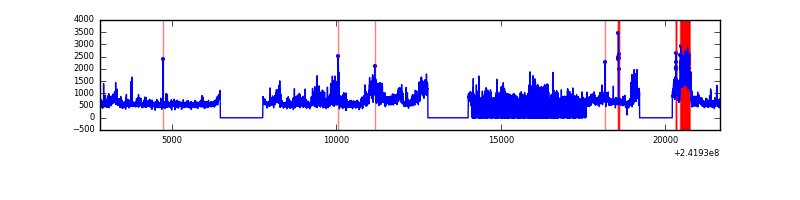 |
| B | 18849 | 14838 | 227 | 227 | 1.20% | 1.53% | 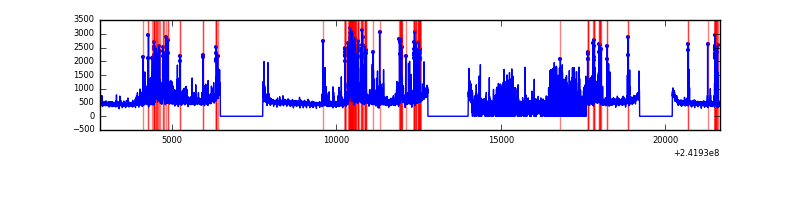 |
| C | 18849 | 15246 | 15 | 15 | 0.08% | 0.10% | 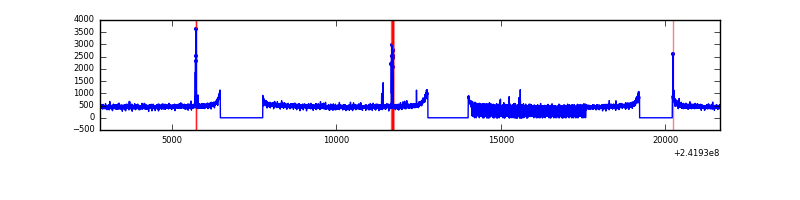 |
| D | 18849 | 15185 | 333 | 333 | 1.77% | 2.19% | 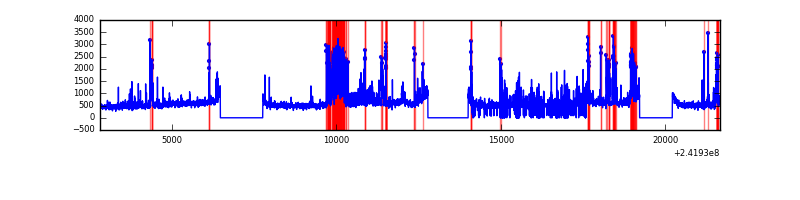 |
Top three noisy pixels from each quadrant. If the there are fewer than three noisy pixels in the level2.evt file, extra rows are filled as -1
| Pixel properties | Quadrant properties | ||||||
|---|---|---|---|---|---|---|---|
| Quadrant | DetID | PixID | Counts | Sigma | Mean | Median | Sigma |
| A | 13 | 251 | 3512844 | 10143.65 | 1722 | 1683 | 346.1 |
| A | 14 | 254 | 24084 | 64.72 | 1722 | 1683 | 346.1 |
| A | 13 | 248 | 18963 | 49.92 | 1722 | 1683 | 346.1 |
| B | 4 | 239 | 1710678 | 5229.58 | 1737 | 1695 | 326.8 |
| B | 4 | 81 | 258381 | 785.47 | 1737 | 1695 | 326.8 |
| B | 0 | 214 | 117976 | 355.83 | 1737 | 1695 | 326.8 |
| C | 14 | 234 | 71864 | 170.04 | 1792 | 1803 | 412.0 |
| C | 13 | 61 | 12969 | 27.1 | 1792 | 1803 | 412.0 |
| C | 14 | 67 | 9343 | 18.3 | 1792 | 1803 | 412.0 |
| D | 2 | 33 | 1096557 | 2554.99 | 1790 | 1741 | 428.5 |
| D | 8 | 195 | 968681 | 2256.56 | 1790 | 1741 | 428.5 |
| D | 1 | 20 | 611651 | 1423.35 | 1790 | 1741 | 428.5 |
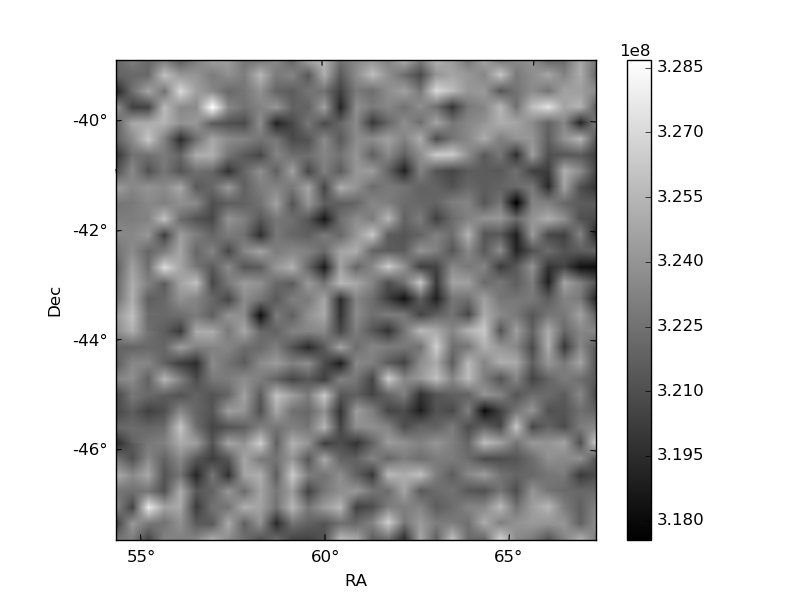
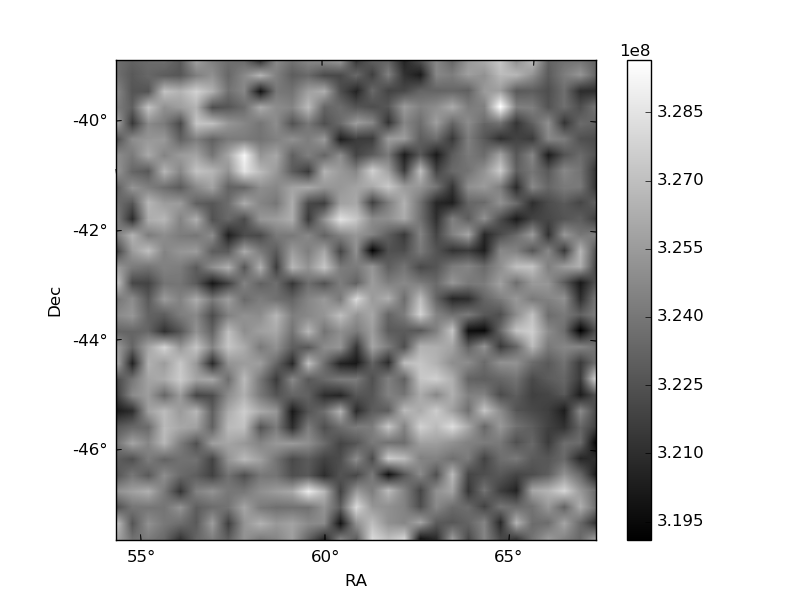
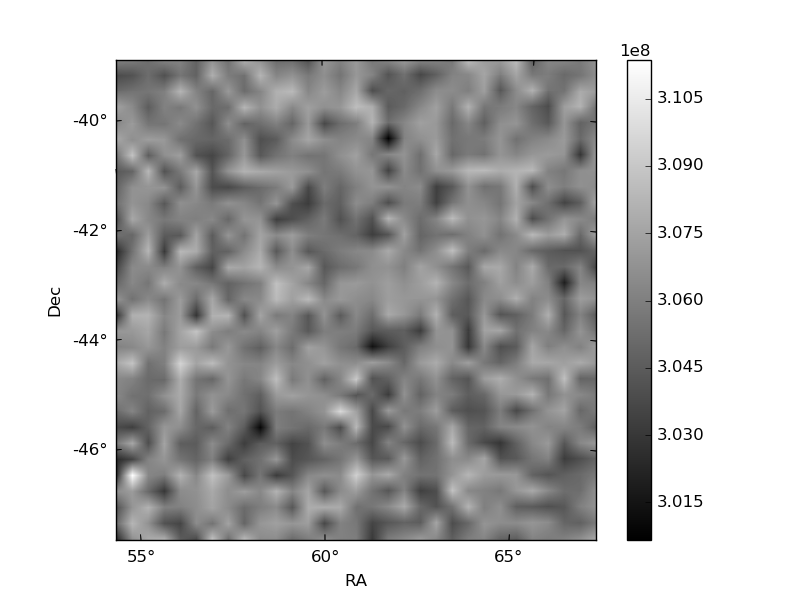
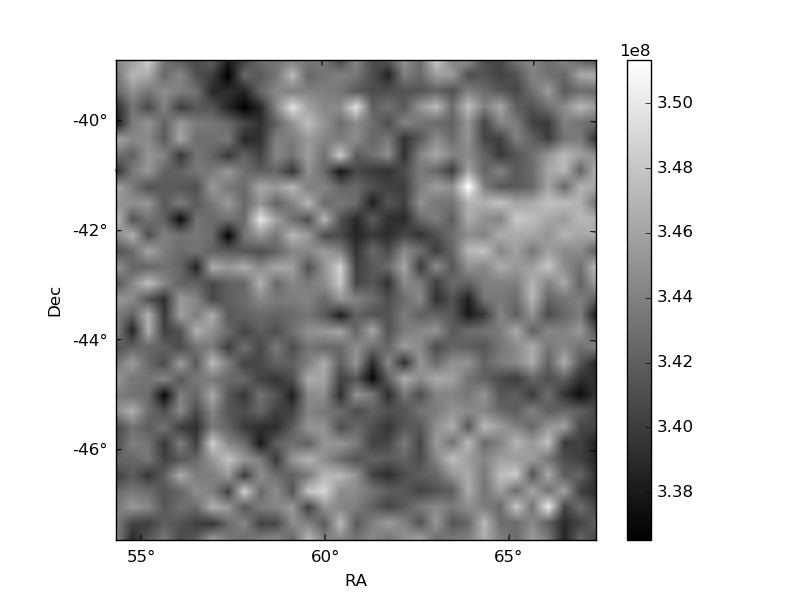
Histogram calculated using DETX and DETY for each event in the final _common_clean file
| Quadrant A |  |
 |
Quadrant B |
|---|---|---|---|
| Quadrant D |  |
 |
Quadrant C |
| Plot type | Count rate plots | Images |
|---|---|---|
| Comparison with Poisson distribution Blue bars denote a histogram of data divided into 1 sec bins. Red curve is a Poisson curve with rate = median count rate of data. |
 |
 |
| Quadrant-wise count rates Data is divided into 100 sec bins |
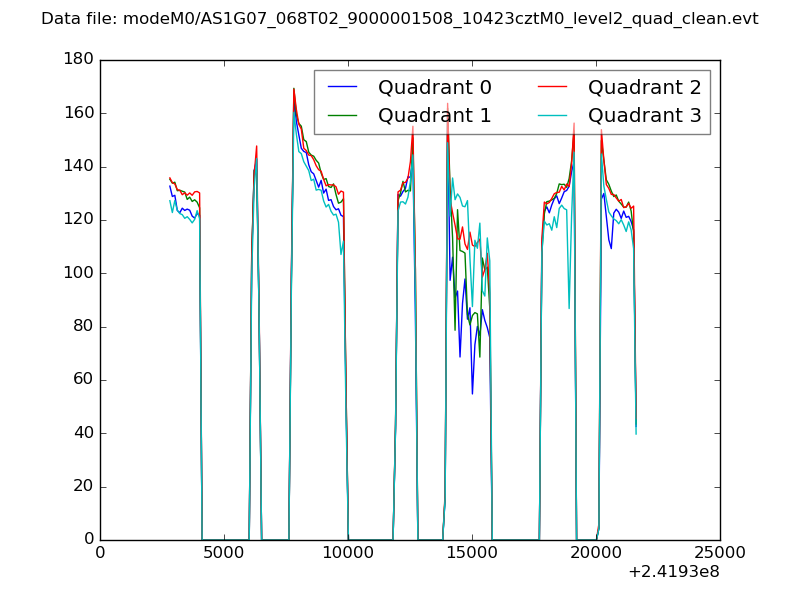 |
|
| Module-wise count rates for Quadrant A Data is divided into 100 sec bins |
 |
 |
| Module-wise count rates for Quadrant B Data is divided into 100 sec bins |
 |
 |
| Module-wise count rates for Quadrant C Data is divided into 100 sec bins |
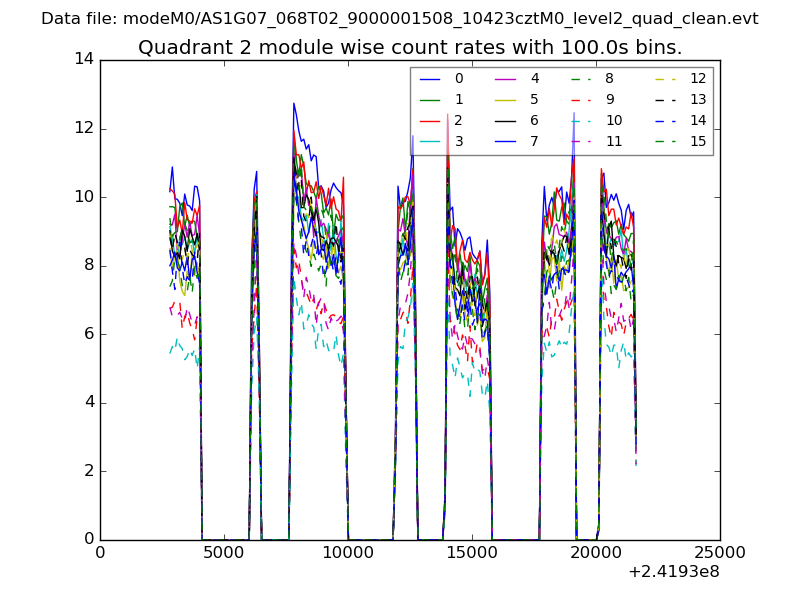 |
 |
| Module-wise count rates for Quadrant D Data is divided into 100 sec bins |
 |
 |
| Parameter | Plot |
|---|---|
| CZT HV Monitor | 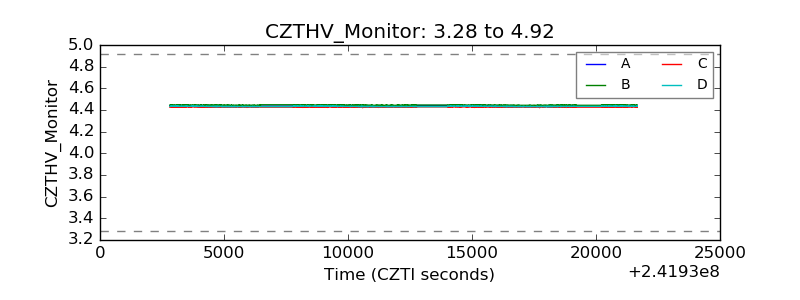 |
| D_VDD | 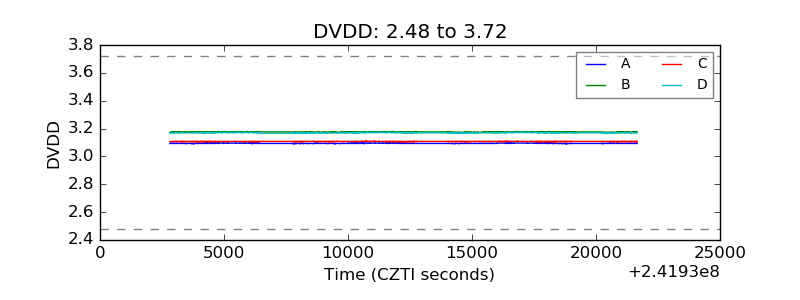 |
| Temperature 1 | 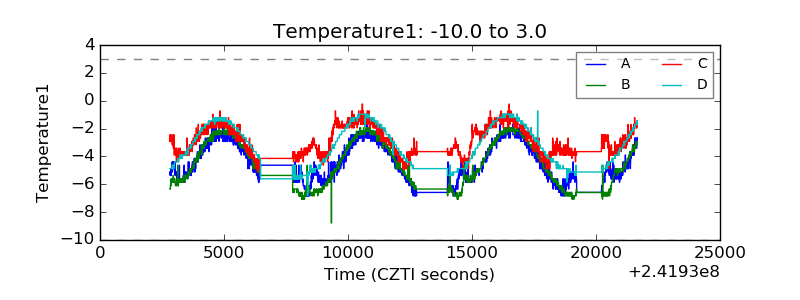 |
| Veto HV Monitor |  |
| Veto LLD | 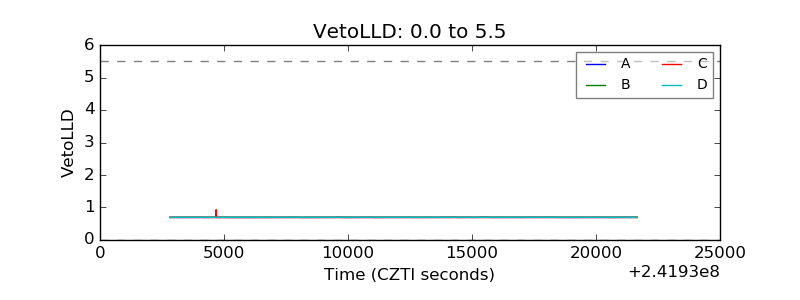 |
| Alpha Counter | 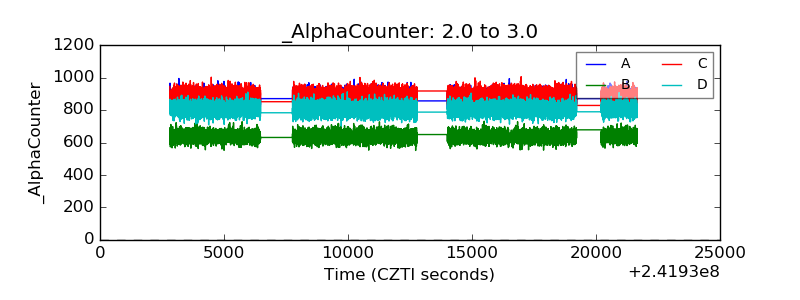 |
| _CPM_Rate | 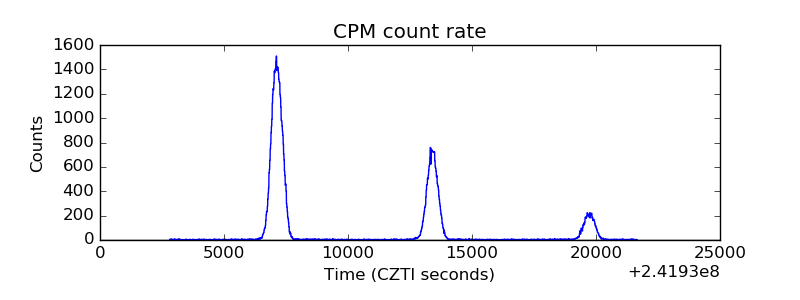 |
| CZT Counter |  |
| +2.5 Volts monitor |  |
| +5 Volts monitor |  |
| _ROLL_ROT |  |
| _Roll_DEC |  |
| _Roll_RA |  |
| Veto Counter | 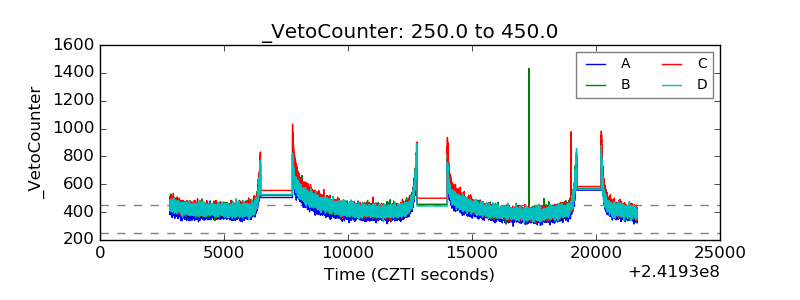 |