| Param | Original file | Final file |
|---|---|---|
| Filename | modeM0/AS1G07_068T02_9000001508_10424cztM0_level2.evt | modeM0/AS1G07_068T02_9000001508_10424cztM0_level2_quad_clean.evt |
| Size (bytes) | 289,195,200 | 33,027,840 |
| Size | 275.8 MB | 31.5 MB |
| Events in quadrant A | 2,354,306 | 184,711 |
| Events in quadrant B | 2,101,585 | 188,098 |
| Events in quadrant C | 1,528,463 | 192,694 |
| Events in quadrant D | 2,530,959 | 181,907 |
| Mode SS | |||
|---|---|---|---|
| Quadrant | BADHDUFLAG | Total packets | Discarded packets |
| A | 0 | 70 | 0 |
| B | 0 | 70 | 0 |
| C | 0 | 70 | 0 |
| D | 0 | 70 | 0 |
| Mode M0 | |||
|---|---|---|---|
| Quadrant | BADHDUFLAG | Total packets | Discarded packets |
| A | 0 | 9354 | 0 |
| B | 0 | 8574 | 0 |
| C | 0 | 7152 | 2 |
| D | 0 | 9643 | 0 |
| Quadrant | Total seconds | Saturated seconds | Saturation percentage |
|---|---|---|---|
| A | 3564 | 60 | 1.683502% |
| B | 3564 | 106 | 2.974186% |
| C | 3563 | 0 | 0.000000% |
| D | 3564 | 160 | 4.489338% |
Noise dominated data is calculated using 1-second bins in cleaned event files. If a bin has >2000 counts, and if more than 50% of those come from <1% of pixels, then it is considered to be noise-dominated and hence unusable.
| Quadrant | # 1 sec bins | Bins with >0 counts | Bins with >2000 counts | High rate bins dominated by noise | Noise dominated (total time) | Noise dominated (detector-on time) | Marked lightcurve |
|---|---|---|---|---|---|---|---|
| A | 3564 | 3564 | 40 | 40 | 1.12% | 1.12% | 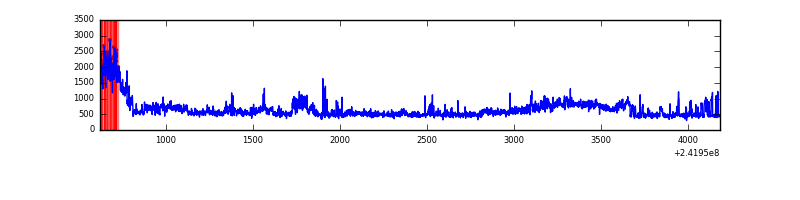 |
| B | 3564 | 3564 | 86 | 86 | 2.41% | 2.41% | 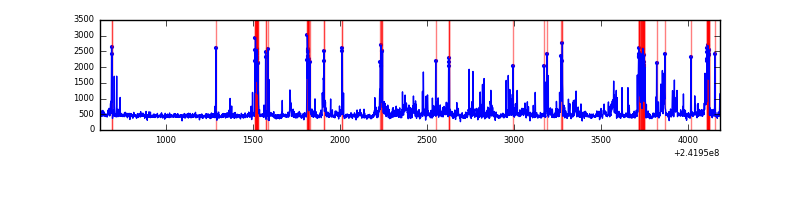 |
| C | 3564 | 3564 | 0 | 0 | 0.00% | 0.00% | 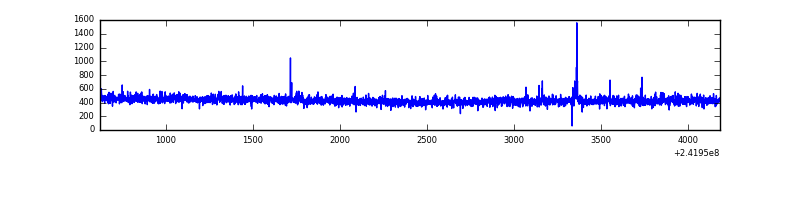 |
| D | 3564 | 3564 | 174 | 174 | 4.88% | 4.88% | 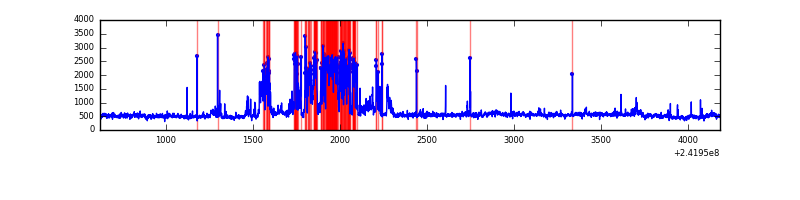 |
Top three noisy pixels from each quadrant. If the there are fewer than three noisy pixels in the level2.evt file, extra rows are filled as -1
| Pixel properties | Quadrant properties | ||||||
|---|---|---|---|---|---|---|---|
| Quadrant | DetID | PixID | Counts | Sigma | Mean | Median | Sigma |
| A | 13 | 251 | 817841 | 9941.41 | 398 | 389 | 82.2 |
| A | 0 | 226 | 3625 | 39.35 | 398 | 389 | 82.2 |
| A | 12 | 194 | 3268 | 35.01 | 398 | 389 | 82.2 |
| B | 4 | 239 | 322814 | 4263.14 | 394 | 384 | 75.6 |
| B | 4 | 81 | 103438 | 1362.57 | 394 | 384 | 75.6 |
| B | 10 | 245 | 71786 | 944.07 | 394 | 384 | 75.6 |
| C | 14 | 234 | 7109 | 74.49 | 389 | 390 | 90.2 |
| C | 13 | 61 | 2846 | 27.23 | 389 | 390 | 90.2 |
| C | 14 | 67 | 1951 | 17.31 | 389 | 390 | 90.2 |
| D | 2 | 33 | 642763 | 6951.11 | 385 | 375 | 92.4 |
| D | 8 | 195 | 343240 | 3710.05 | 385 | 375 | 92.4 |
| D | 1 | 20 | 24037 | 256.04 | 385 | 375 | 92.4 |
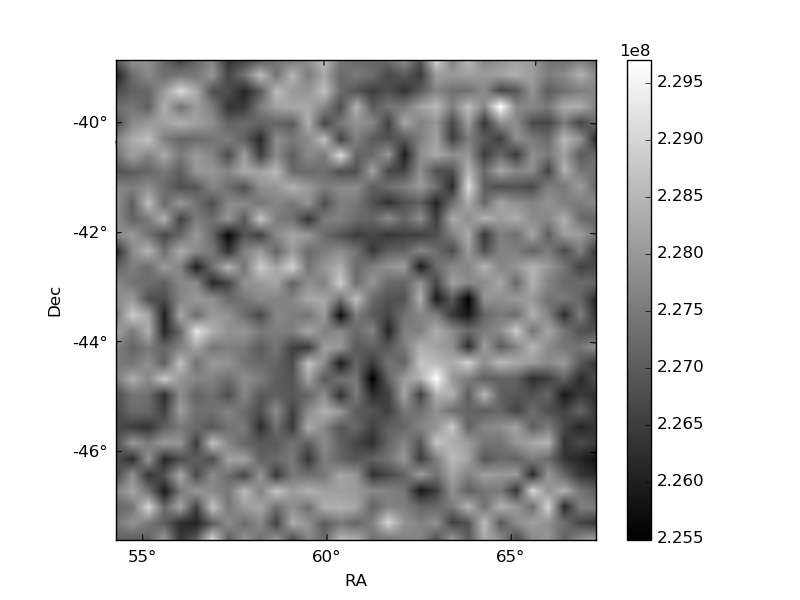
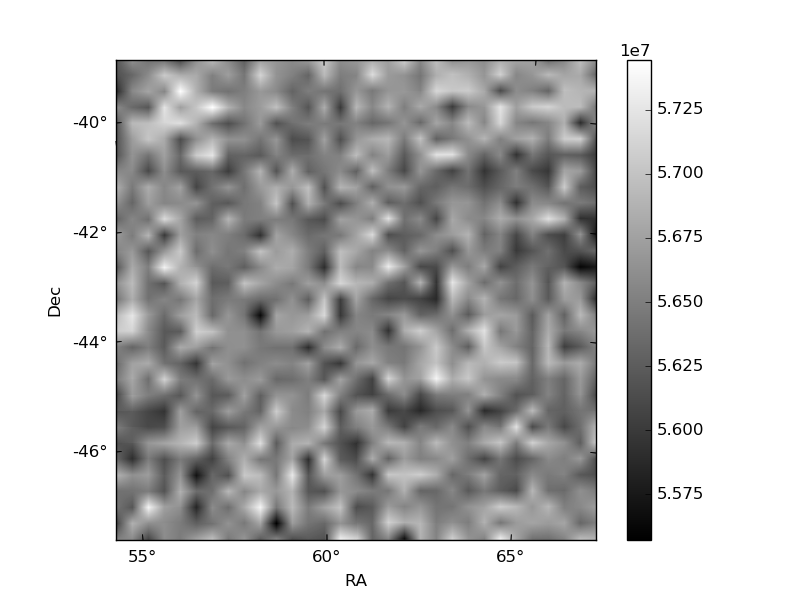
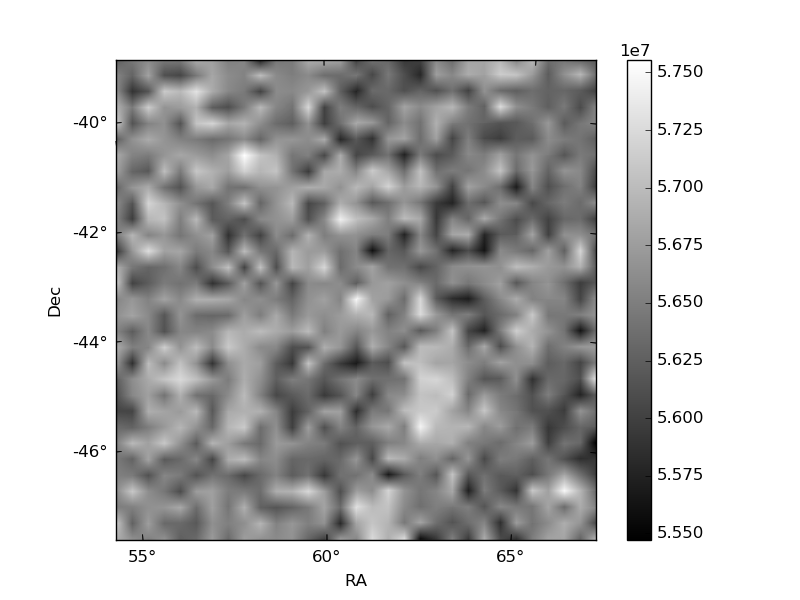
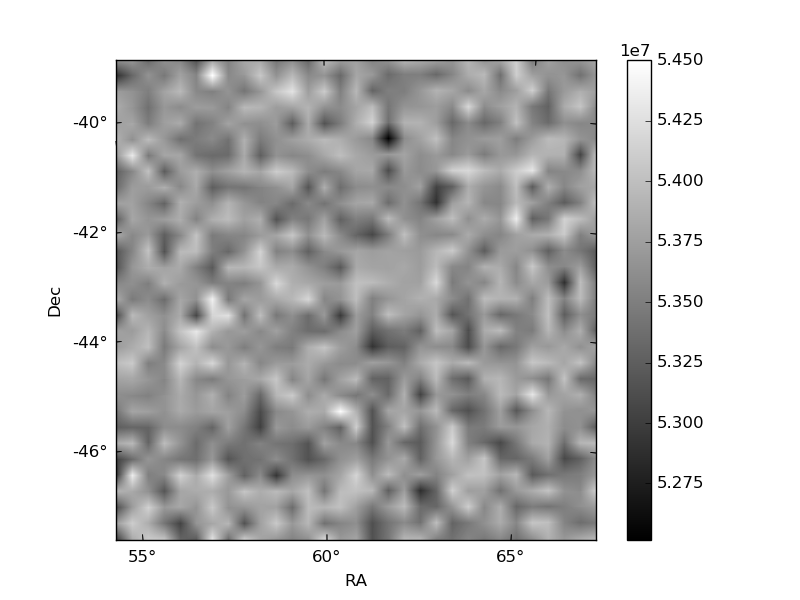
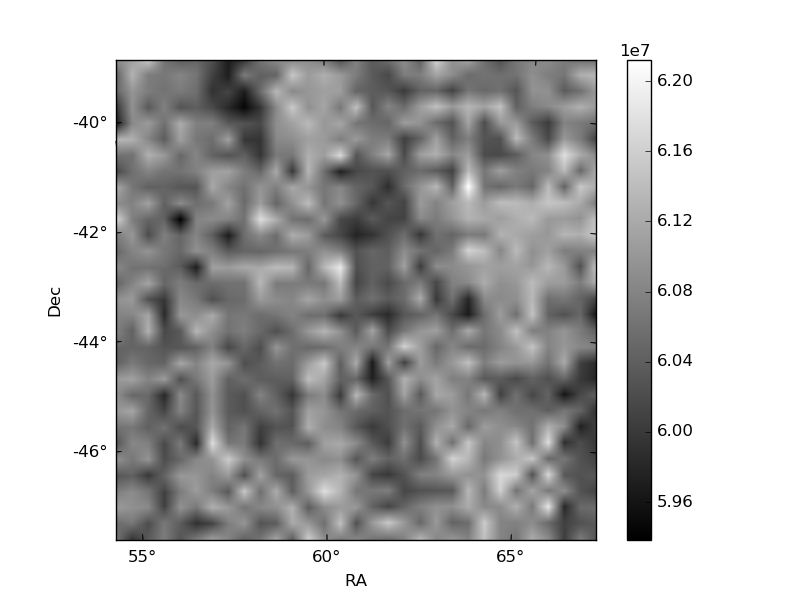
Histogram calculated using DETX and DETY for each event in the final _common_clean file
| Quadrant A | 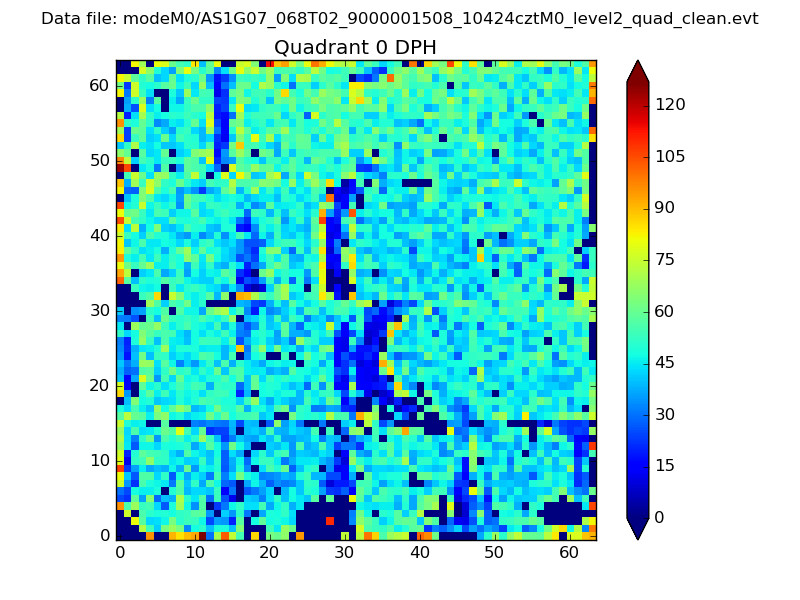 |
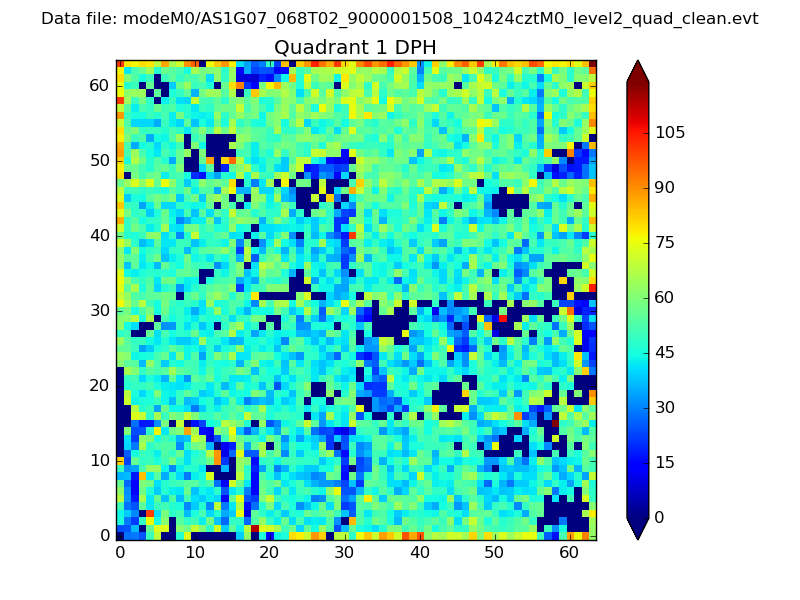 |
Quadrant B |
|---|---|---|---|
| Quadrant D | 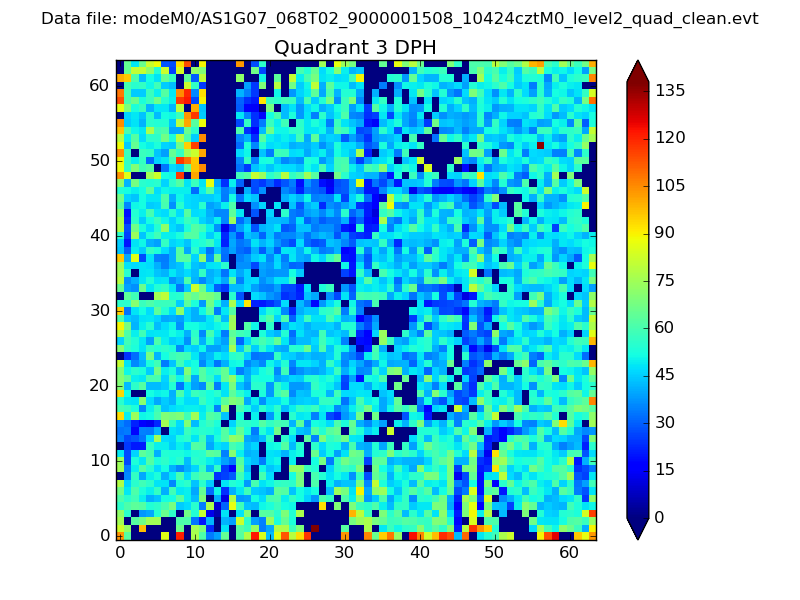 |
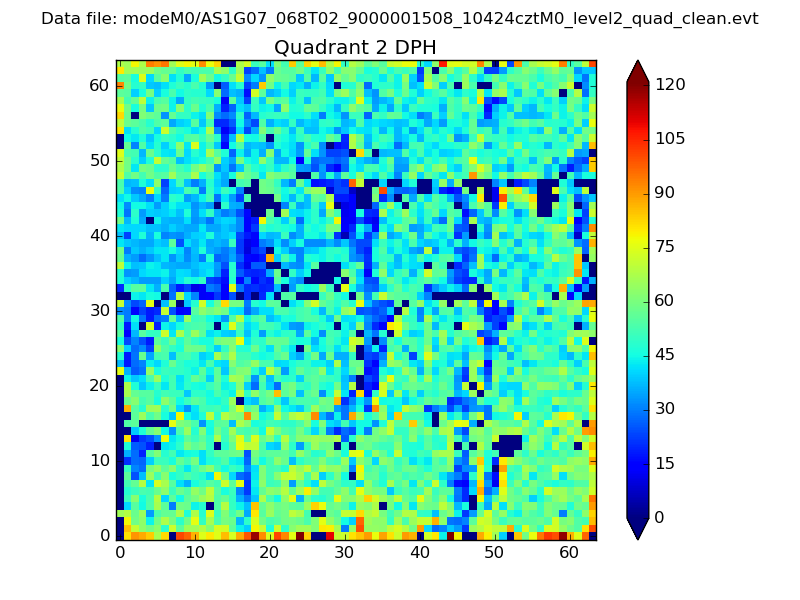 |
Quadrant C |
| Plot type | Count rate plots | Images |
|---|---|---|
| Comparison with Poisson distribution Blue bars denote a histogram of data divided into 1 sec bins. Red curve is a Poisson curve with rate = median count rate of data. |
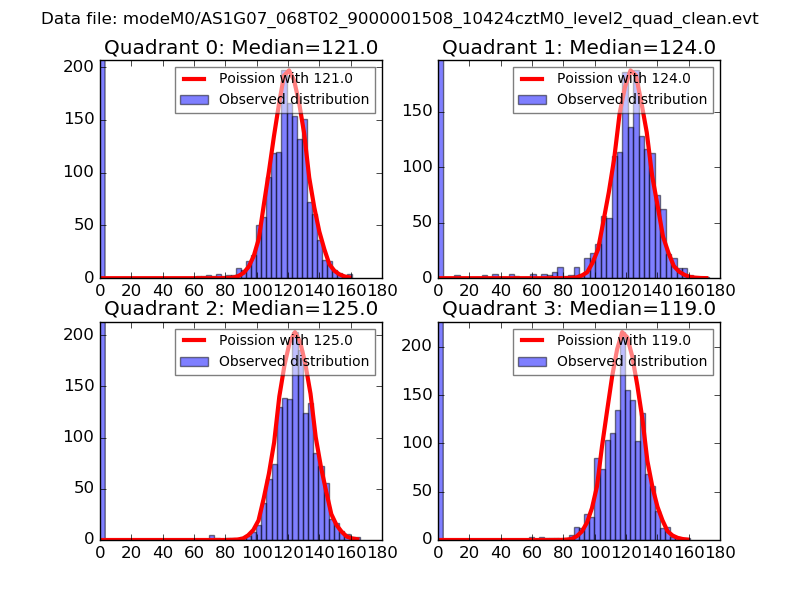 |
 |
| Quadrant-wise count rates Data is divided into 100 sec bins |
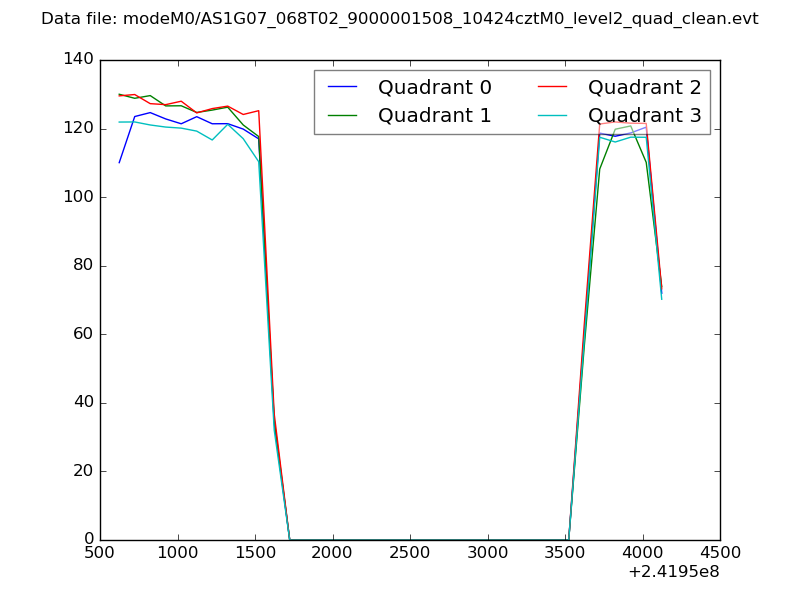 |
|
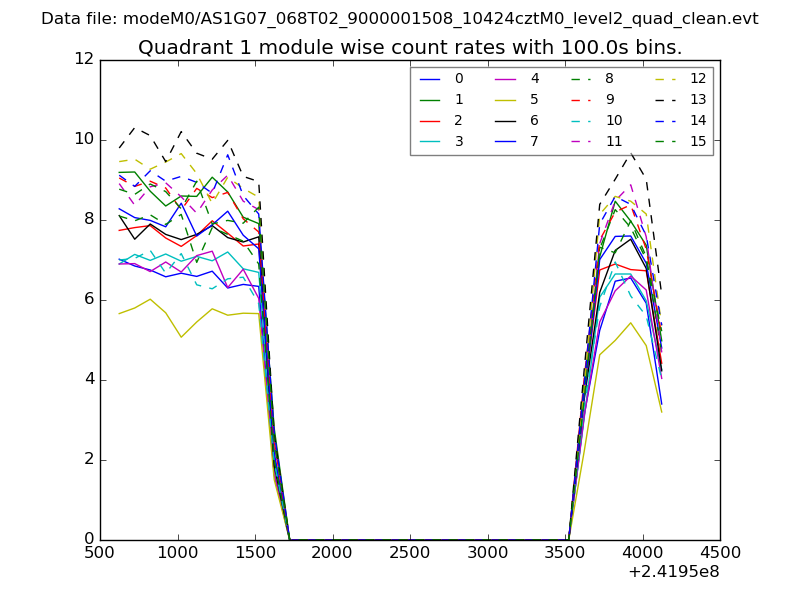
| Module-wise count rates for Quadrant A Data is divided into 100 sec bins |
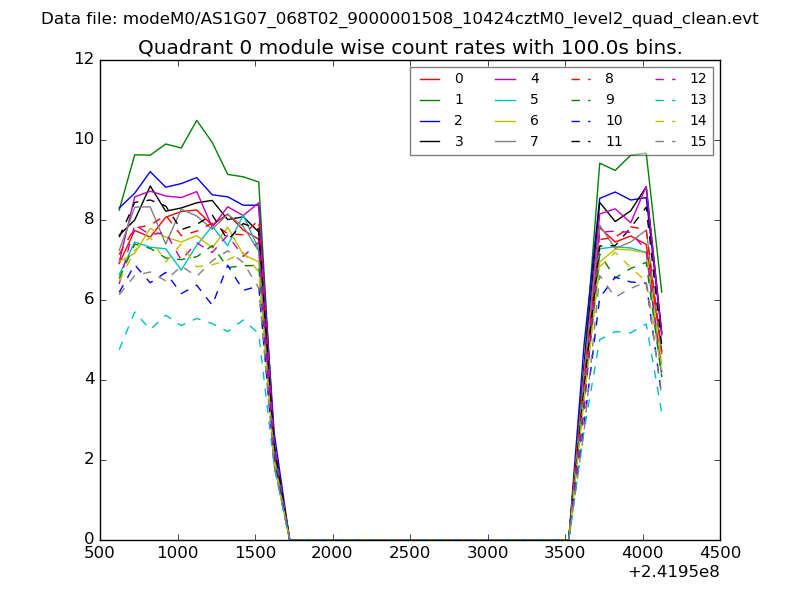 |
 |
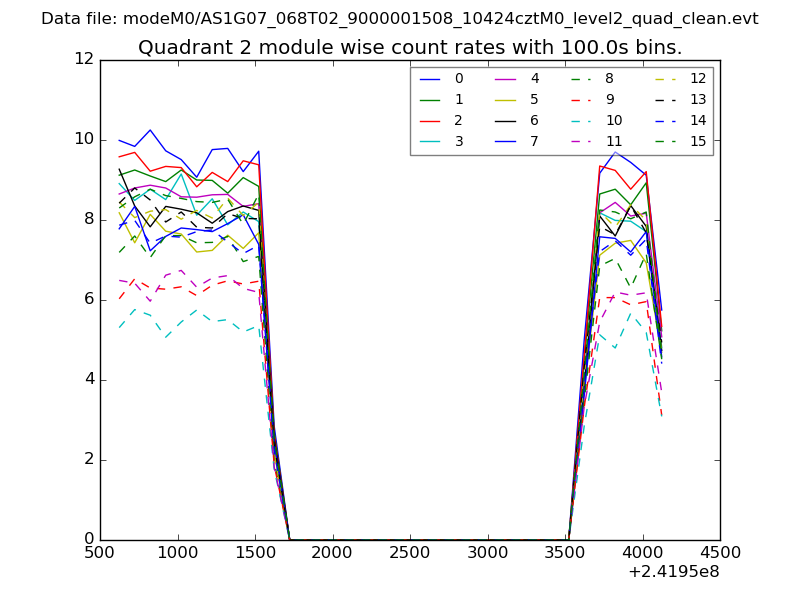
| Module-wise count rates for Quadrant B Data is divided into 100 sec bins |
 |
 |
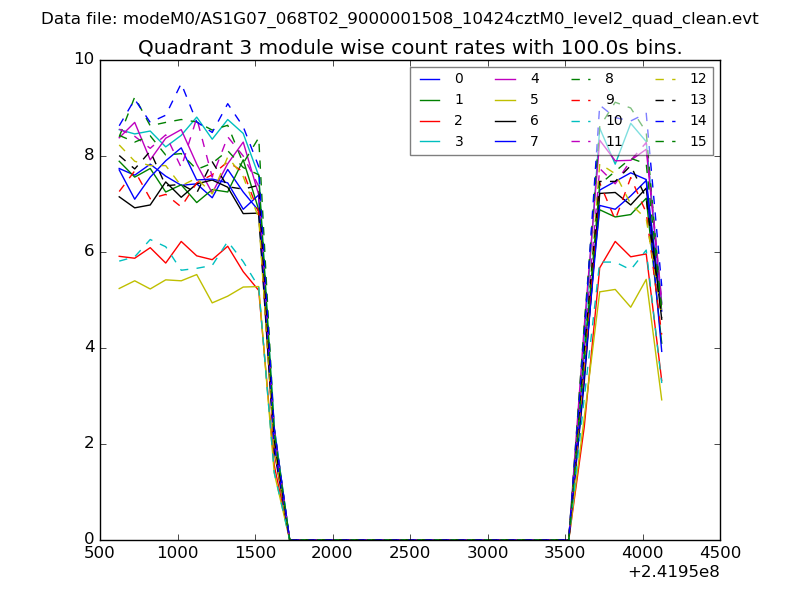
| Module-wise count rates for Quadrant C Data is divided into 100 sec bins |
 |
 |
| Module-wise count rates for Quadrant D Data is divided into 100 sec bins |
 |
 |
| Parameter | Plot |
|---|---|
| CZT HV Monitor | 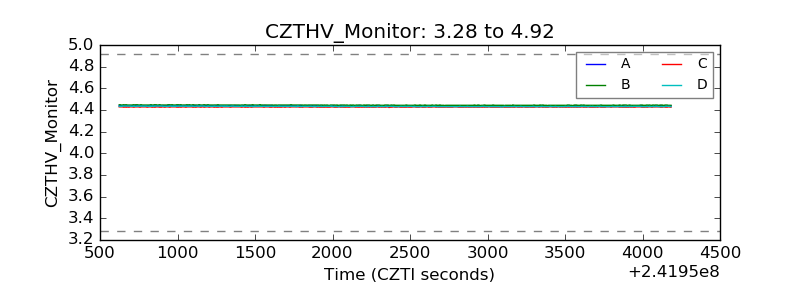 |
| D_VDD | 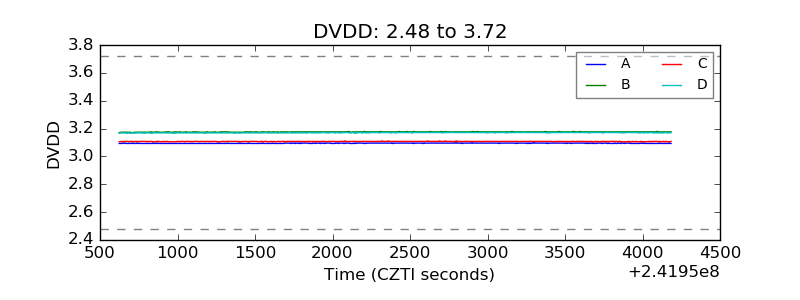 |
| Temperature 1 | 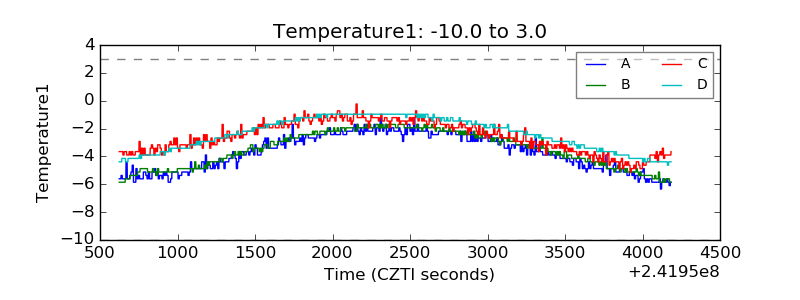 |
| Veto HV Monitor | 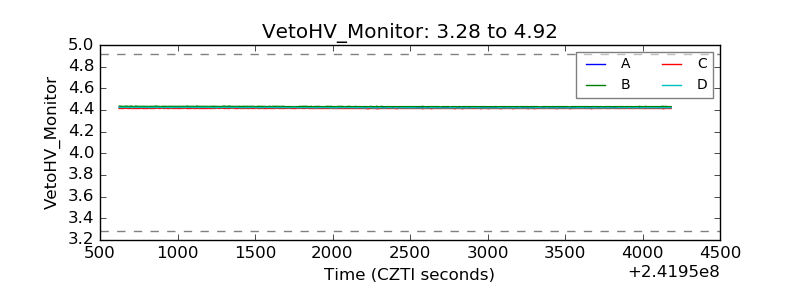 |
| Veto LLD | 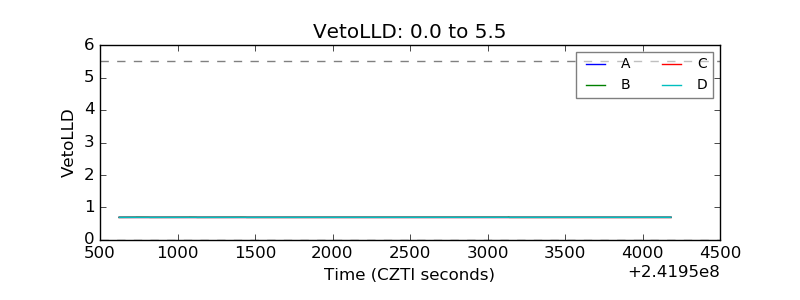 |
| Alpha Counter | 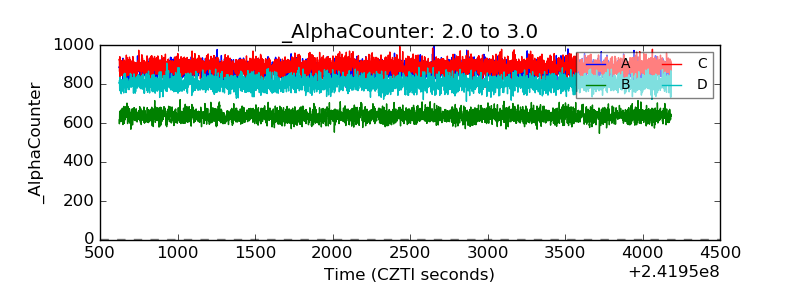 |
| _CPM_Rate | 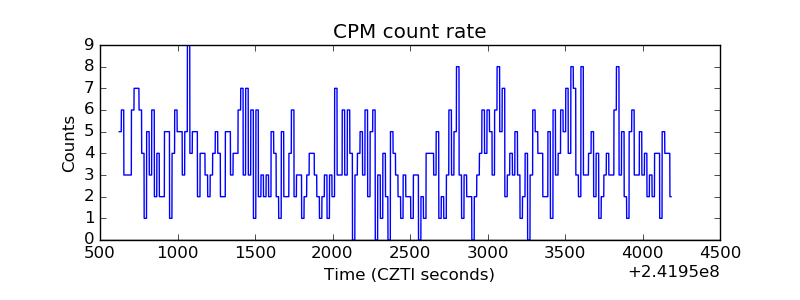 |
| CZT Counter |  |
| +2.5 Volts monitor | 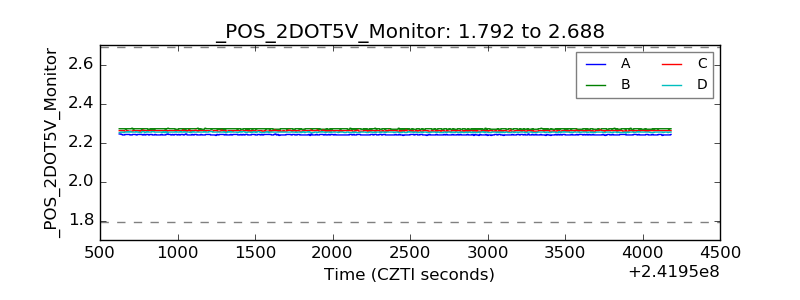 |
| +5 Volts monitor | 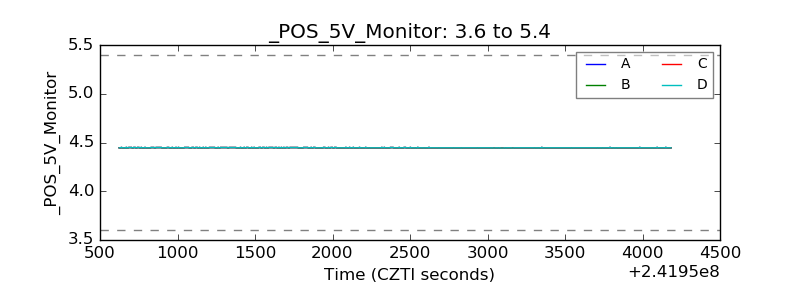 |
| _ROLL_ROT | 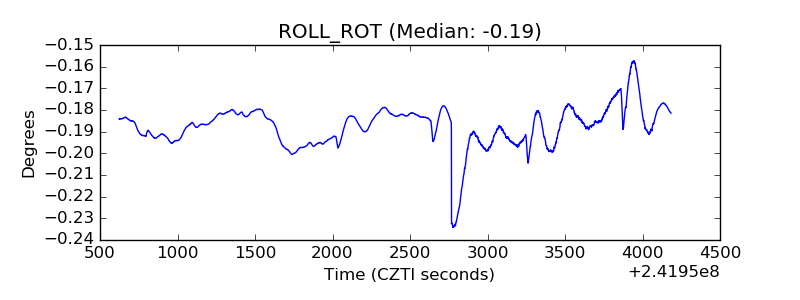 |
| _Roll_DEC | 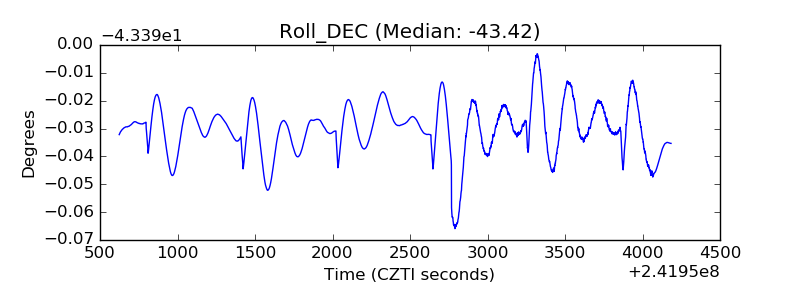 |
| _Roll_RA | 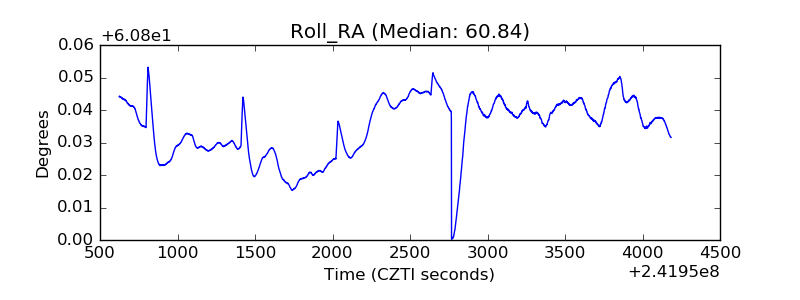 |
| Veto Counter | 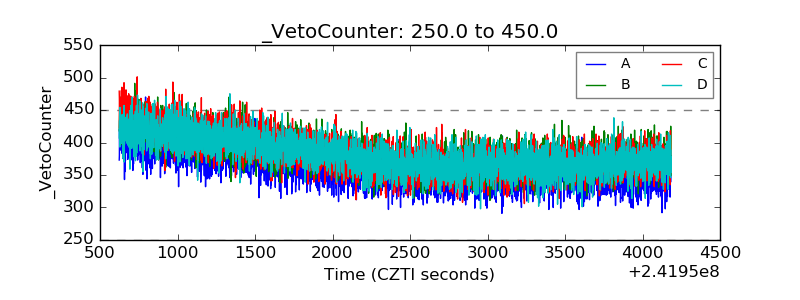 |