| Param | Original file | Final file |
|---|---|---|
| Filename | modeM0/AS1A03_084T01_9000001514cztM0_level2.fits | modeM0/AS1A03_084T01_9000001514cztM0_level2_quad_clean.evt |
| Size (bytes) | 186,393,600 | 156,389,760 |
| Size | 177.8 MB | 149.1 MB |
| Events in quadrant A | 998,724 | 881,203 |
| Events in quadrant B | 1,102,764 | 864,742 |
| Events in quadrant C | 1,141,198 | 838,830 |
| Events in quadrant D | 1,031,476 | 782,392 |
| Mode SS | |||
|---|---|---|---|
| Quadrant | BADHDUFLAG | Total packets | Discarded packets |
| A | 0 | 415 | 0 |
| B | 0 | 409 | 0 |
| C | 0 | 415 | 0 |
| D | 0 | 417 | 0 |
| Mode M0 | |||
|---|---|---|---|
| Quadrant | BADHDUFLAG | Total packets | Discarded packets |
| A | 0 | 60850 | 0 |
| B | 0 | 45408 | 0 |
| C | 0 | 40709 | 0 |
| D | 0 | 47155 | 0 |
| Mode M9 | |||
|---|---|---|---|
| Quadrant | BADHDUFLAG | Total packets | Discarded packets |
| A | 0 | 41 | 0 |
| B | 0 | 41 | 0 |
| C | 0 | 41 | 0 |
| D | 0 | 41 | 0 |
| Quadrant | Total seconds | Saturated seconds | Saturation percentage |
|---|---|---|---|
| A | 19711 | 3478 | 17.644970% |
| B | 19467 | 650 | 3.338984% |
| C | 19709 | 280 | 1.420671% |
| D | 20581 | 349 | 1.695739% |
Noise dominated data is calculated using 1-second bins in cleaned event files. If a bin has >2000 counts, and if more than 50% of those come from <1% of pixels, then it is considered to be noise-dominated and hence unusable.
| Quadrant | # 1 sec bins | Bins with >0 counts | Bins with >2000 counts | High rate bins dominated by noise | Noise dominated (total time) | Noise dominated (detector-on time) | Marked lightcurve |
|---|---|---|---|---|---|---|---|
| A | 24982 | 19160 | 0 | 0 | 0.00% | 0.00% | 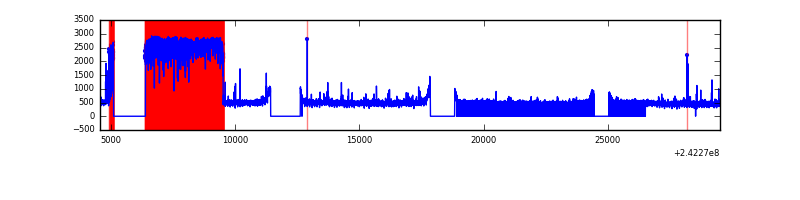 |
| B | 24982 | 19519 | 0 | 0 | 0.00% | 0.00% | 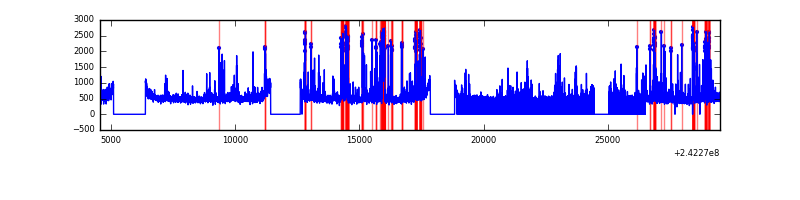 |
| C | 24982 | 19758 | 0 | 0 | 0.00% | 0.00% |  |
| D | 24982 | 20593 | 0 | 0 | 0.00% | 0.00% |  |
Top three noisy pixels from each quadrant. If the there are fewer than three noisy pixels in the level2.evt file, extra rows are filled as -1
| Pixel properties | Quadrant properties | ||||||
|---|---|---|---|---|---|---|---|
| Quadrant | DetID | PixID | Counts | Sigma | Mean | Median | Sigma |
| A | 0 | 29 | 924 | 10.21 | 259 | 243 | 66.7 |
| A | 7 | 110 | 814 | 8.56 | 259 | 243 | 66.7 |
| A | 0 | 30 | 776 | 7.99 | 259 | 243 | 66.7 |
| B | 2 | 9 | 919 | 10.59 | 290 | 277 | 60.6 |
| B | 12 | 226 | 754 | 7.87 | 290 | 277 | 60.6 |
| B | 5 | 232 | 749 | 7.79 | 290 | 277 | 60.6 |
| C | 1 | 81 | 842 | 7.0 | 301 | 280 | 80.3 |
| C | 1 | 80 | 828 | 6.82 | 301 | 280 | 80.3 |
| C | 3 | 158 | 786 | 6.3 | 301 | 280 | 80.3 |
| D | 6 | 231 | 750 | 6.03 | 294 | 267 | 80.1 |
| D | 7 | 5 | 728 | 5.76 | 294 | 267 | 80.1 |
| D | 3 | 14 | 727 | 5.75 | 294 | 267 | 80.1 |
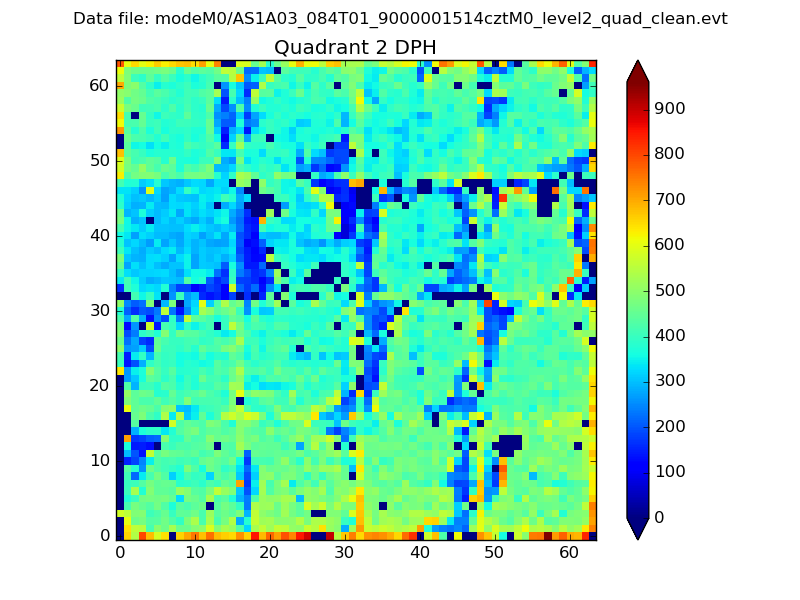
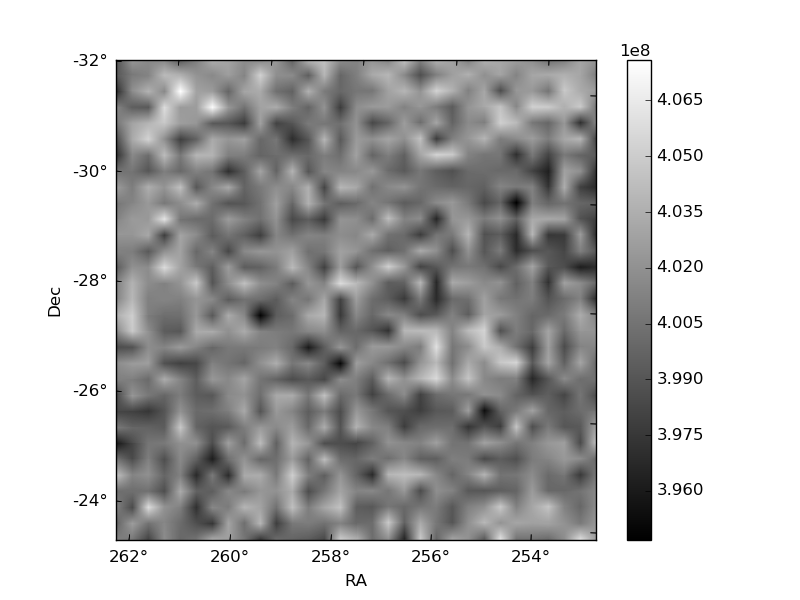
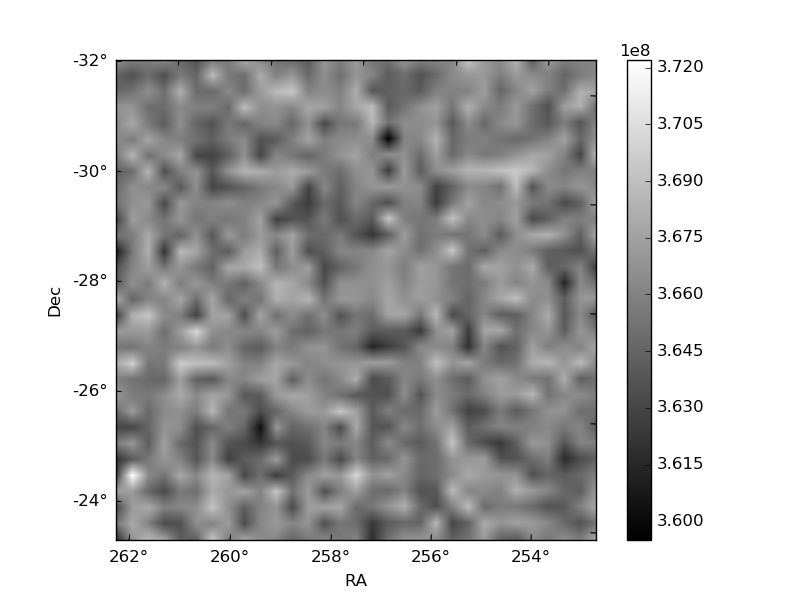
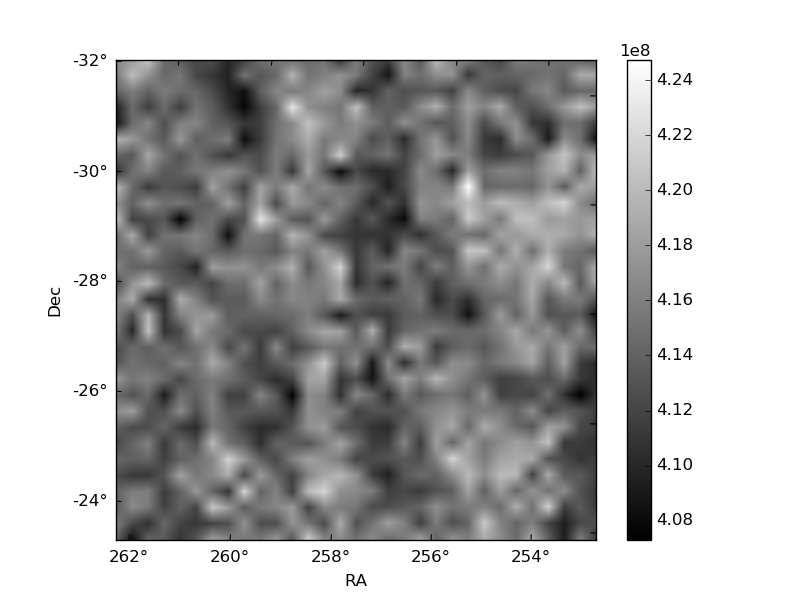
Histogram calculated using DETX and DETY for each event in the final _common_clean file
| Quadrant A | 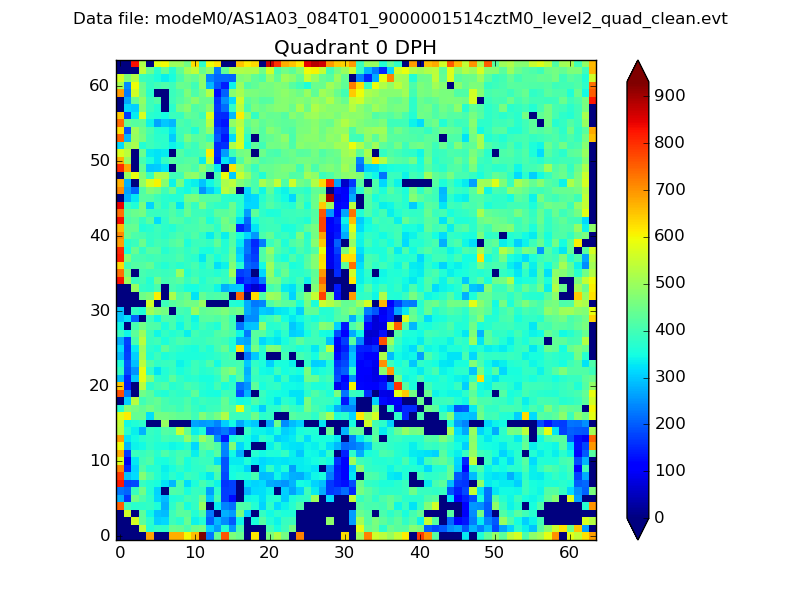 |
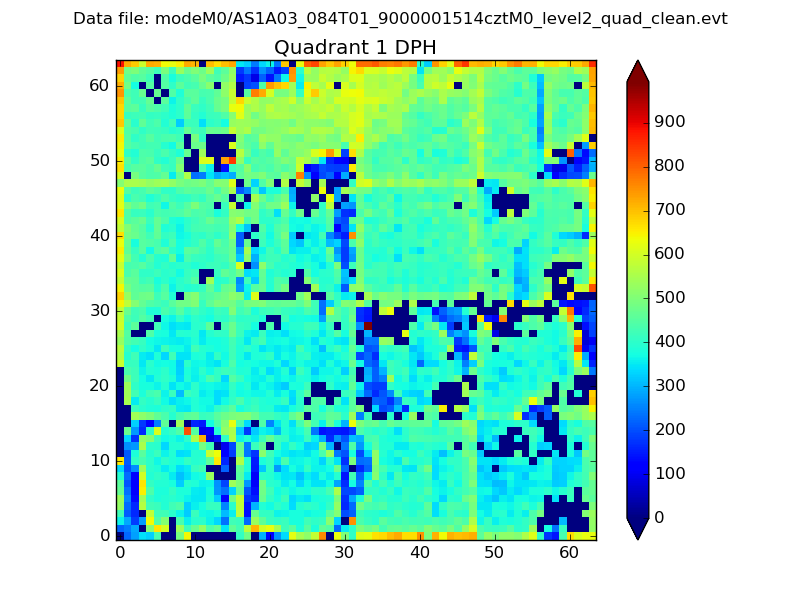 |
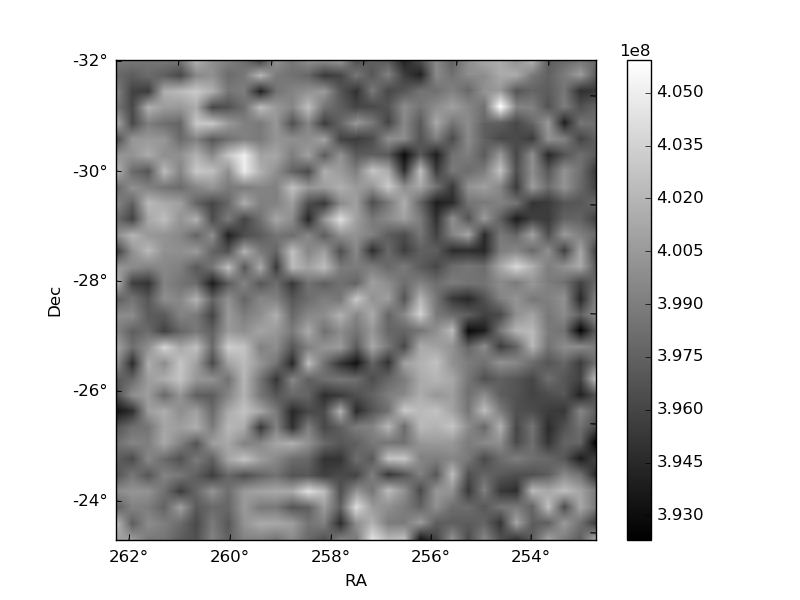
Quadrant B |
|---|---|---|---|
| Quadrant D | 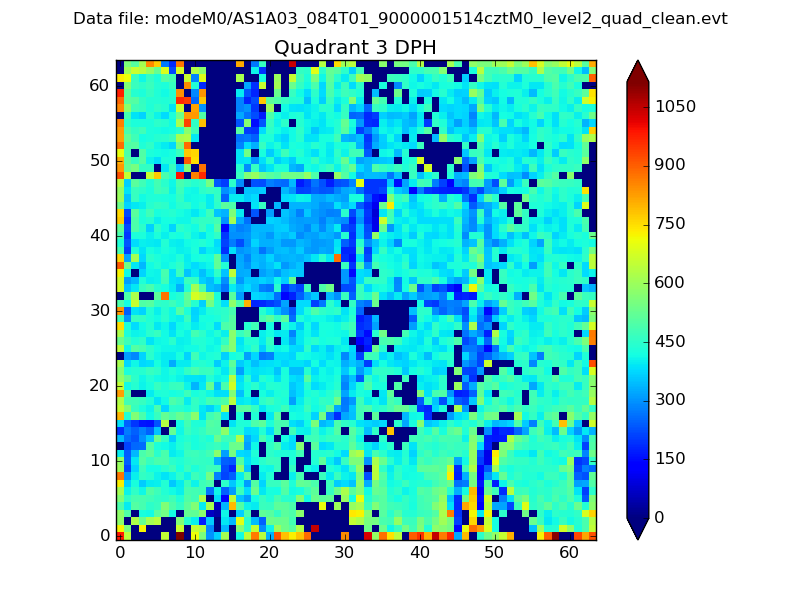 |
 |
Quadrant C |
| Plot type | Count rate plots | Images |
|---|---|---|
| Comparison with Poisson distribution Blue bars denote a histogram of data divided into 1 sec bins. Red curve is a Poisson curve with rate = median count rate of data. |
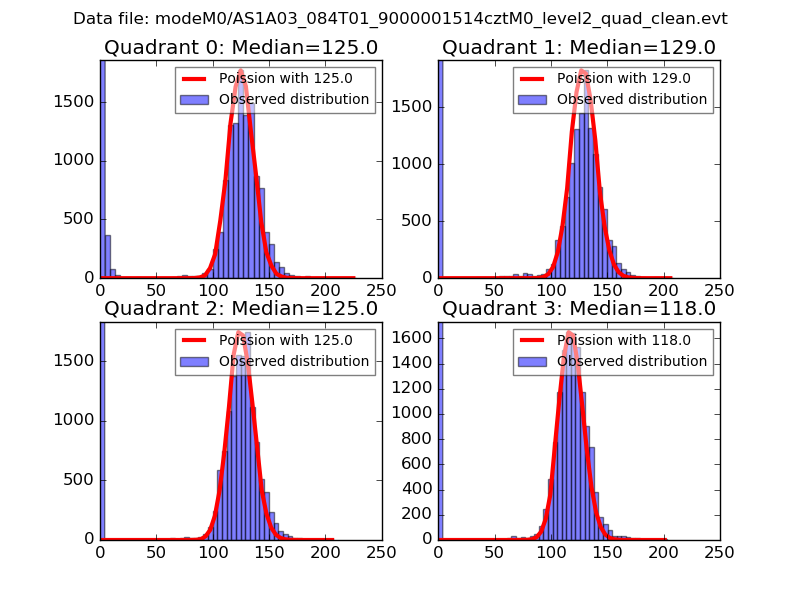 |
 |
| Quadrant-wise count rates Data is divided into 100 sec bins |
 |
|
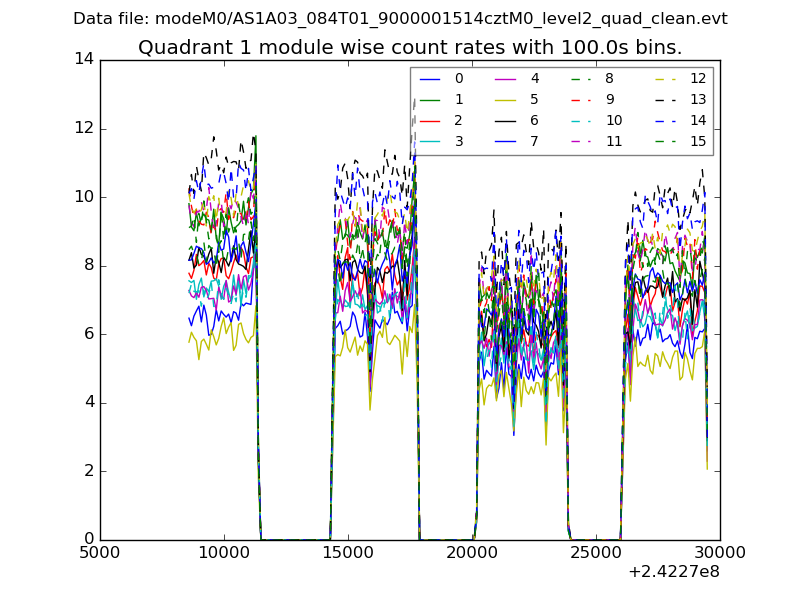
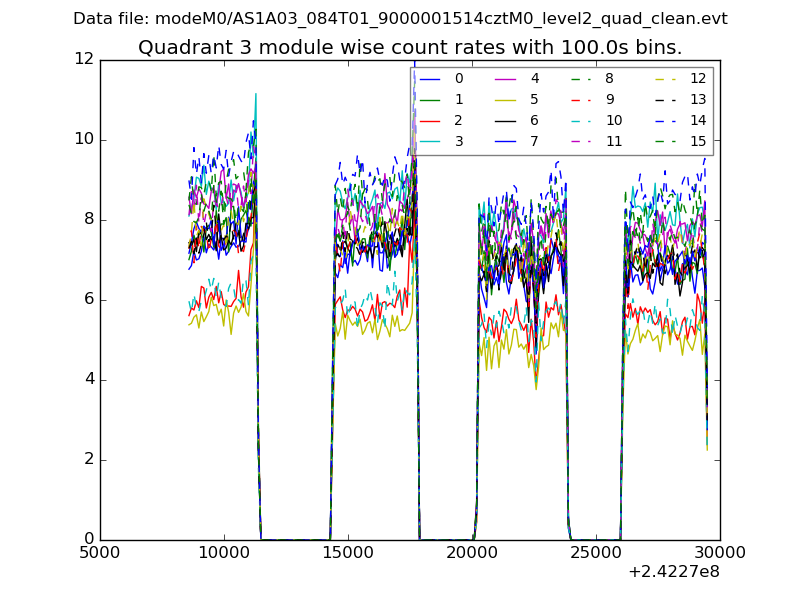
| Module-wise count rates for Quadrant A Data is divided into 100 sec bins |
 |
 |
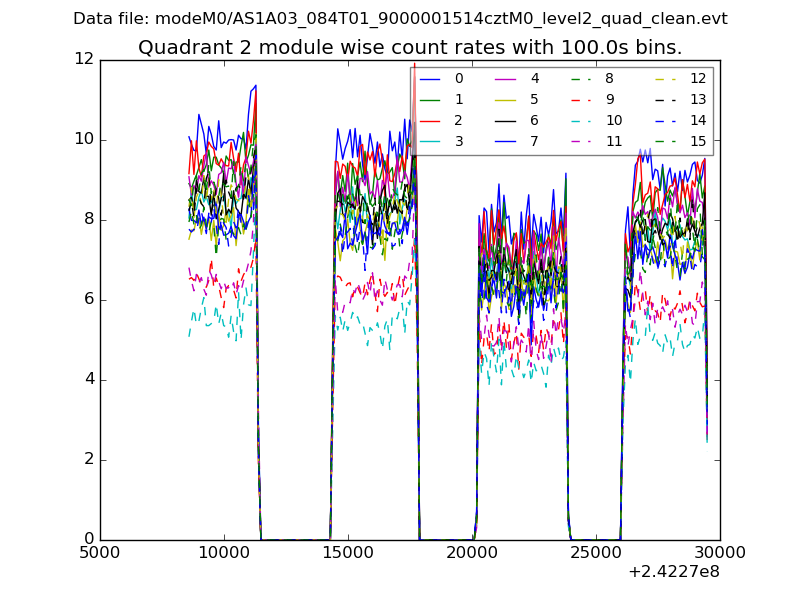
| Module-wise count rates for Quadrant B Data is divided into 100 sec bins |
 |
 |
| Module-wise count rates for Quadrant C Data is divided into 100 sec bins |
 |
 |
| Module-wise count rates for Quadrant D Data is divided into 100 sec bins |
 |
 |
| Parameter | Plot |
|---|---|
| CZT HV Monitor | 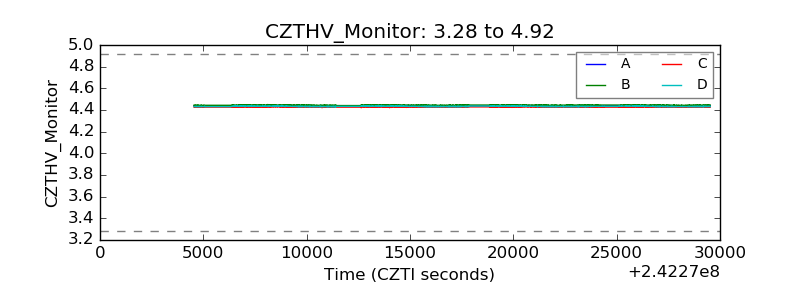 |
| D_VDD | 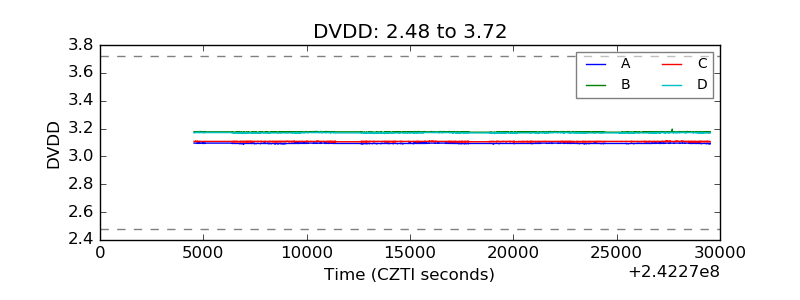 |
| Temperature 1 | 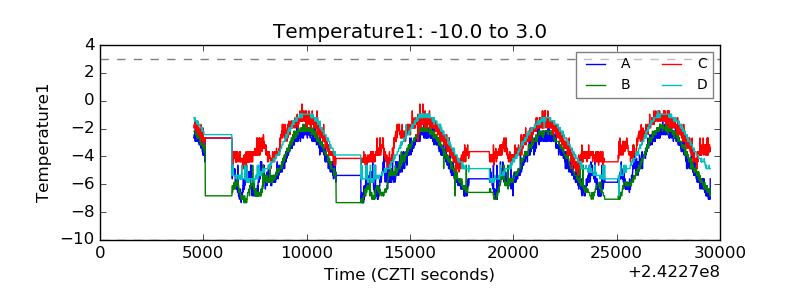 |
| Veto HV Monitor | 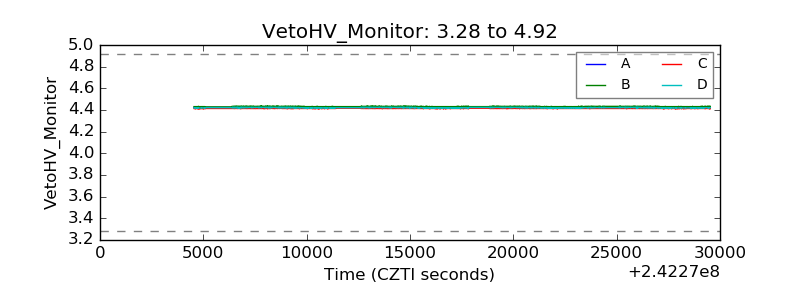 |
| Veto LLD | 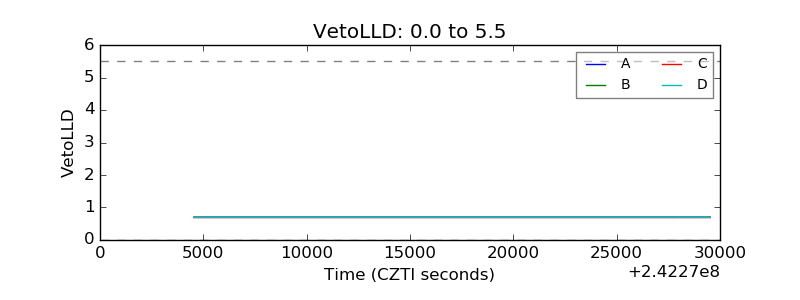 |
| Alpha Counter | 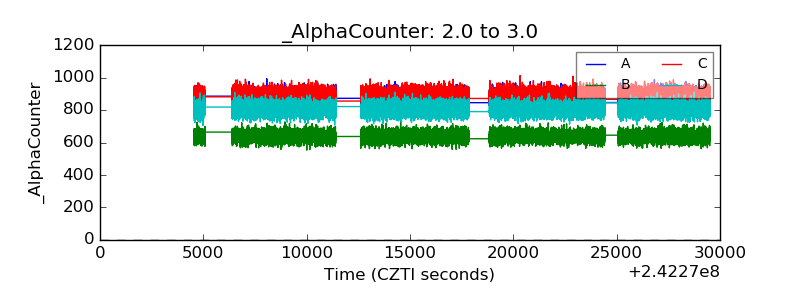 |
| _CPM_Rate | 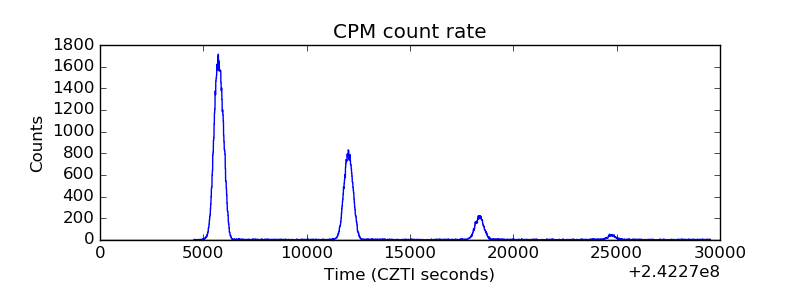 |
| CZT Counter | 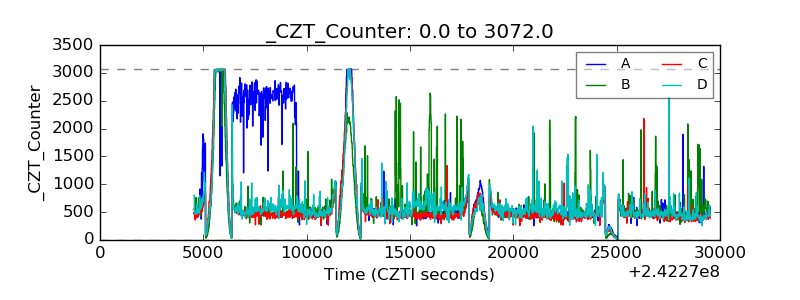 |
| +2.5 Volts monitor | 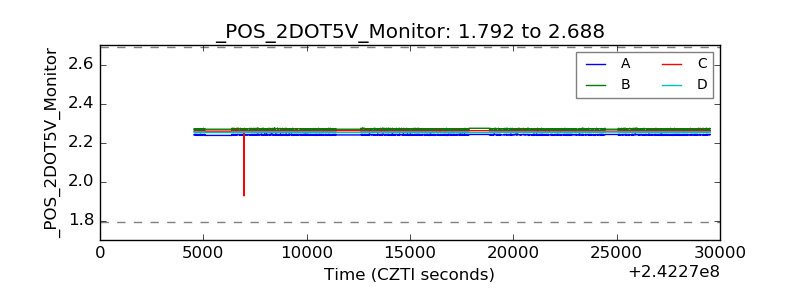 |
| +5 Volts monitor |  |
| _ROLL_ROT | 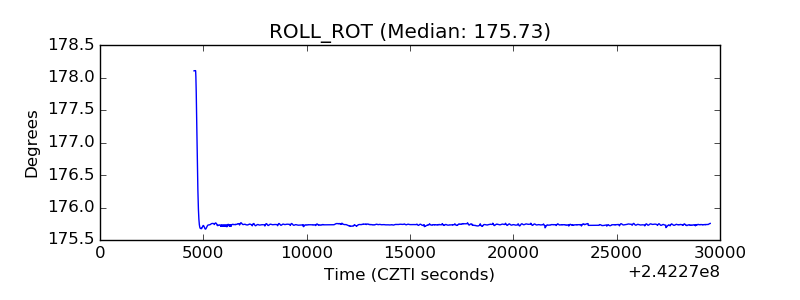 |
| _Roll_DEC | 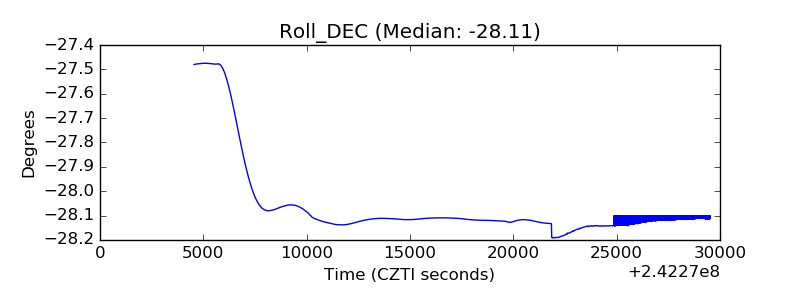 |
| _Roll_RA | 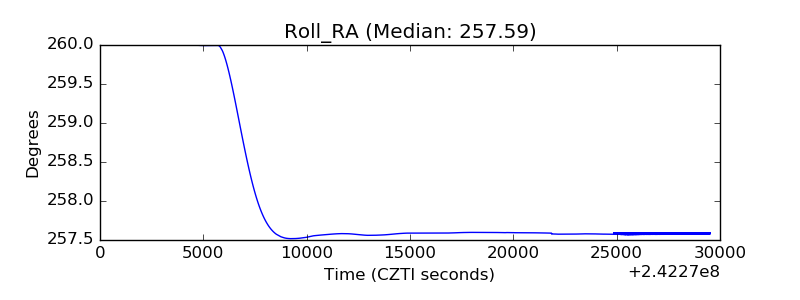 |
| Veto Counter |  |