| Param | Original file | Final file |
|---|---|---|
| Filename | modeM0/AS1A03_084T01_9000001514_10479cztM0_level2.evt | modeM0/AS1A03_084T01_9000001514_10479cztM0_level2_quad_clean.evt |
| Size (bytes) | 105,776,640 | 8,841,600 |
| Size | 100.9 MB | 8.4 MB |
| Events in quadrant A | 253,306 | 30,925 |
| Events in quadrant B | 902,706 | 42,541 |
| Events in quadrant C | 855,040 | 42,085 |
| Events in quadrant D | 1,092,998 | 45,732 |
| Mode SS | |||
|---|---|---|---|
| Quadrant | BADHDUFLAG | Total packets | Discarded packets |
| A | 0 | 84 | 44 |
| B | 0 | 84 | 46 |
| C | 0 | 84 | 44 |
| D | 0 | 81 | 42 |
| Mode M0 | |||
|---|---|---|---|
| Quadrant | BADHDUFLAG | Total packets | Discarded packets |
| A | 0 | 27726 | 26763 |
| B | 0 | 9228 | 5587 |
| C | 0 | 8696 | 5179 |
| D | 0 | 9651 | 5277 |
| Mode M9 | |||
|---|---|---|---|
| Quadrant | BADHDUFLAG | Total packets | Discarded packets |
| A | 0 | 23 | 10 |
| B | 0 | 26 | 13 |
| C | 0 | 26 | 13 |
| D | 0 | 23 | 10 |
| Quadrant | Total seconds | Saturated seconds | Saturation percentage |
|---|---|---|---|
| A | 371 | 38 | 10.242588% |
| B | 1645 | 30 | 1.823708% |
| C | 1677 | 28 | 1.669648% |
| D | 1894 | 36 | 1.900739% |
Noise dominated data is calculated using 1-second bins in cleaned event files. If a bin has >2000 counts, and if more than 50% of those come from <1% of pixels, then it is considered to be noise-dominated and hence unusable.
| Quadrant | # 1 sec bins | Bins with >0 counts | Bins with >2000 counts | High rate bins dominated by noise | Noise dominated (total time) | Noise dominated (detector-on time) | Marked lightcurve |
|---|---|---|---|---|---|---|---|
| A | 3249 | 433 | 2 | 2 | 0.06% | 0.46% |  |
| B | 3329 | 1910 | 0 | 0 | 0.00% | 0.00% | 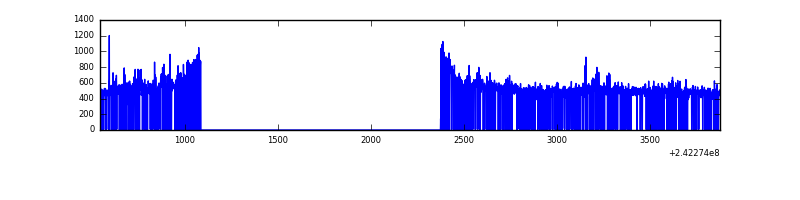 |
| C | 3328 | 1912 | 0 | 0 | 0.00% | 0.00% | 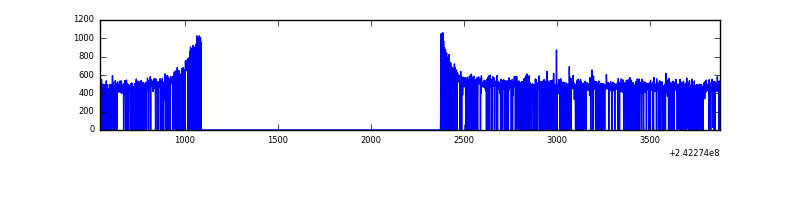 |
| D | 3329 | 1980 | 5 | 5 | 0.15% | 0.25% | 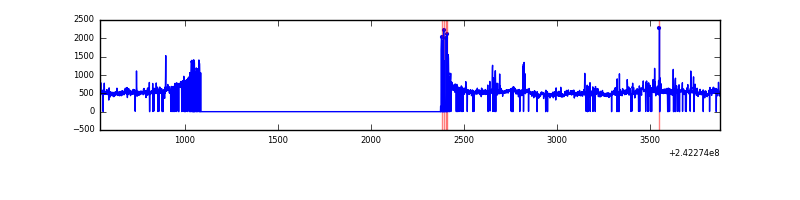 |
Top three noisy pixels from each quadrant. If the there are fewer than three noisy pixels in the level2.evt file, extra rows are filled as -1
| Pixel properties | Quadrant properties | ||||||
|---|---|---|---|---|---|---|---|
| Quadrant | DetID | PixID | Counts | Sigma | Mean | Median | Sigma |
| A | 15 | 239 | 58029 | 4739.4 | 48 | 47 | 12.2 |
| A | 3 | 80 | 4607 | 372.73 | 48 | 47 | 12.2 |
| A | 13 | 251 | 1884 | 150.15 | 48 | 47 | 12.2 |
| B | 11 | 51 | 14158 | 315.0 | 222 | 217 | 44.3 |
| B | 4 | 239 | 8768 | 193.21 | 222 | 217 | 44.3 |
| B | 0 | 187 | 4966 | 107.3 | 222 | 217 | 44.3 |
| C | 13 | 61 | 1639 | 27.29 | 219 | 219 | 52.0 |
| C | 14 | 67 | 561 | 6.57 | 219 | 219 | 52.0 |
| C | 3 | 202 | 520 | 5.78 | 219 | 219 | 52.0 |
| D | 8 | 195 | 99672 | 1700.91 | 239 | 231 | 58.5 |
| D | 1 | 20 | 26752 | 453.63 | 239 | 231 | 58.5 |
| D | 1 | 52 | 19440 | 328.56 | 239 | 231 | 58.5 |
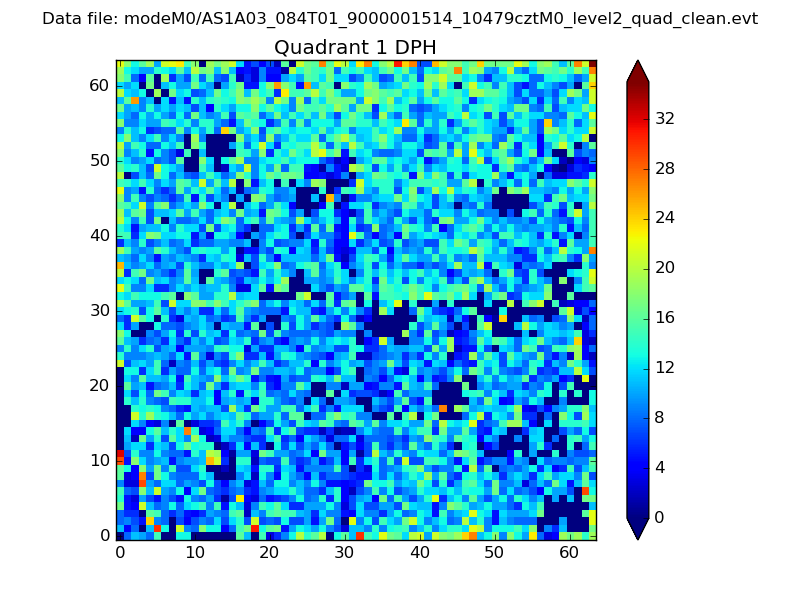
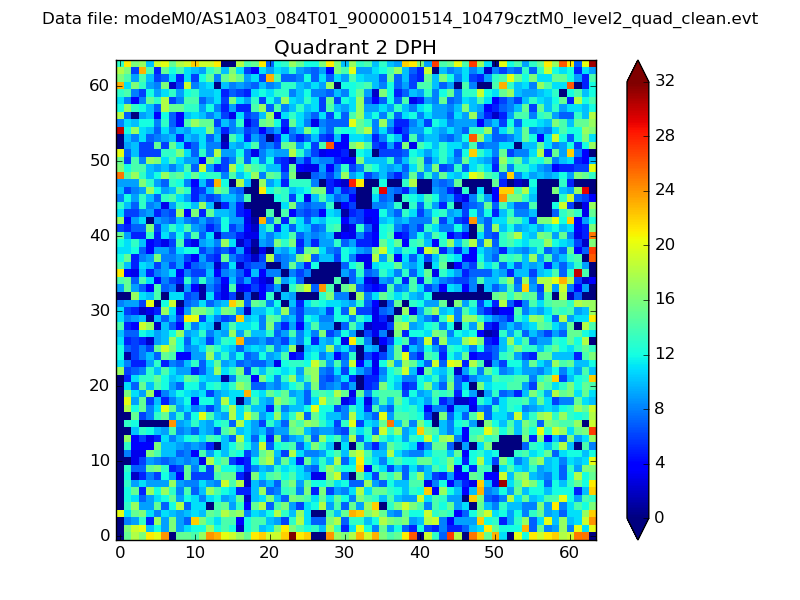
Histogram calculated using DETX and DETY for each event in the final _common_clean file
| Quadrant A | 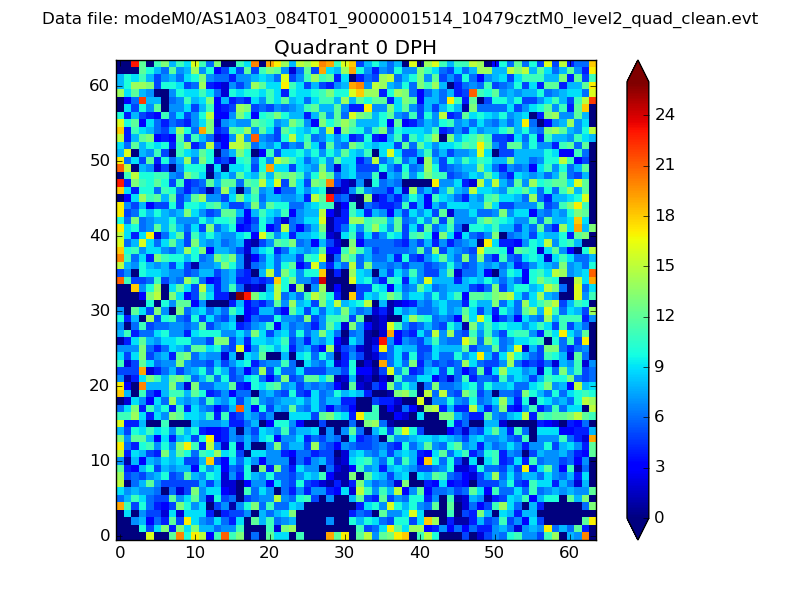 |
 |
Quadrant B |
|---|---|---|---|
| Quadrant D | 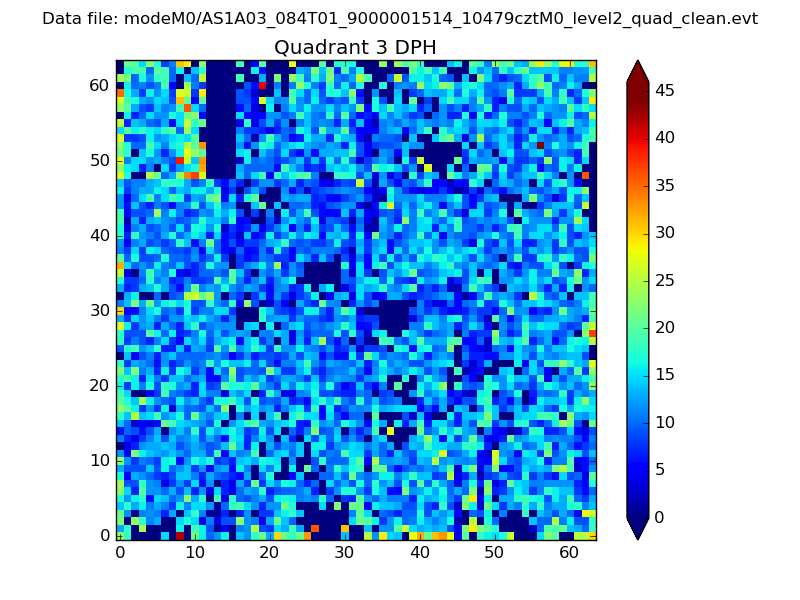 |
 |
Quadrant C |
| Plot type | Count rate plots | Images |
|---|---|---|
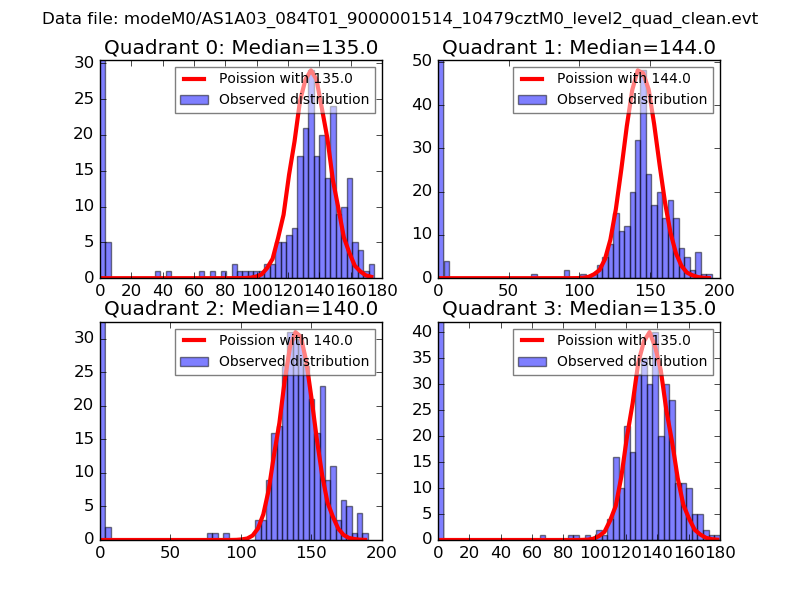
| Comparison with Poisson distribution Blue bars denote a histogram of data divided into 1 sec bins. Red curve is a Poisson curve with rate = median count rate of data. |
 |
 |
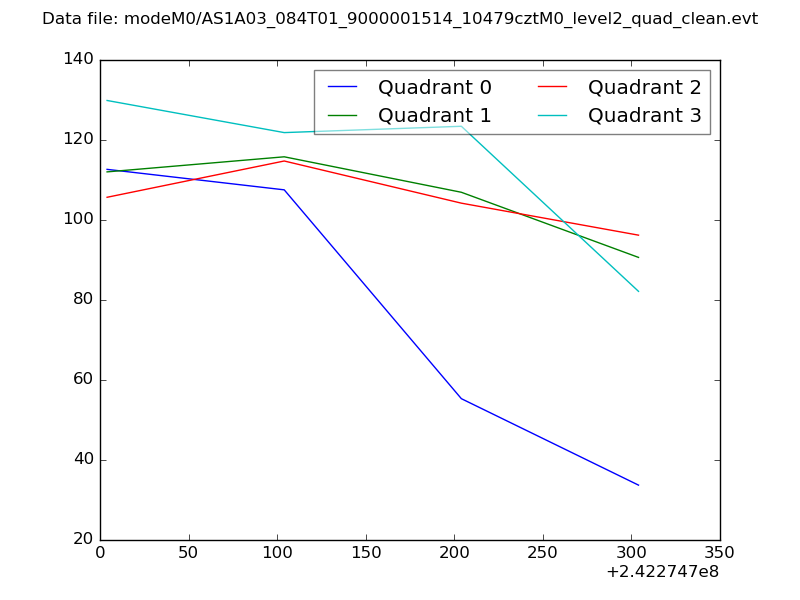
| Quadrant-wise count rates Data is divided into 100 sec bins |
 |
|
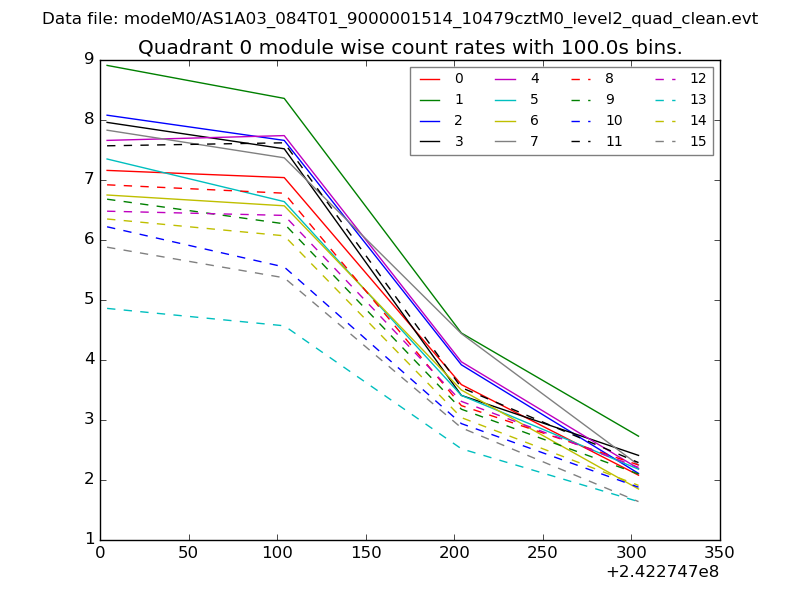
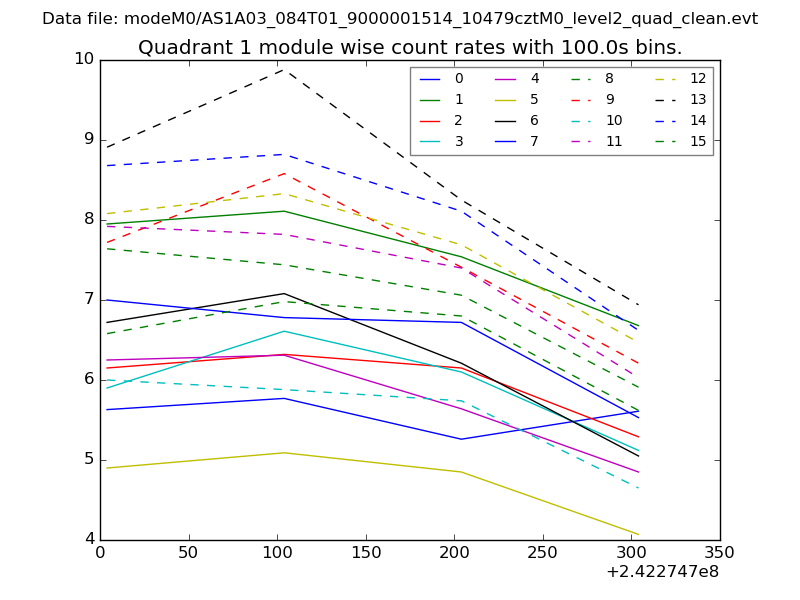
| Module-wise count rates for Quadrant A Data is divided into 100 sec bins |
 |
 |
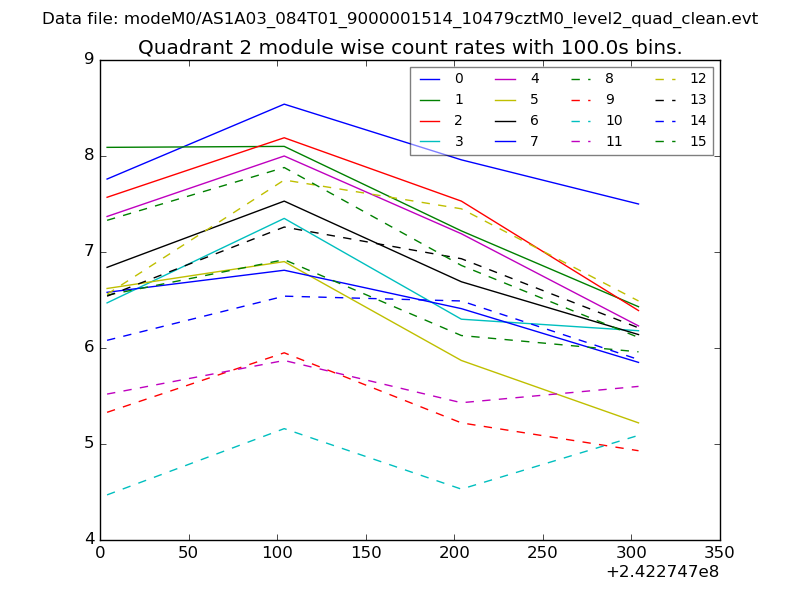
| Module-wise count rates for Quadrant B Data is divided into 100 sec bins |
 |
 |
| Module-wise count rates for Quadrant C Data is divided into 100 sec bins |
 |
 |
| Module-wise count rates for Quadrant D Data is divided into 100 sec bins |
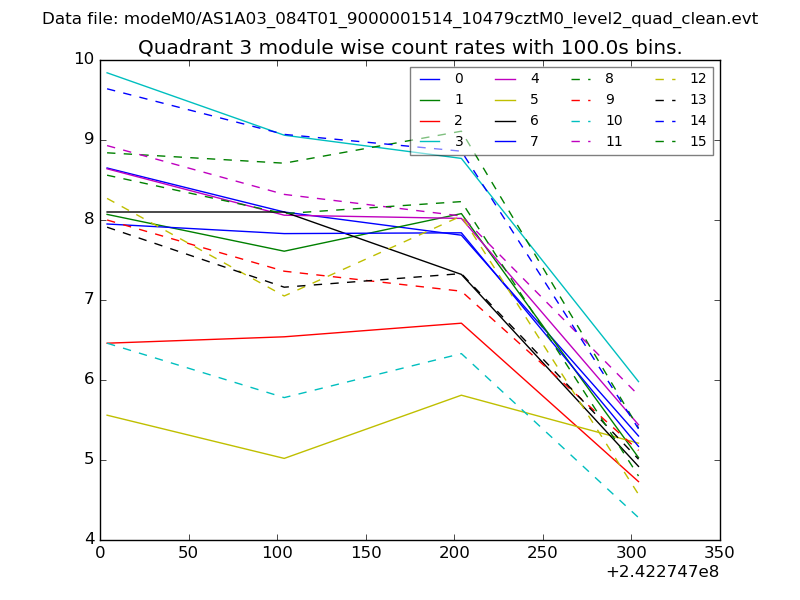 |
 |
| Parameter | Plot |
|---|---|
| CZT HV Monitor | 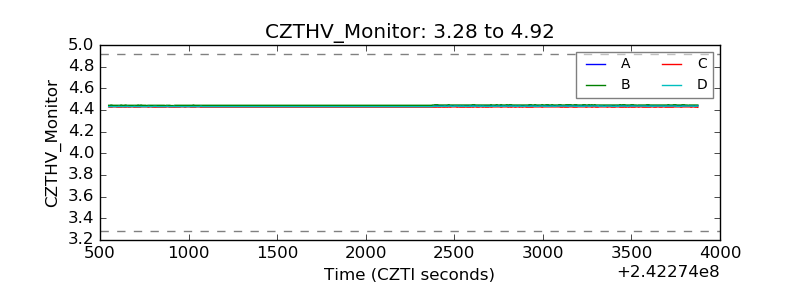 |
| D_VDD | 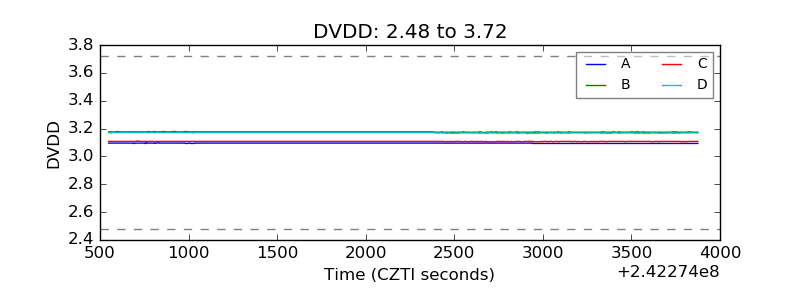 |
| Temperature 1 | 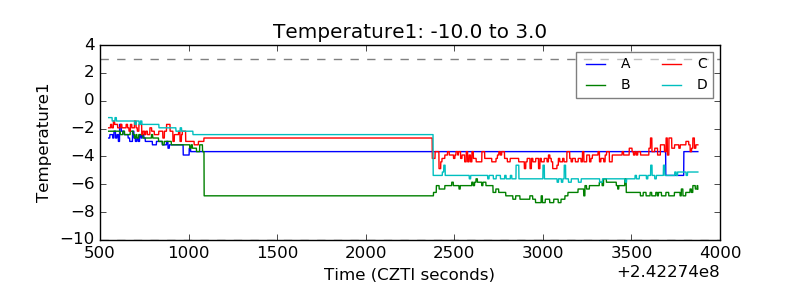 |
| Veto HV Monitor |  |
| Veto LLD | 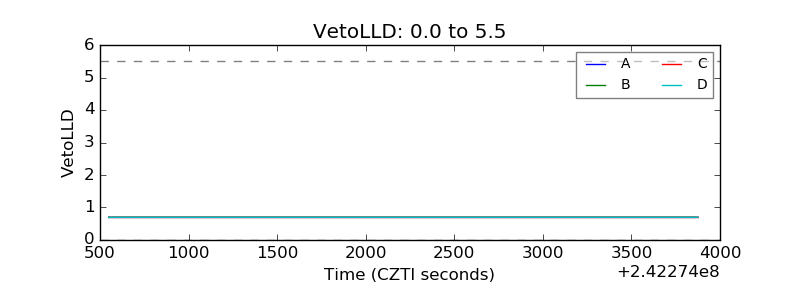 |
| Alpha Counter | 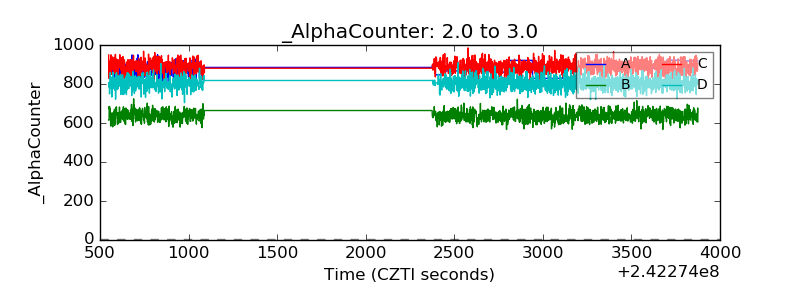 |
| _CPM_Rate | 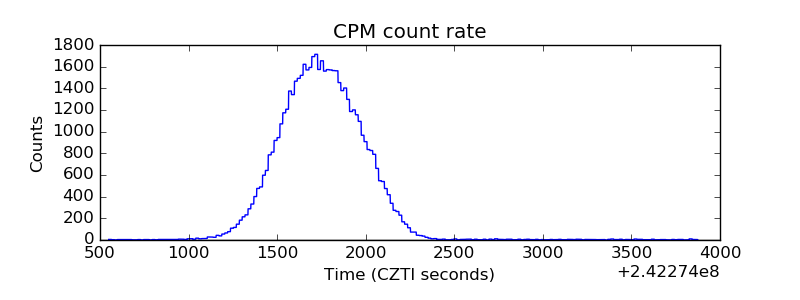 |
| CZT Counter | 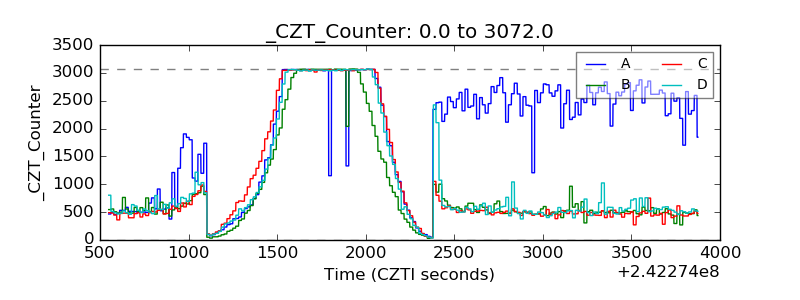 |
| +2.5 Volts monitor |  |
| +5 Volts monitor |  |
| _ROLL_ROT | 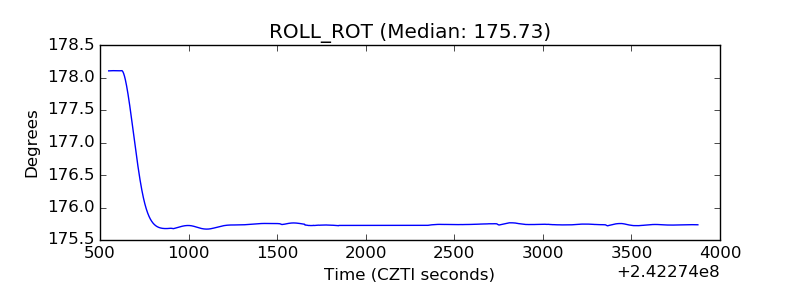 |
| _Roll_DEC |  |
| _Roll_RA | 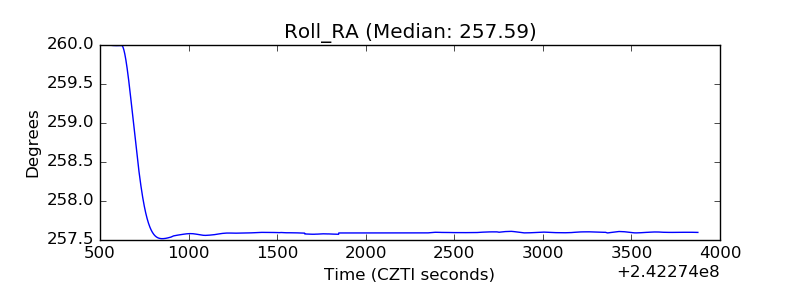 |
| Veto Counter | 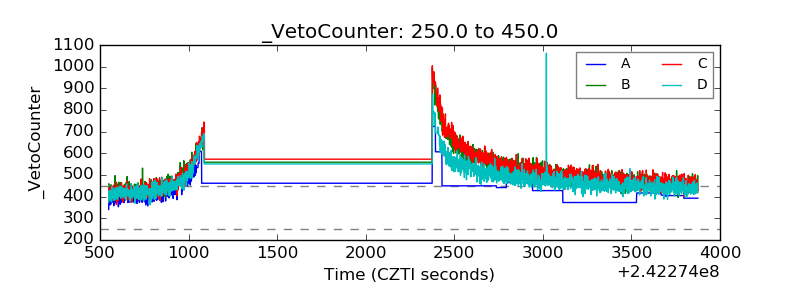 |