| Param | Original file | Final file |
|---|---|---|
| Filename | modeM0/AS1A03_084T01_9000001514_10480cztM0_level2.evt | modeM0/AS1A03_084T01_9000001514_10480cztM0_level2_quad_clean.evt |
| Size (bytes) | 637,323,840 | 60,048,000 |
| Size | 607.8 MB | 57.3 MB |
| Events in quadrant A | 8,946,950 | 264,428 |
| Events in quadrant B | 3,383,597 | 388,745 |
| Events in quadrant C | 2,997,829 | 375,769 |
| Events in quadrant D | 3,552,423 | 355,739 |
| Mode SS | |||
|---|---|---|---|
| Quadrant | BADHDUFLAG | Total packets | Discarded packets |
| A | 0 | 126 | 0 |
| B | 0 | 126 | 0 |
| C | 0 | 126 | 0 |
| D | 0 | 126 | 0 |
| Mode M0 | |||
|---|---|---|---|
| Quadrant | BADHDUFLAG | Total packets | Discarded packets |
| A | 0 | 30469 | 2 |
| B | 0 | 13708 | 1 |
| C | 0 | 12807 | 1 |
| D | 0 | 14410 | 1 |
| Mode M9 | |||
|---|---|---|---|
| Quadrant | BADHDUFLAG | Total packets | Discarded packets |
| A | 0 | 12 | 0 |
| B | 0 | 12 | 0 |
| C | 0 | 12 | 0 |
| D | 0 | 12 | 0 |
| Quadrant | Total seconds | Saturated seconds | Saturation percentage |
|---|---|---|---|
| A | 6200 | 2866 | 46.225806% |
| B | 6200 | 121 | 1.951613% |
| C | 6200 | 94 | 1.516129% |
| D | 6200 | 99 | 1.596774% |
Noise dominated data is calculated using 1-second bins in cleaned event files. If a bin has >2000 counts, and if more than 50% of those come from <1% of pixels, then it is considered to be noise-dominated and hence unusable.
| Quadrant | # 1 sec bins | Bins with >0 counts | Bins with >2000 counts | High rate bins dominated by noise | Noise dominated (total time) | Noise dominated (detector-on time) | Marked lightcurve |
|---|---|---|---|---|---|---|---|
| A | 7395 | 6199 | 2749 | 2749 | 37.17% | 44.35% | 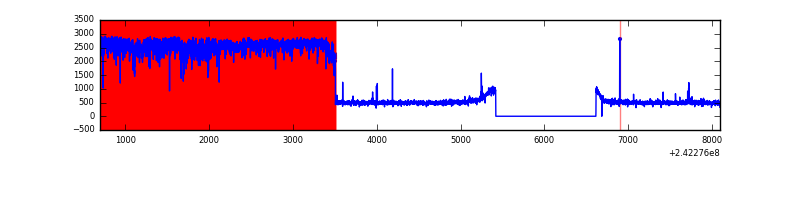 |
| B | 7395 | 6200 | 12 | 12 | 0.16% | 0.19% |  |
| C | 7396 | 6200 | 0 | 0 | 0.00% | 0.00% | 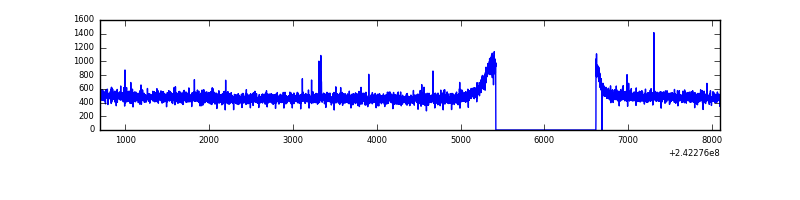 |
| D | 7396 | 6201 | 10 | 10 | 0.14% | 0.16% |  |
Top three noisy pixels from each quadrant. If the there are fewer than three noisy pixels in the level2.evt file, extra rows are filled as -1
| Pixel properties | Quadrant properties | ||||||
|---|---|---|---|---|---|---|---|
| Quadrant | DetID | PixID | Counts | Sigma | Mean | Median | Sigma |
| A | 15 | 239 | 6747104 | 59634.52 | 548 | 536 | 113.1 |
| A | 3 | 80 | 44574 | 389.26 | 548 | 536 | 113.1 |
| A | 5 | 16 | 14883 | 126.82 | 548 | 536 | 113.1 |
| B | 4 | 239 | 192786 | 1286.23 | 790 | 773 | 149.3 |
| B | 11 | 51 | 59188 | 391.3 | 790 | 773 | 149.3 |
| B | 0 | 214 | 27387 | 178.28 | 790 | 773 | 149.3 |
| C | 14 | 234 | 6807 | 33.9 | 767 | 771 | 178.1 |
| C | 13 | 61 | 5668 | 27.5 | 767 | 771 | 178.1 |
| C | 14 | 67 | 2185 | 7.94 | 767 | 771 | 178.1 |
| D | 8 | 195 | 344320 | 1901.67 | 755 | 735 | 180.7 |
| D | 1 | 20 | 160734 | 885.56 | 755 | 735 | 180.7 |
| D | 1 | 52 | 104012 | 571.62 | 755 | 735 | 180.7 |
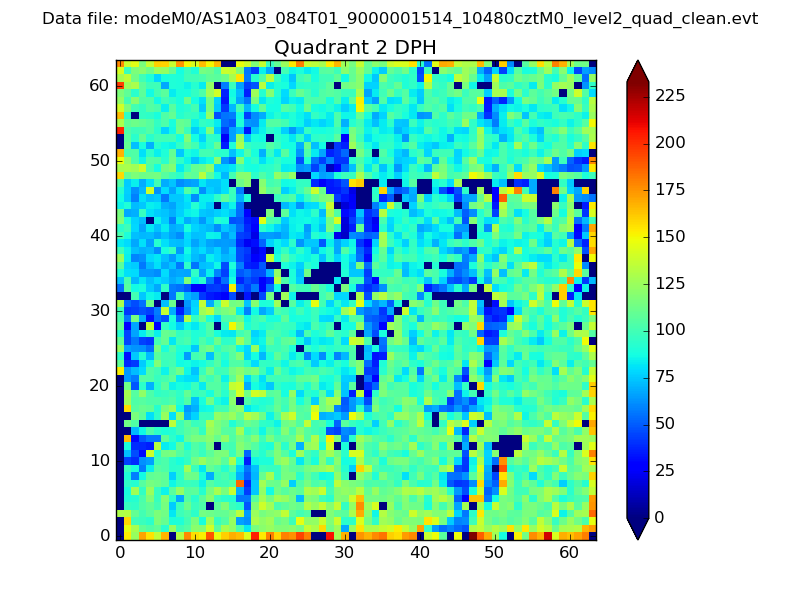
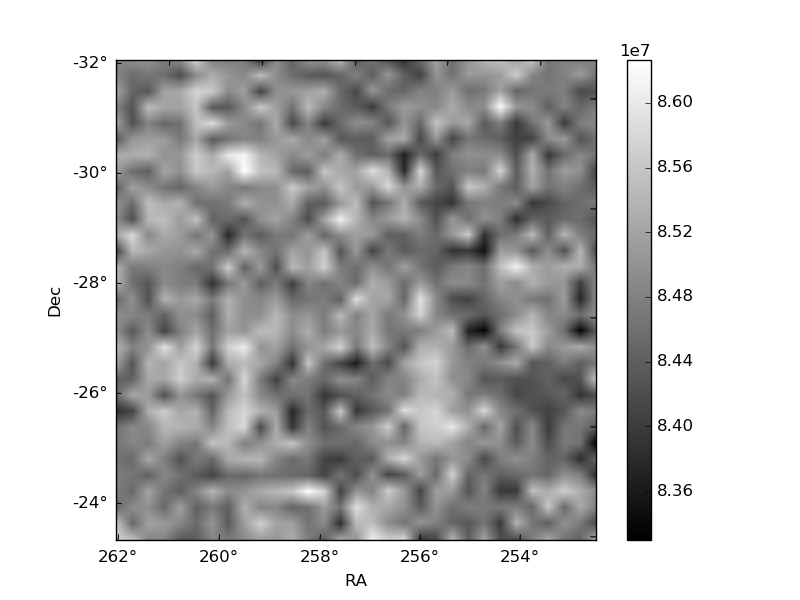
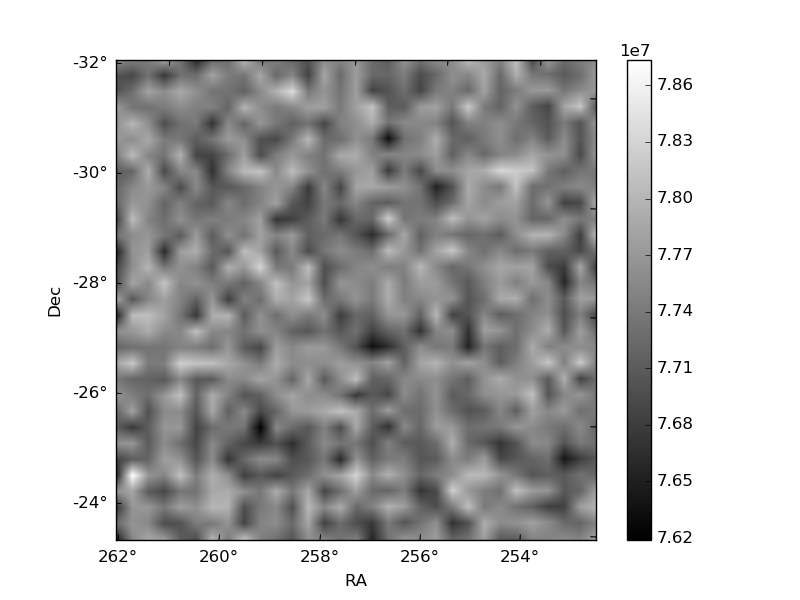
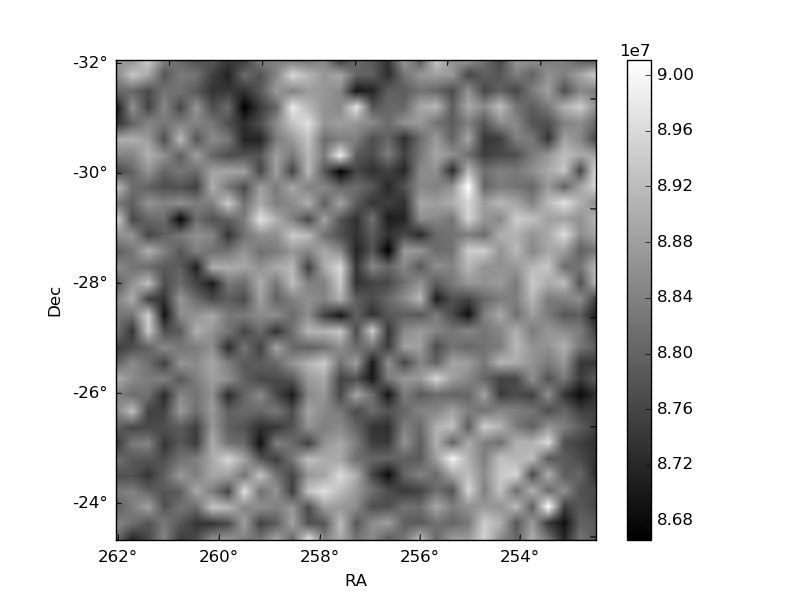
Histogram calculated using DETX and DETY for each event in the final _common_clean file
| Quadrant A | 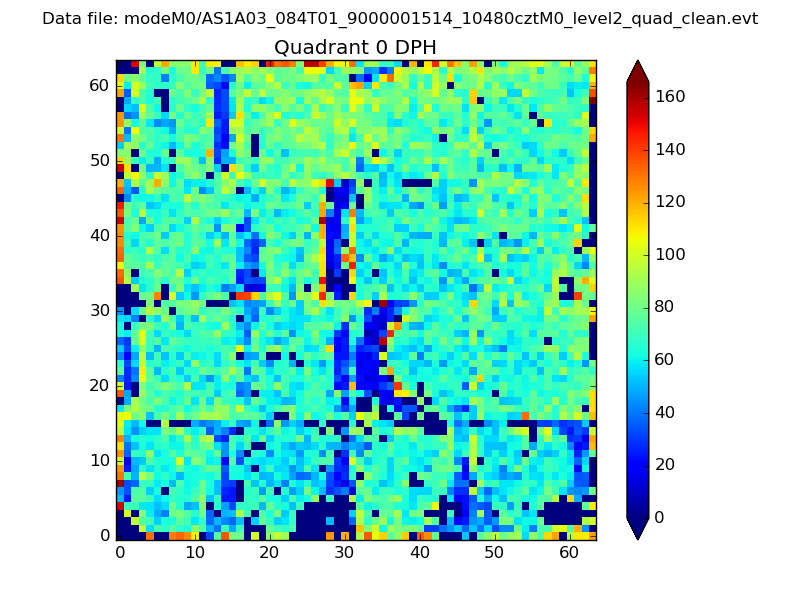 |
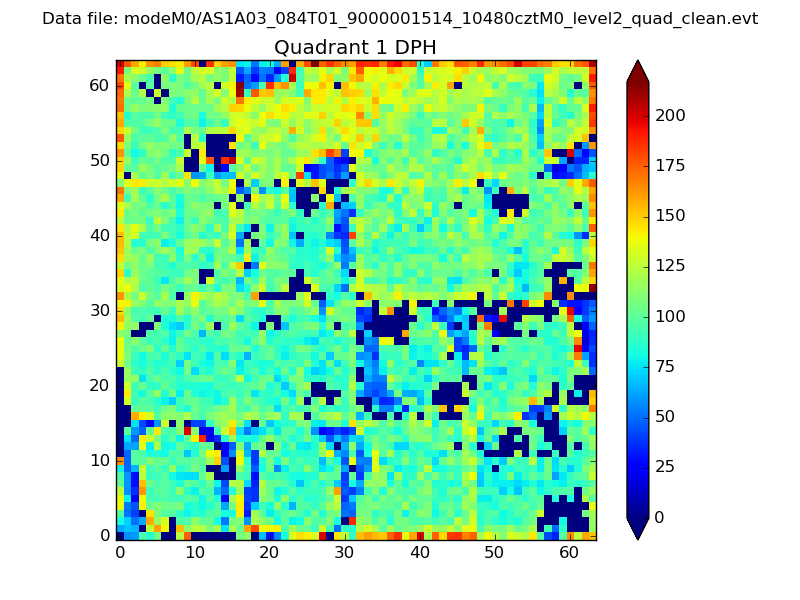 |
Quadrant B |
|---|---|---|---|
| Quadrant D | 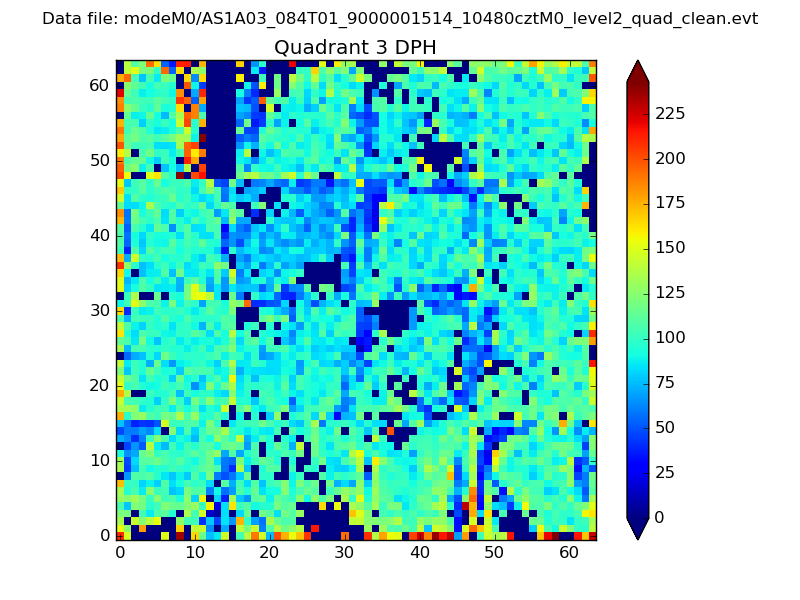 |
 |
Quadrant C |
| Plot type | Count rate plots | Images |
|---|---|---|
| Comparison with Poisson distribution Blue bars denote a histogram of data divided into 1 sec bins. Red curve is a Poisson curve with rate = median count rate of data. |
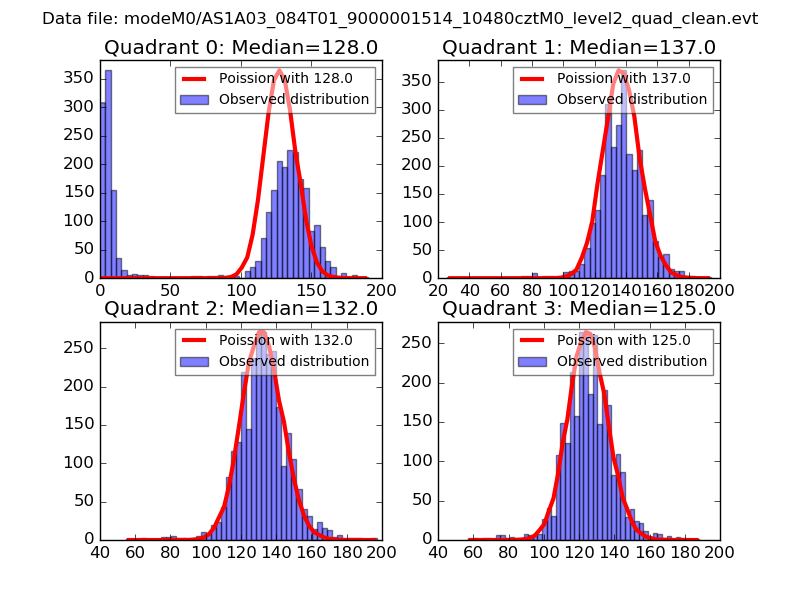 |
 |
| Quadrant-wise count rates Data is divided into 100 sec bins |
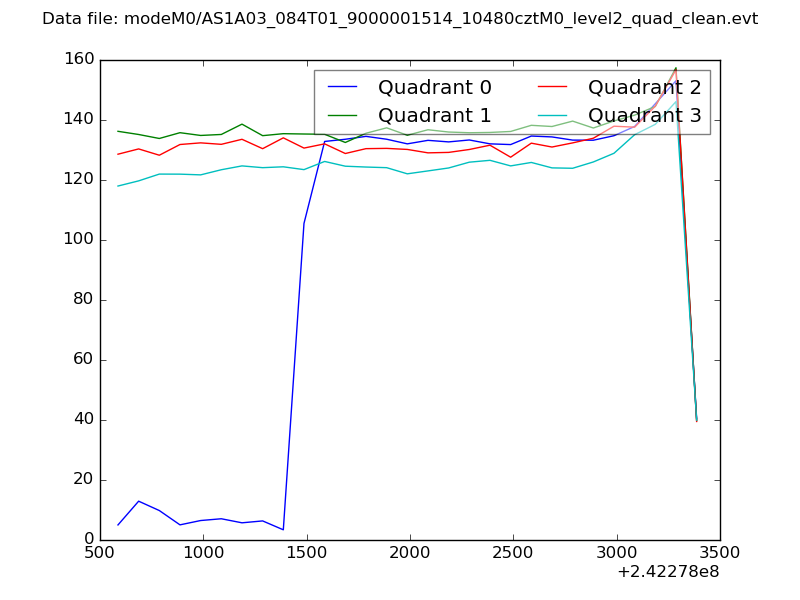 |
|
| Module-wise count rates for Quadrant A Data is divided into 100 sec bins |
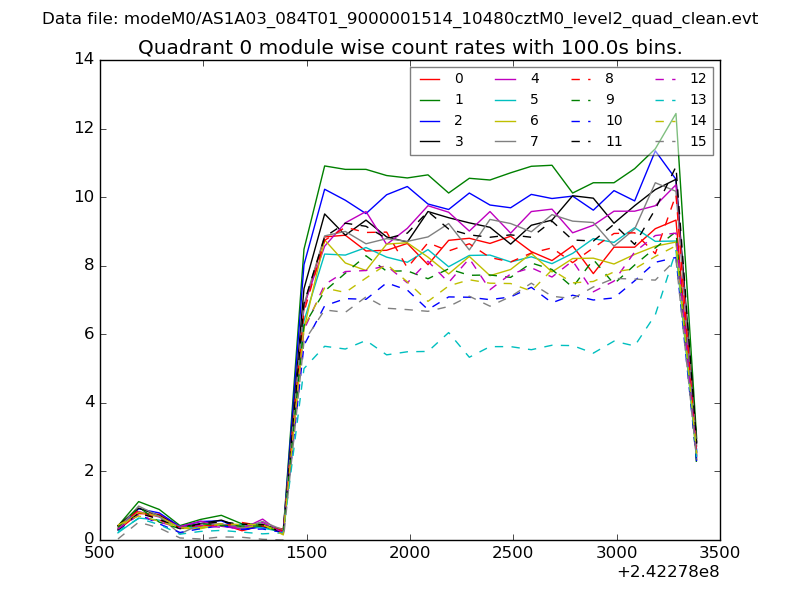 |
 |
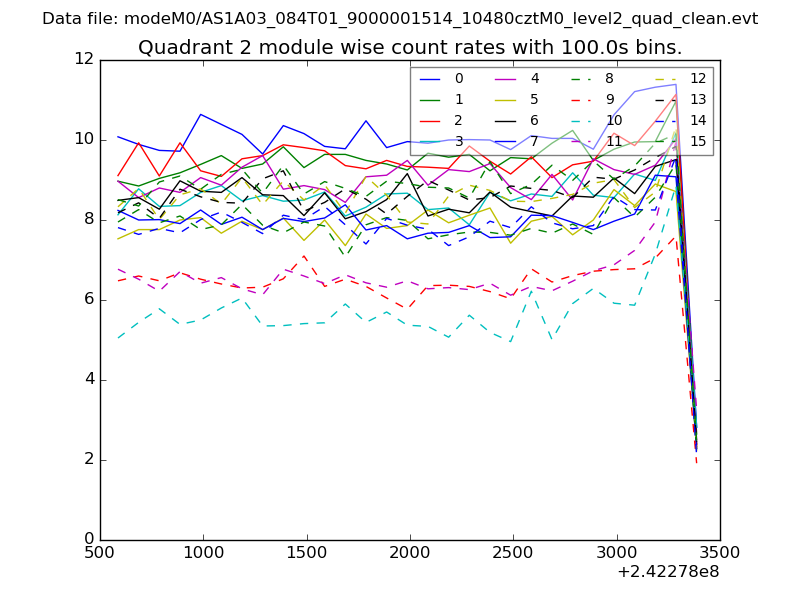
| Module-wise count rates for Quadrant B Data is divided into 100 sec bins |
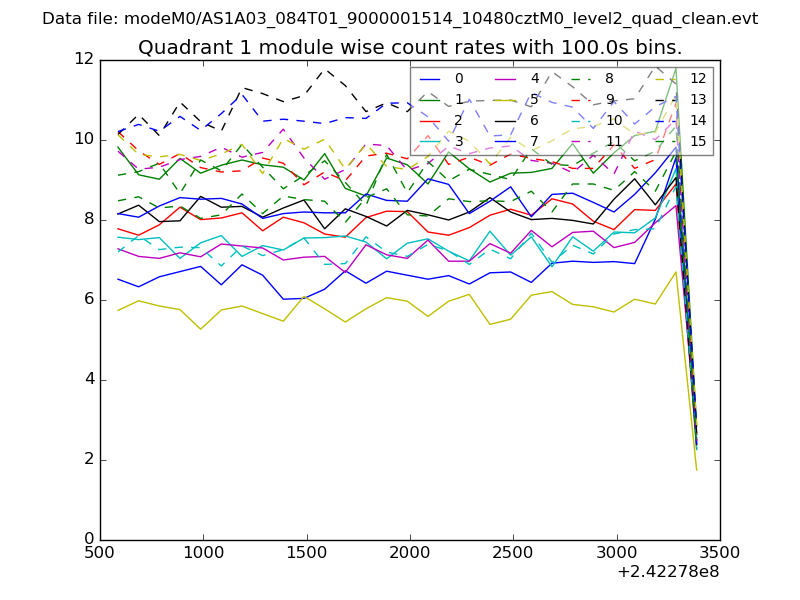 |
 |
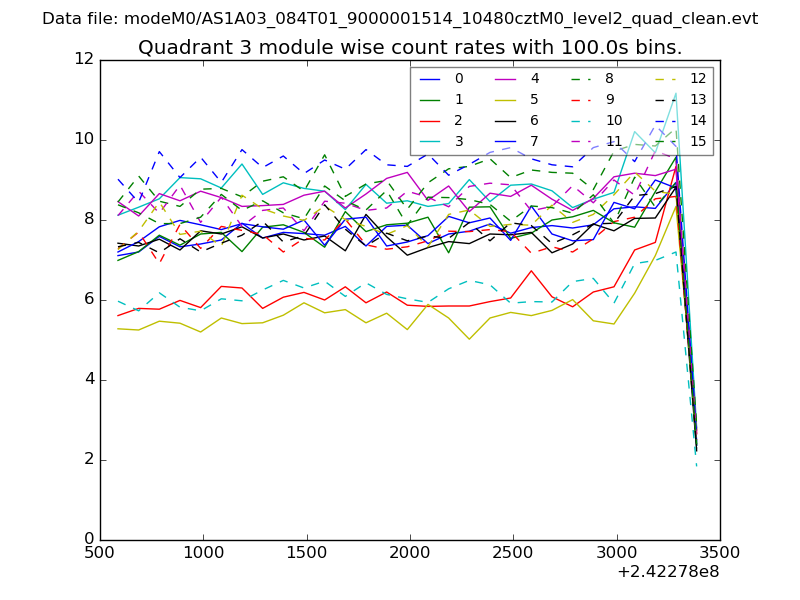
| Module-wise count rates for Quadrant C Data is divided into 100 sec bins |
 |
 |
| Module-wise count rates for Quadrant D Data is divided into 100 sec bins |
 |
 |
| Parameter | Plot |
|---|---|
| CZT HV Monitor | 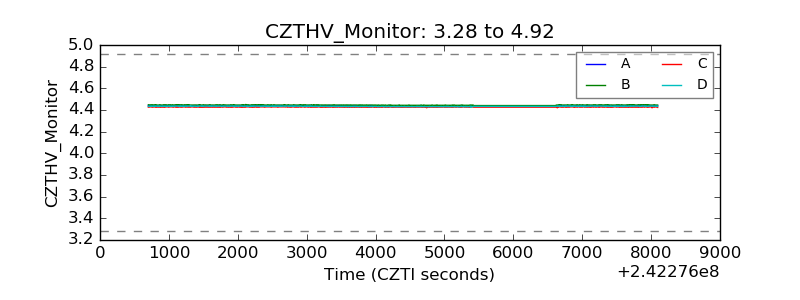 |
| D_VDD | 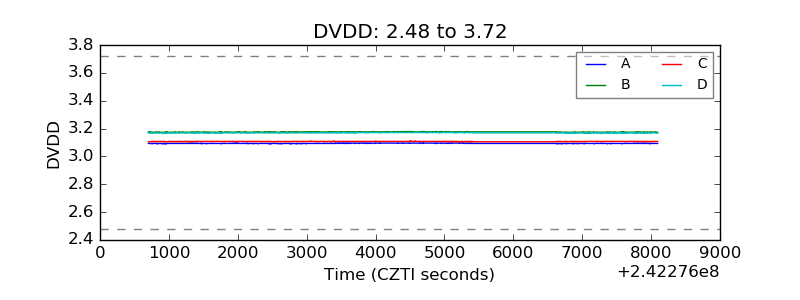 |
| Temperature 1 |  |
| Veto HV Monitor | 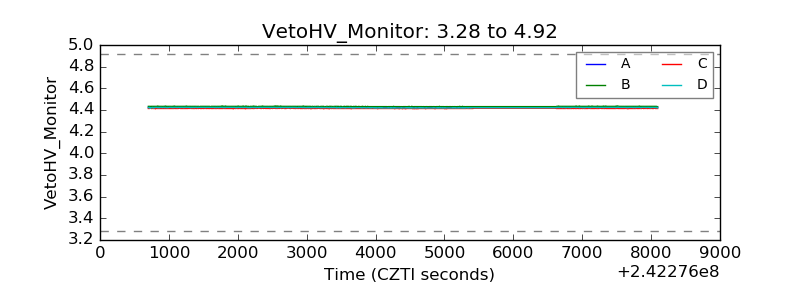 |
| Veto LLD |  |
| Alpha Counter | 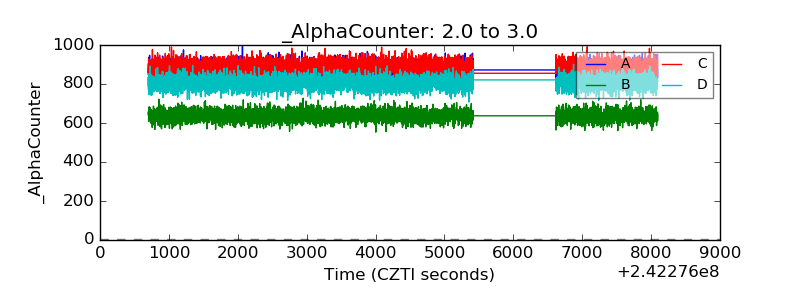 |
| _CPM_Rate | 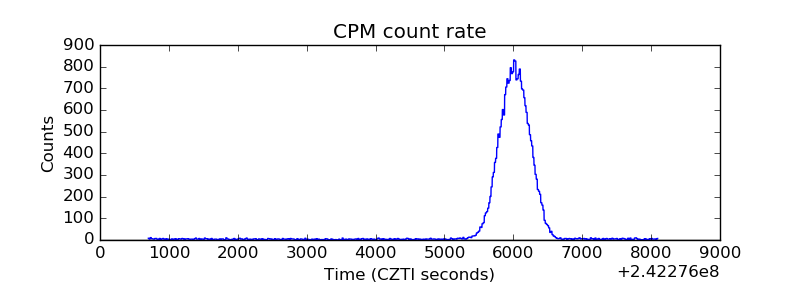 |
| CZT Counter | 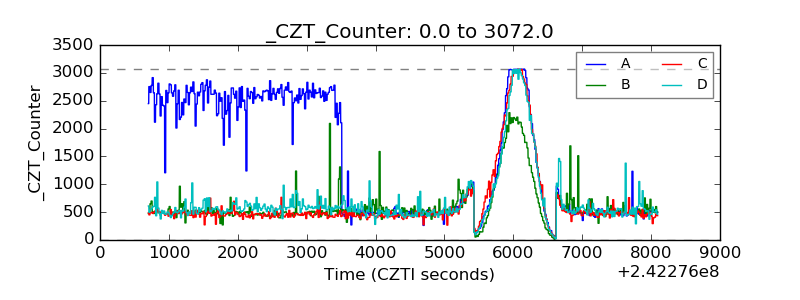 |
| +2.5 Volts monitor |  |
| +5 Volts monitor |  |
| _ROLL_ROT | 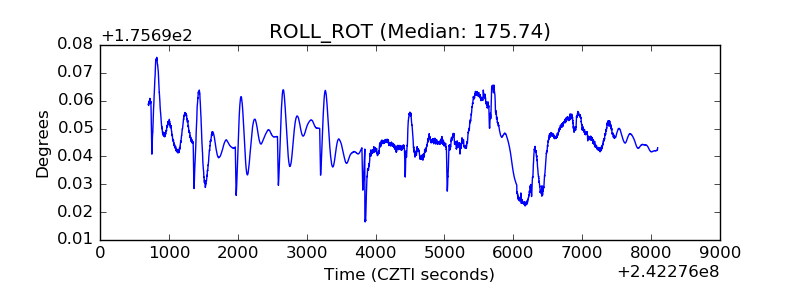 |
| _Roll_DEC | 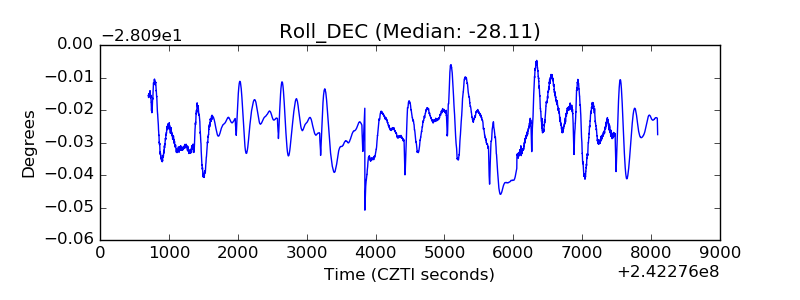 |
| _Roll_RA | 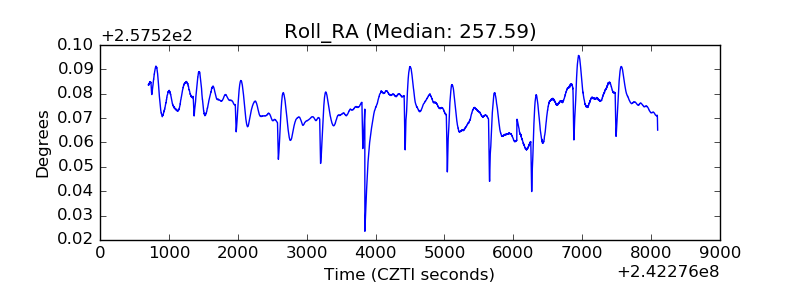 |
| Veto Counter | 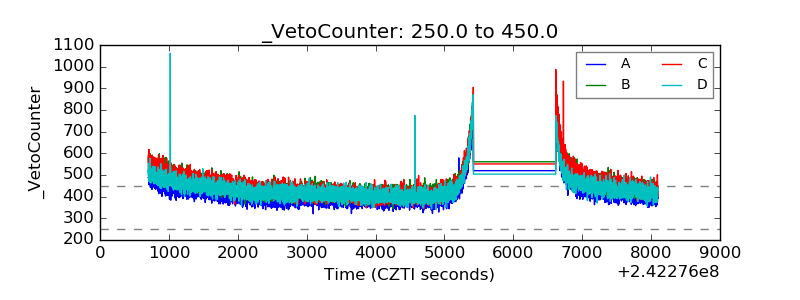 |