| Param | Original file | Final file |
|---|---|---|
| Filename | modeM0/AS1A03_084T01_9000001514_10482cztM0_level2.evt | modeM0/AS1A03_084T01_9000001514_10482cztM0_level2_quad_clean.evt |
| Size (bytes) | 1,443,879,360 | 205,997,760 |
| Size | 1.3 GB | 196.5 MB |
| Events in quadrant A | 14,987,757 | 1,187,551 |
| Events in quadrant B | 9,481,909 | 1,306,351 |
| Events in quadrant C | 8,001,803 | 1,295,624 |
| Events in quadrant D | 10,109,714 | 1,279,432 |
| Mode SS | |||
|---|---|---|---|
| Quadrant | BADHDUFLAG | Total packets | Discarded packets |
| A | 0 | 510 | 153 |
| B | 0 | 510 | 159 |
| C | 0 | 510 | 153 |
| D | 0 | 501 | 142 |
| Mode M0 | |||
|---|---|---|---|
| Quadrant | BADHDUFLAG | Total packets | Discarded packets |
| A | 0 | 70622 | 15663 |
| B | 0 | 57781 | 19450 |
| C | 0 | 51687 | 16828 |
| D | 0 | 56591 | 15588 |
| Mode M9 | |||
|---|---|---|---|
| Quadrant | BADHDUFLAG | Total packets | Discarded packets |
| A | 0 | 45 | 4 |
| B | 0 | 47 | 6 |
| C | 0 | 47 | 6 |
| D | 0 | 46 | 5 |
| Quadrant | Total seconds | Saturated seconds | Saturation percentage |
|---|---|---|---|
| A | 16800 | 3476 | 20.690476% |
| B | 16558 | 571 | 3.448484% |
| C | 16797 | 279 | 1.661011% |
| D | 17674 | 341 | 1.929388% |
Noise dominated data is calculated using 1-second bins in cleaned event files. If a bin has >2000 counts, and if more than 50% of those come from <1% of pixels, then it is considered to be noise-dominated and hence unusable.
| Quadrant | # 1 sec bins | Bins with >0 counts | Bins with >2000 counts | High rate bins dominated by noise | Noise dominated (total time) | Noise dominated (detector-on time) | Marked lightcurve |
|---|---|---|---|---|---|---|---|
| A | 22070 | 17154 | 3093 | 3093 | 14.01% | 18.03% | 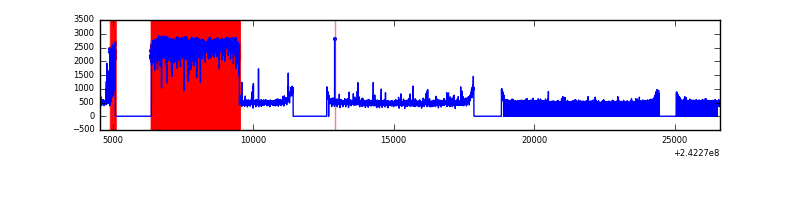 |
| B | 22070 | 16951 | 192 | 192 | 0.87% | 1.13% | 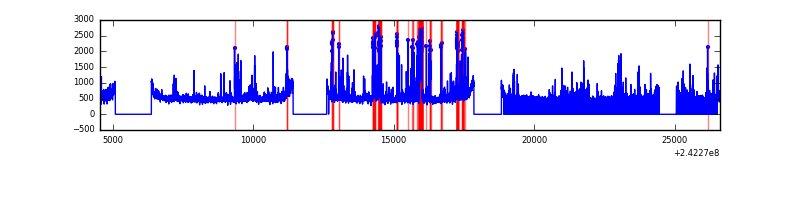 |
| C | 22070 | 17145 | 2 | 2 | 0.01% | 0.01% | 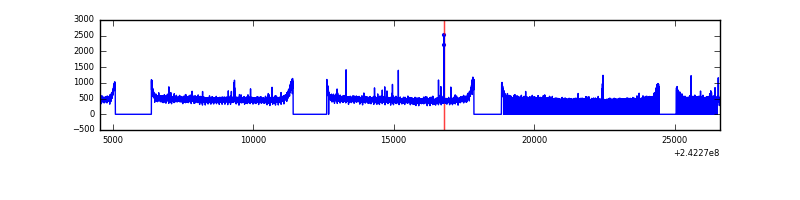 |
| D | 22070 | 17803 | 32 | 32 | 0.14% | 0.18% | 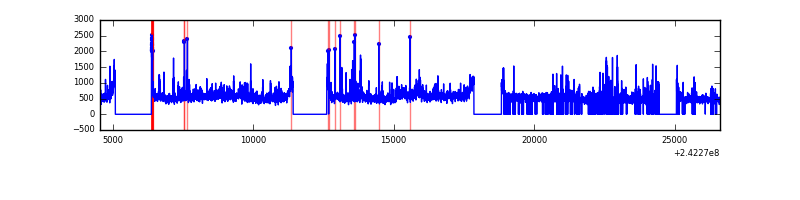 |
Top three noisy pixels from each quadrant. If the there are fewer than three noisy pixels in the level2.evt file, extra rows are filled as -1
| Pixel properties | Quadrant properties | ||||||
|---|---|---|---|---|---|---|---|
| Quadrant | DetID | PixID | Counts | Sigma | Mean | Median | Sigma |
| A | 15 | 239 | 7670989 | 20593.88 | 1829 | 1790 | 372.4 |
| A | 3 | 80 | 156720 | 416.03 | 1829 | 1790 | 372.4 |
| A | 13 | 251 | 51281 | 132.9 | 1829 | 1790 | 372.4 |
| B | 4 | 239 | 988952 | 2519.78 | 2073 | 2028 | 391.7 |
| B | 11 | 51 | 220798 | 558.56 | 2073 | 2028 | 391.7 |
| B | 0 | 214 | 78062 | 194.13 | 2073 | 2028 | 391.7 |
| C | 14 | 234 | 40087 | 80.23 | 2042 | 2055 | 474.0 |
| C | 13 | 61 | 15176 | 27.68 | 2042 | 2055 | 474.0 |
| C | 14 | 67 | 5432 | 7.12 | 2042 | 2055 | 474.0 |
| D | 8 | 195 | 1145962 | 2260.34 | 2121 | 2065 | 506.1 |
| D | 1 | 20 | 384023 | 754.75 | 2121 | 2065 | 506.1 |
| D | 1 | 52 | 293186 | 575.25 | 2121 | 2065 | 506.1 |
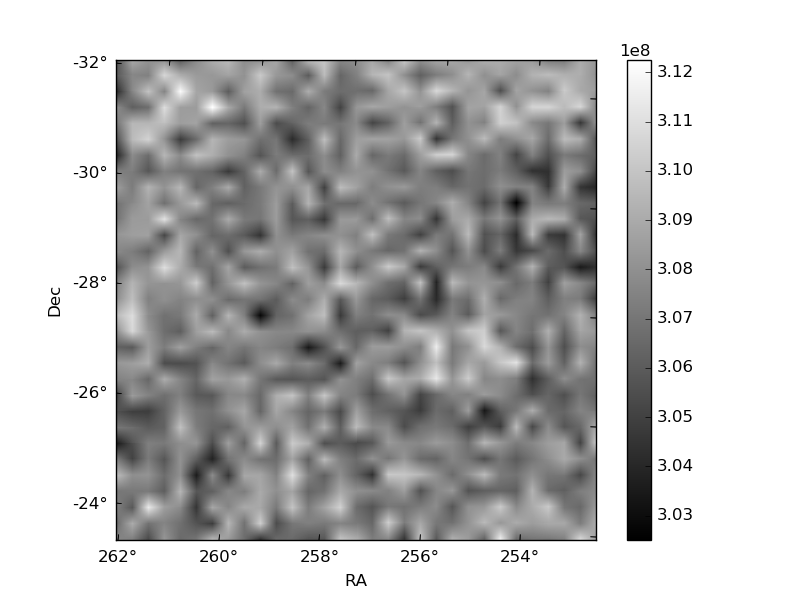
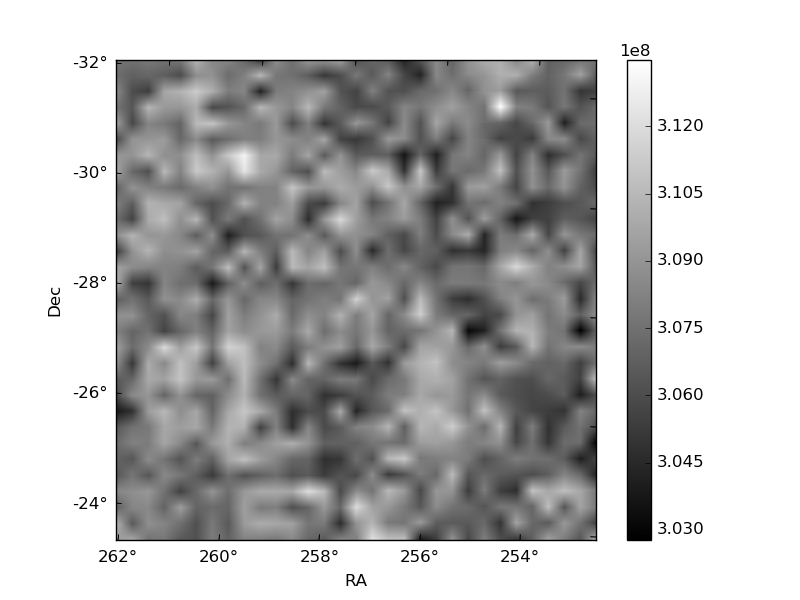
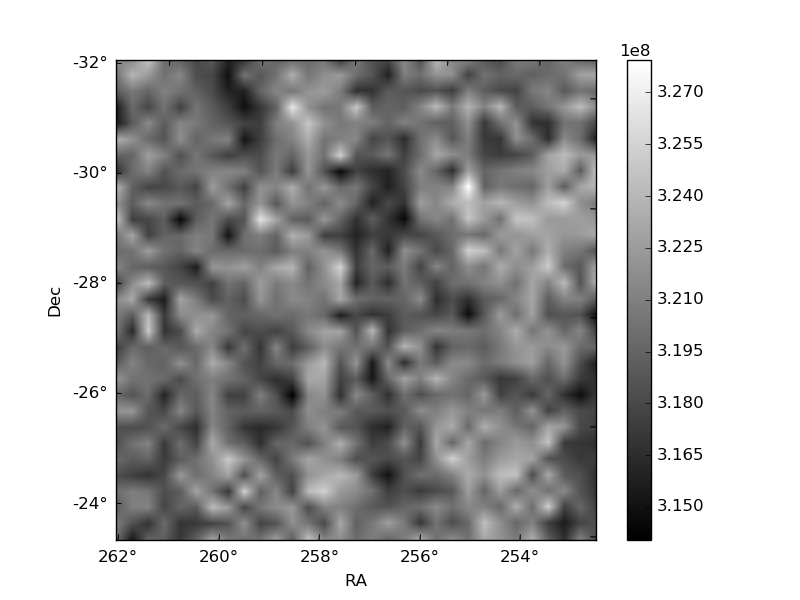
Histogram calculated using DETX and DETY for each event in the final _common_clean file
| Quadrant A | 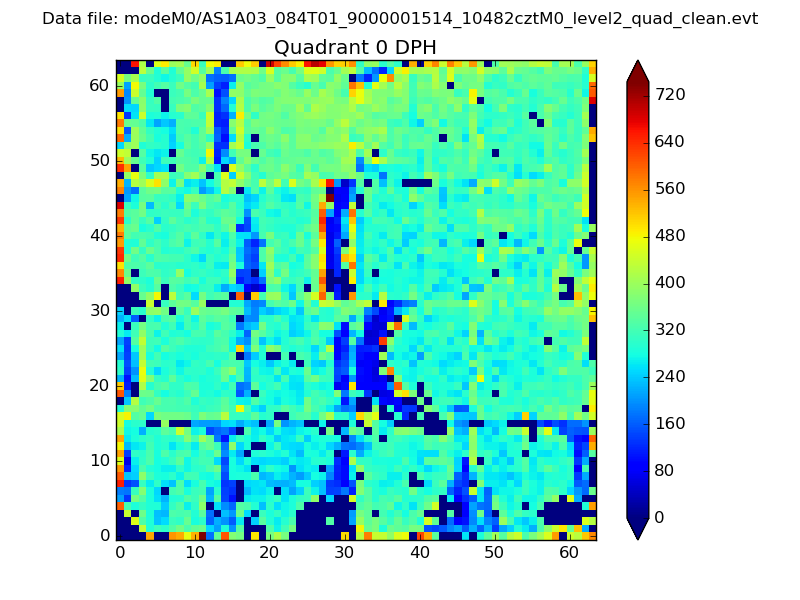 |
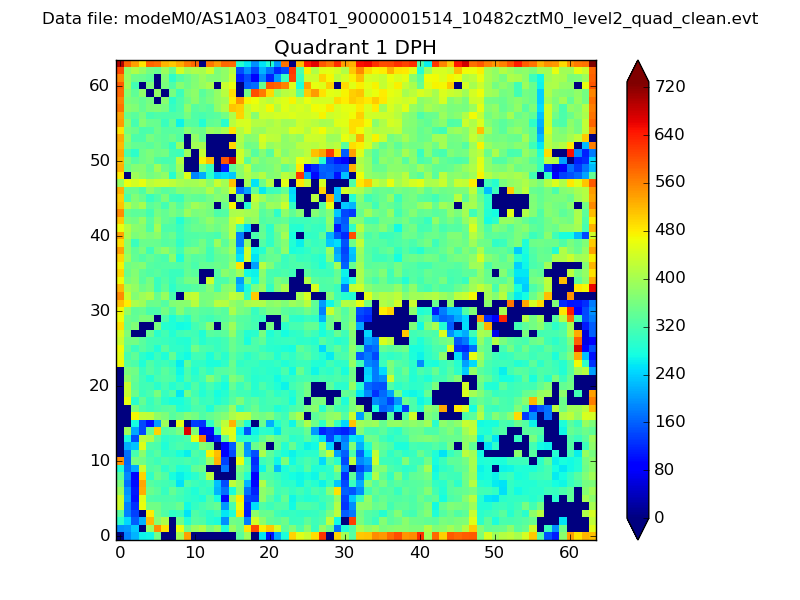 |
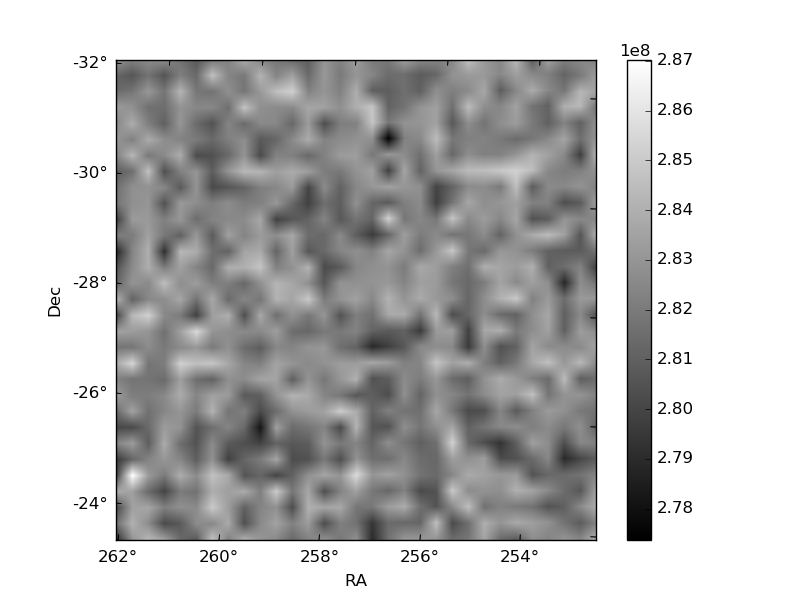
Quadrant B |
|---|---|---|---|
| Quadrant D | 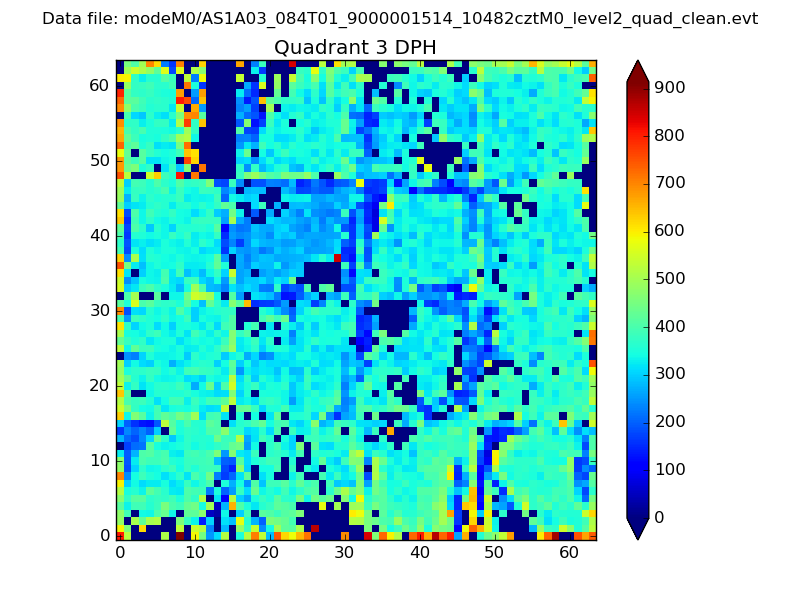 |
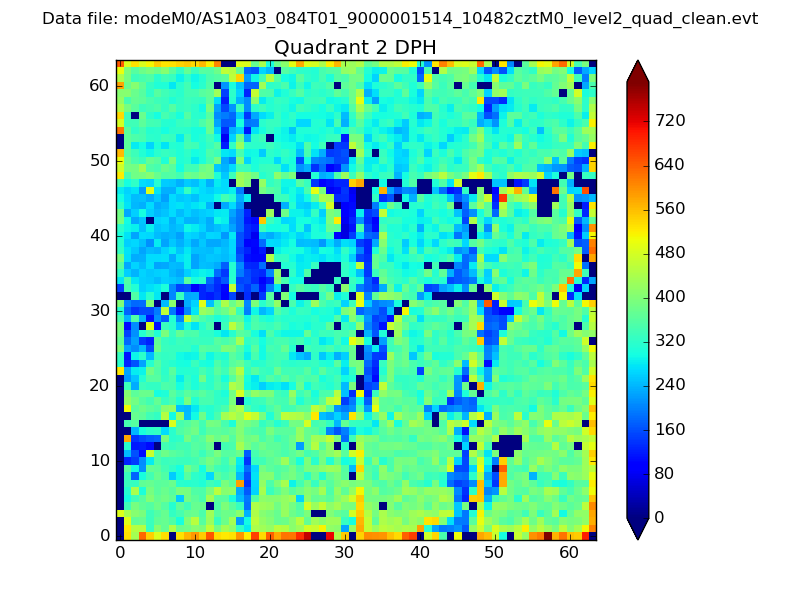 |
Quadrant C |
| Plot type | Count rate plots | Images |
|---|---|---|
| Comparison with Poisson distribution Blue bars denote a histogram of data divided into 1 sec bins. Red curve is a Poisson curve with rate = median count rate of data. |
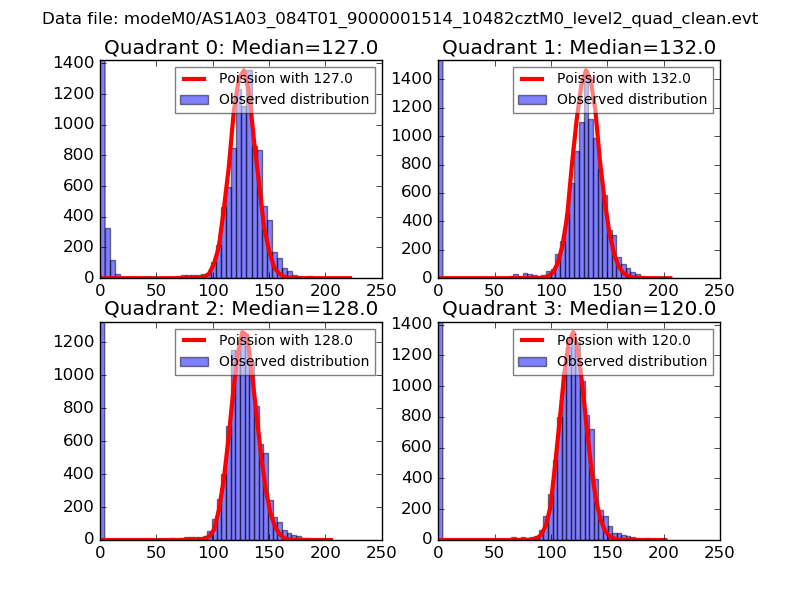 |
 |
| Quadrant-wise count rates Data is divided into 100 sec bins |
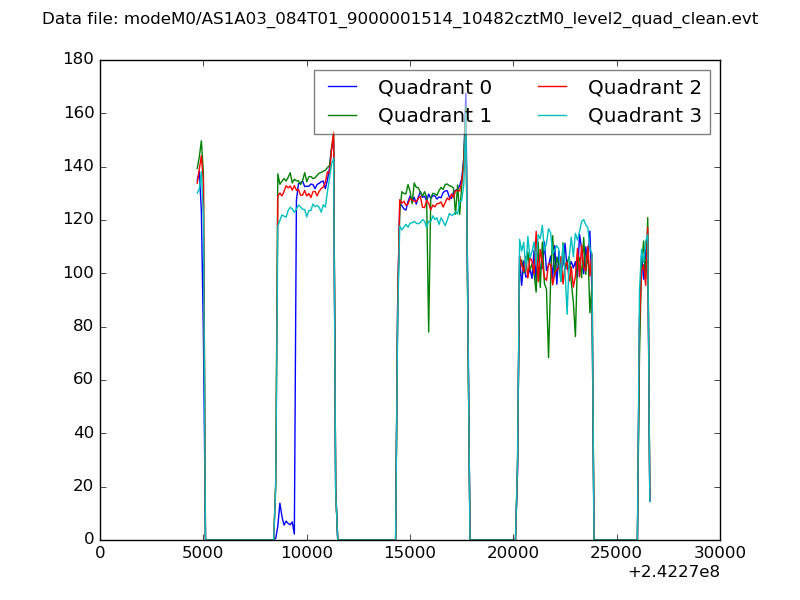 |
|
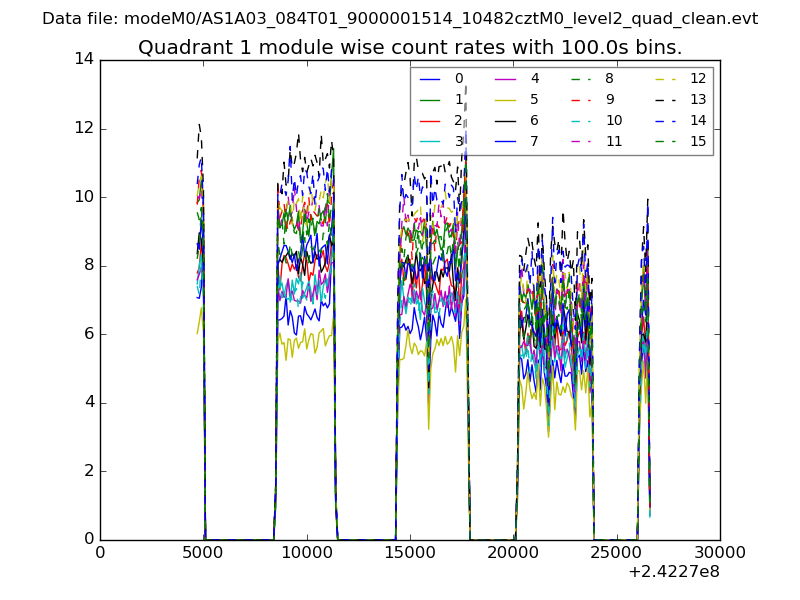
| Module-wise count rates for Quadrant A Data is divided into 100 sec bins |
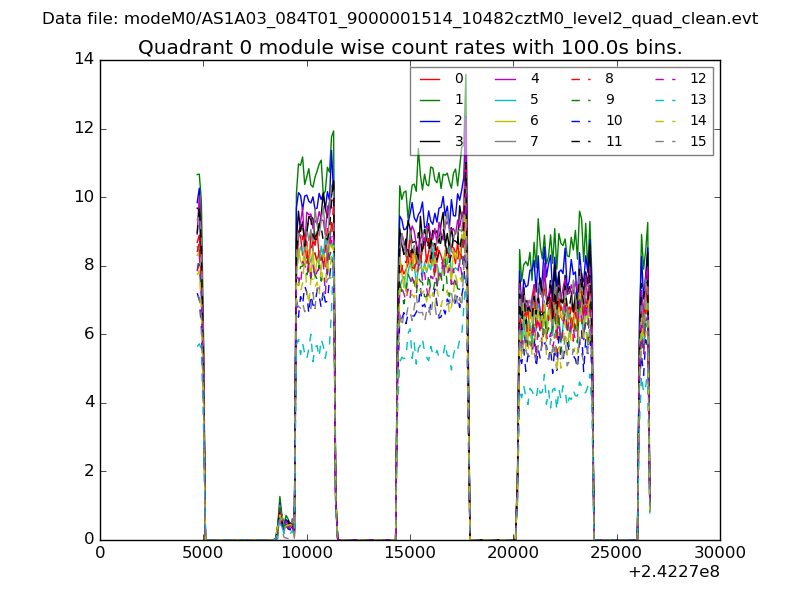 |
 |
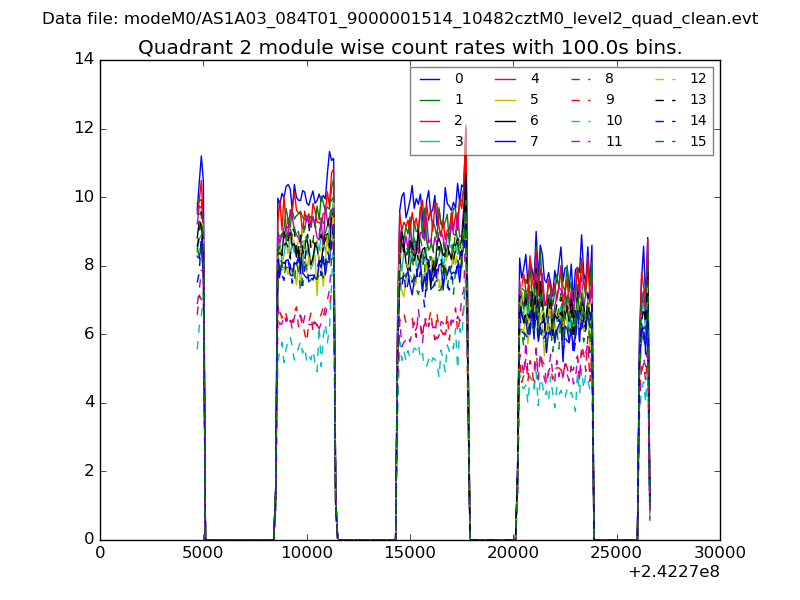
| Module-wise count rates for Quadrant B Data is divided into 100 sec bins |
 |
 |
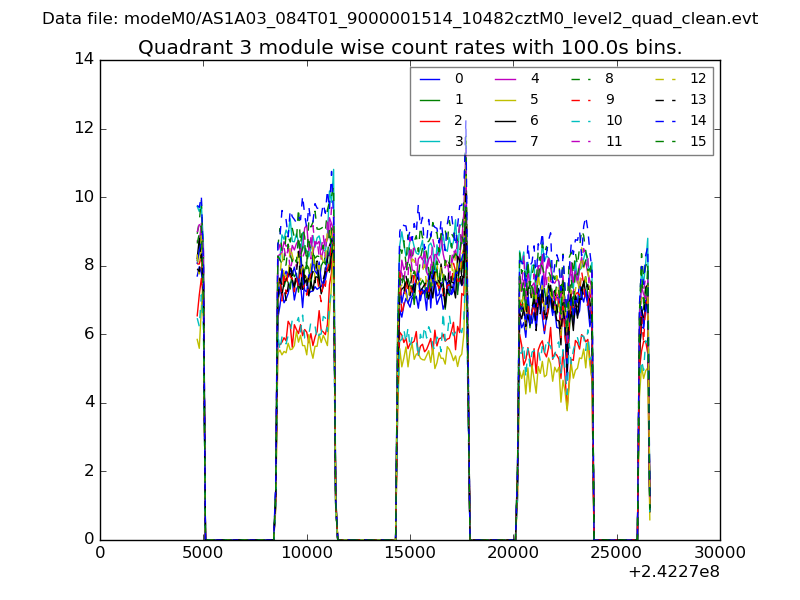
| Module-wise count rates for Quadrant C Data is divided into 100 sec bins |
 |
 |
| Module-wise count rates for Quadrant D Data is divided into 100 sec bins |
 |
 |
| Parameter | Plot |
|---|---|
| CZT HV Monitor |  |
| D_VDD | 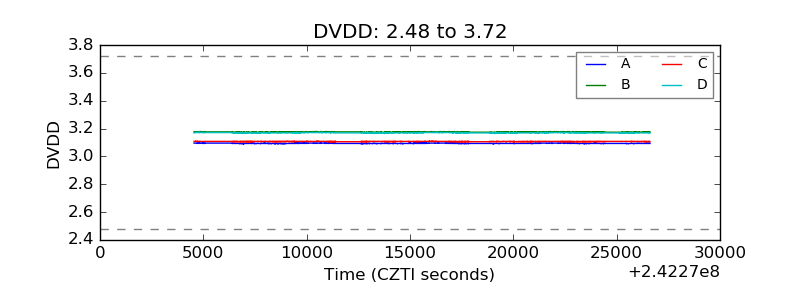 |
| Temperature 1 | 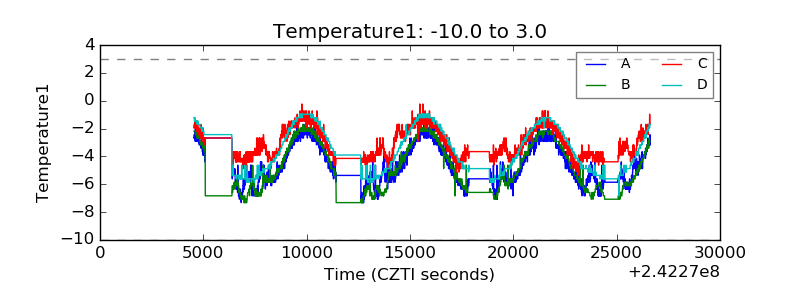 |
| Veto HV Monitor | 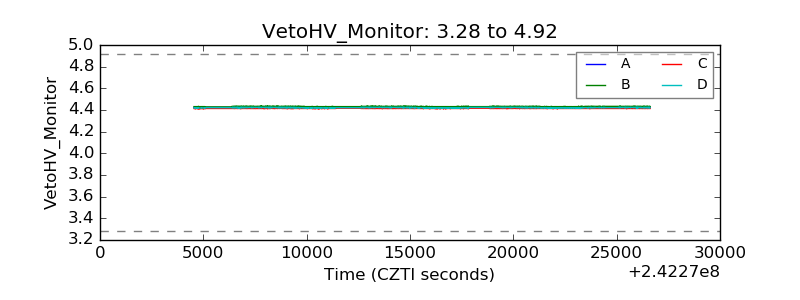 |
| Veto LLD | 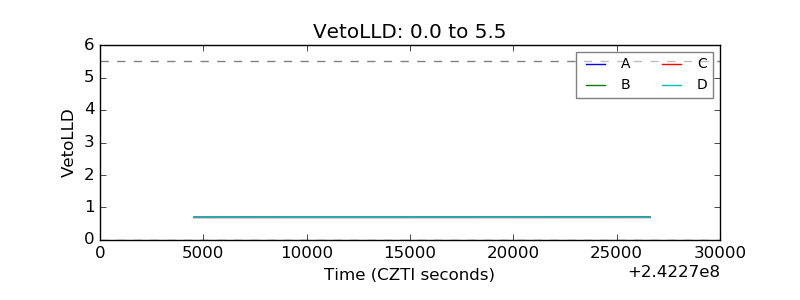 |
| Alpha Counter | 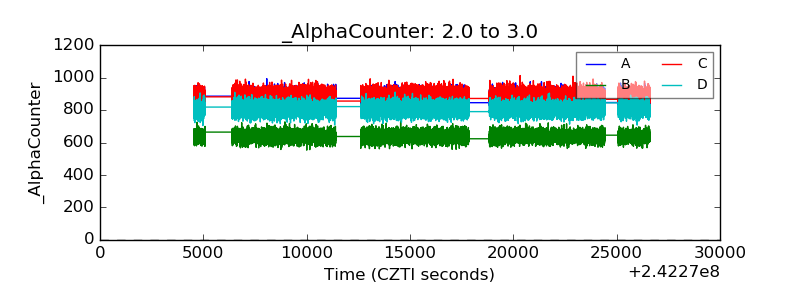 |
| _CPM_Rate | 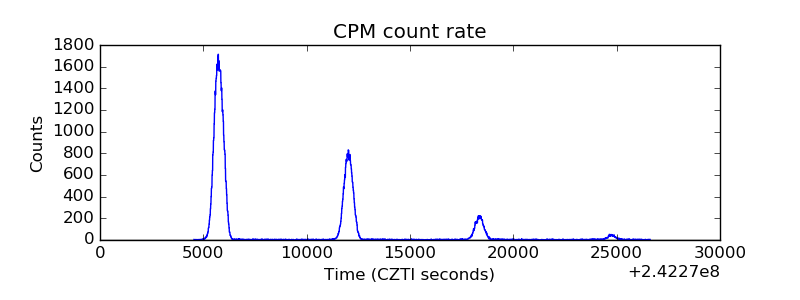 |
| CZT Counter | 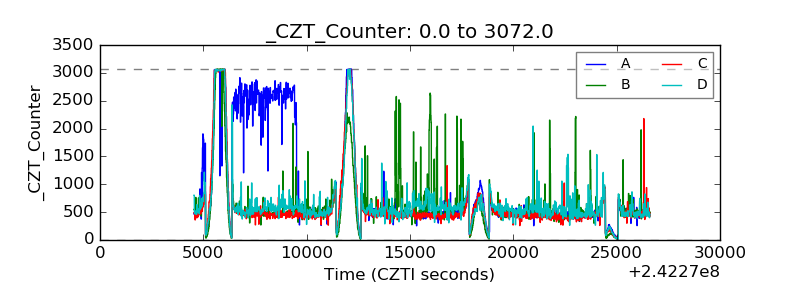 |
| +2.5 Volts monitor |  |
| +5 Volts monitor |  |
| _ROLL_ROT | 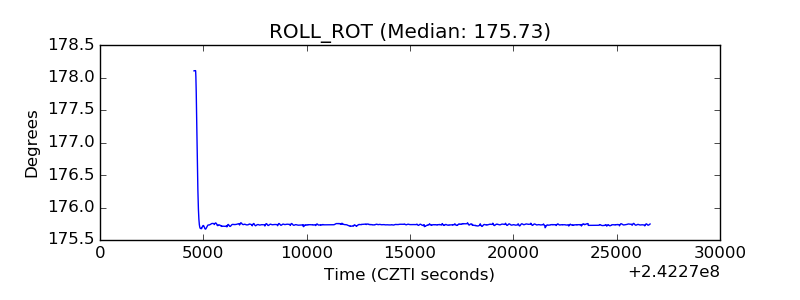 |
| _Roll_DEC | 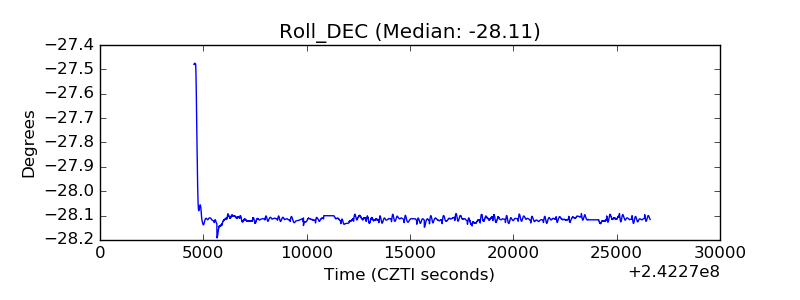 |
| _Roll_RA | 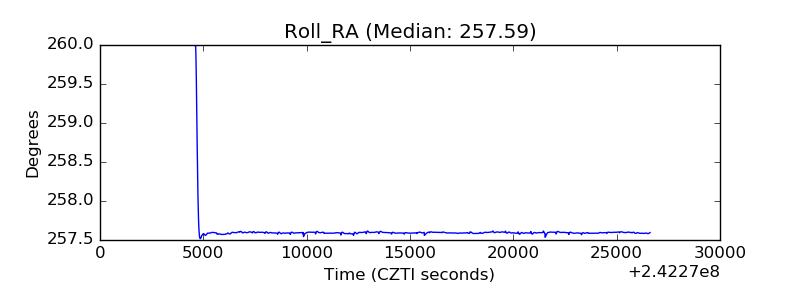 |
| Veto Counter | 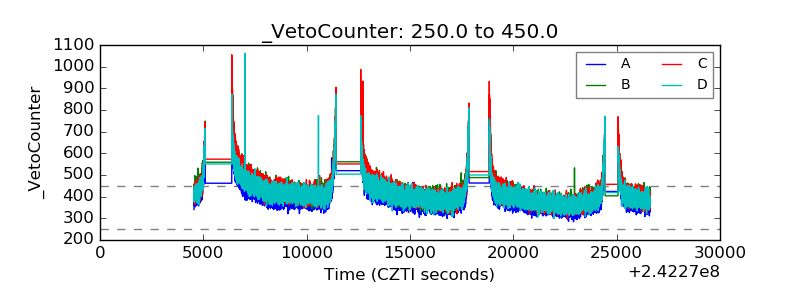 |