| Param | Original file | Final file |
|---|---|---|
| Filename | modeM0/AS1A03_084T01_9000001514_10483cztM0_level2.evt | modeM0/AS1A03_084T01_9000001514_10483cztM0_level2_quad_clean.evt |
| Size (bytes) | 303,468,480 | 63,959,040 |
| Size | 289.4 MB | 61.0 MB |
| Events in quadrant A | 2,109,971 | 412,762 |
| Events in quadrant B | 2,622,206 | 416,419 |
| Events in quadrant C | 1,969,367 | 408,036 |
| Events in quadrant D | 2,184,503 | 385,731 |
| Mode SS | |||
|---|---|---|---|
| Quadrant | BADHDUFLAG | Total packets | Discarded packets |
| A | 0 | 90 | 0 |
| B | 0 | 90 | 0 |
| C | 0 | 90 | 0 |
| D | 0 | 90 | 0 |
| Mode M0 | |||
|---|---|---|---|
| Quadrant | BADHDUFLAG | Total packets | Discarded packets |
| A | 0 | 9124 | 5 |
| B | 0 | 10651 | 34 |
| C | 0 | 9107 | 3 |
| D | 0 | 9543 | 23 |
| Mode M9 | |||
|---|---|---|---|
| Quadrant | BADHDUFLAG | Total packets | Discarded packets |
| A | 0 | 3 | 0 |
| B | 0 | 3 | 0 |
| C | 0 | 3 | 0 |
| D | 0 | 4 | 0 |
| Quadrant | Total seconds | Saturated seconds | Saturation percentage |
|---|---|---|---|
| A | 4461 | 43 | 0.963909% |
| B | 4450 | 143 | 3.213483% |
| C | 4462 | 24 | 0.537875% |
| D | 4453 | 32 | 0.718617% |
Noise dominated data is calculated using 1-second bins in cleaned event files. If a bin has >2000 counts, and if more than 50% of those come from <1% of pixels, then it is considered to be noise-dominated and hence unusable.
| Quadrant | # 1 sec bins | Bins with >0 counts | Bins with >2000 counts | High rate bins dominated by noise | Noise dominated (total time) | Noise dominated (detector-on time) | Marked lightcurve |
|---|---|---|---|---|---|---|---|
| A | 4462 | 4462 | 1 | 1 | 0.02% | 0.02% | 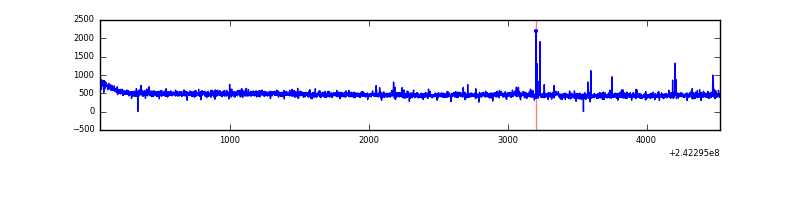 |
| B | 4462 | 4458 | 82 | 82 | 1.84% | 1.84% | 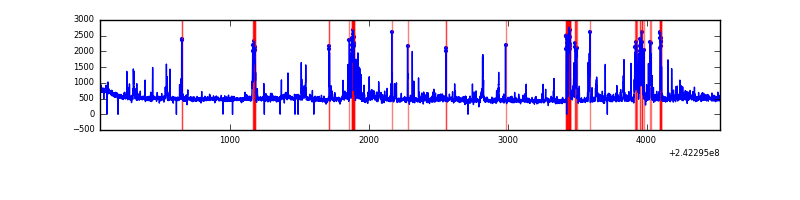 |
| C | 4462 | 4462 | 2 | 2 | 0.04% | 0.04% | 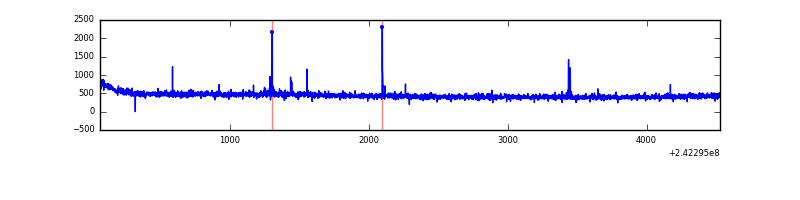 |
| D | 4462 | 4460 | 6 | 6 | 0.13% | 0.13% | 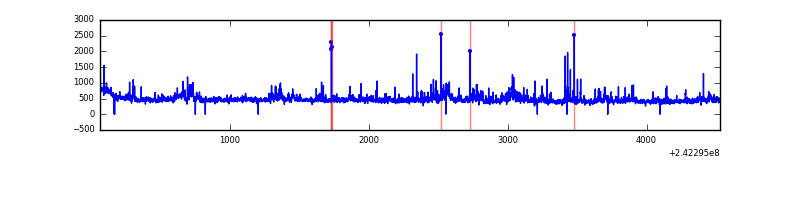 |
Top three noisy pixels from each quadrant. If the there are fewer than three noisy pixels in the level2.evt file, extra rows are filled as -1
| Pixel properties | Quadrant properties | ||||||
|---|---|---|---|---|---|---|---|
| Quadrant | DetID | PixID | Counts | Sigma | Mean | Median | Sigma |
| A | 3 | 80 | 63252 | 587.07 | 518 | 506 | 106.9 |
| A | 13 | 251 | 22095 | 201.99 | 518 | 506 | 106.9 |
| A | 4 | 2 | 8288 | 72.81 | 518 | 506 | 106.9 |
| B | 4 | 239 | 425371 | 4242.89 | 514 | 503 | 100.1 |
| B | 11 | 51 | 104196 | 1035.52 | 514 | 503 | 100.1 |
| B | 0 | 214 | 30924 | 303.8 | 514 | 503 | 100.1 |
| C | 14 | 234 | 18691 | 155.35 | 498 | 499 | 117.1 |
| C | 3 | 254 | 6201 | 48.69 | 498 | 499 | 117.1 |
| C | 13 | 61 | 3671 | 27.09 | 498 | 499 | 117.1 |
| D | 1 | 20 | 123637 | 1033.91 | 494 | 479 | 119.1 |
| D | 1 | 52 | 75945 | 633.54 | 494 | 479 | 119.1 |
| D | 2 | 14 | 35657 | 295.32 | 494 | 479 | 119.1 |
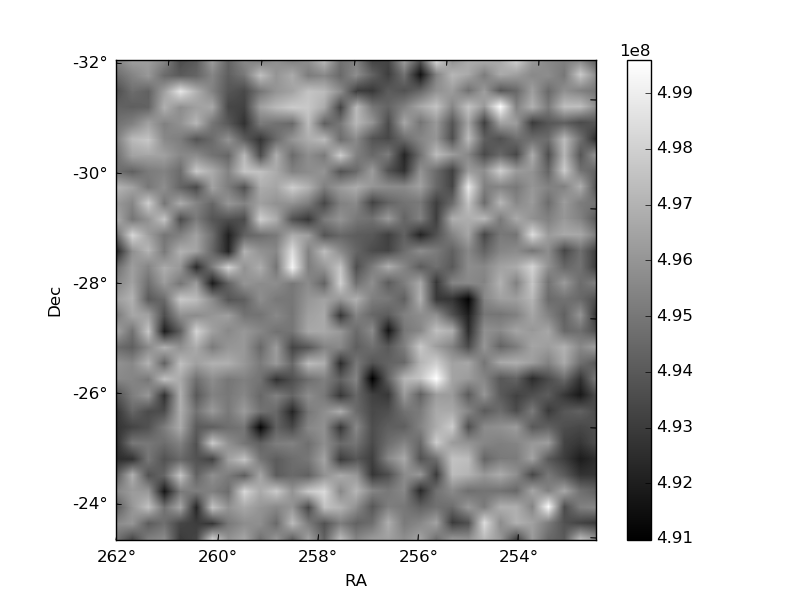
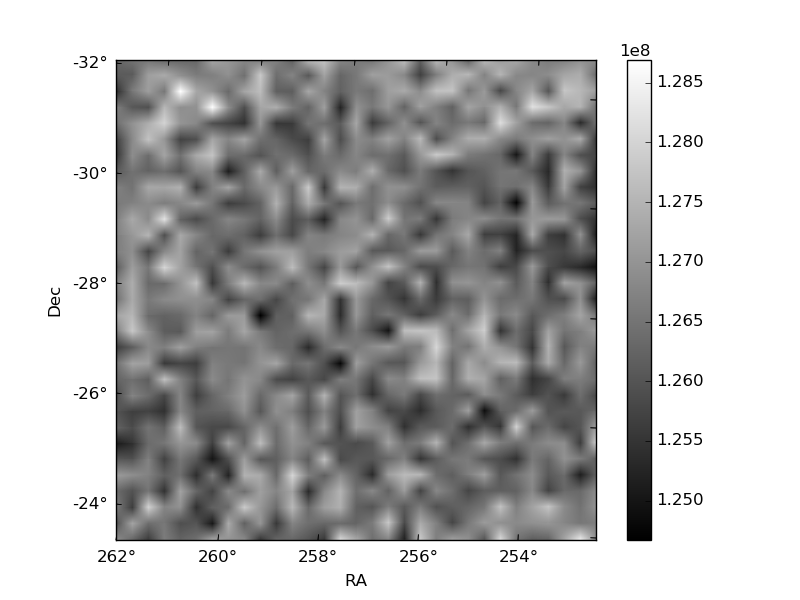
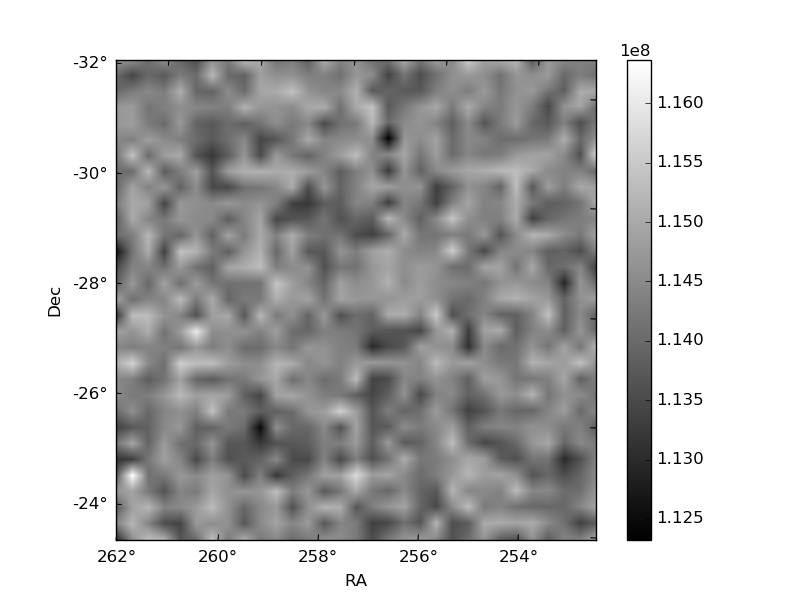
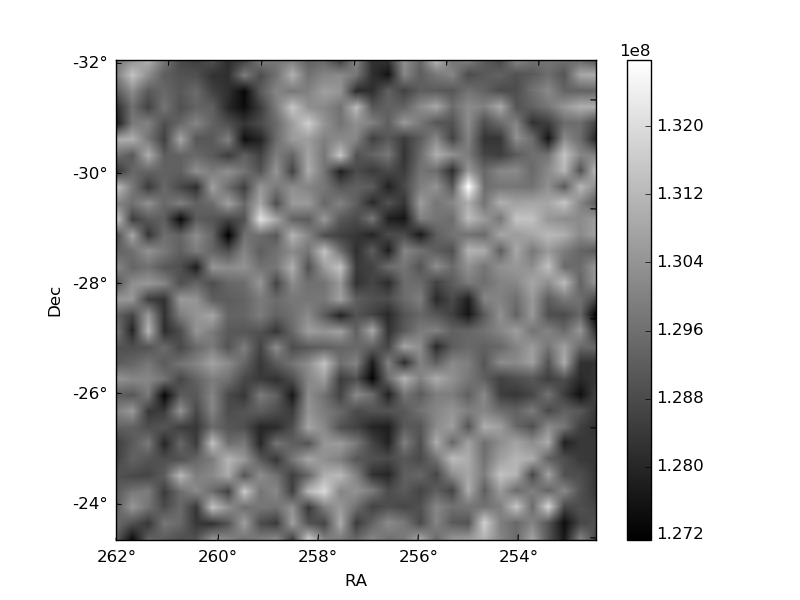
Histogram calculated using DETX and DETY for each event in the final _common_clean file
| Quadrant A | 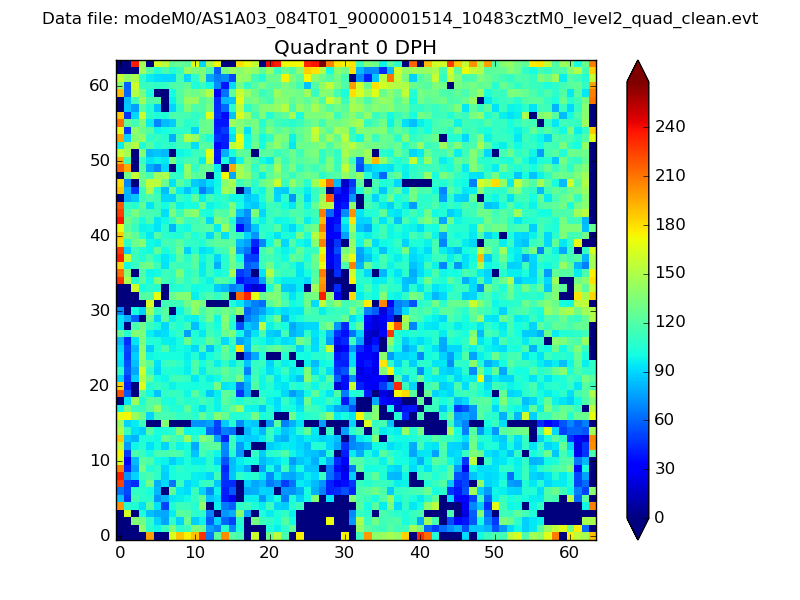 |
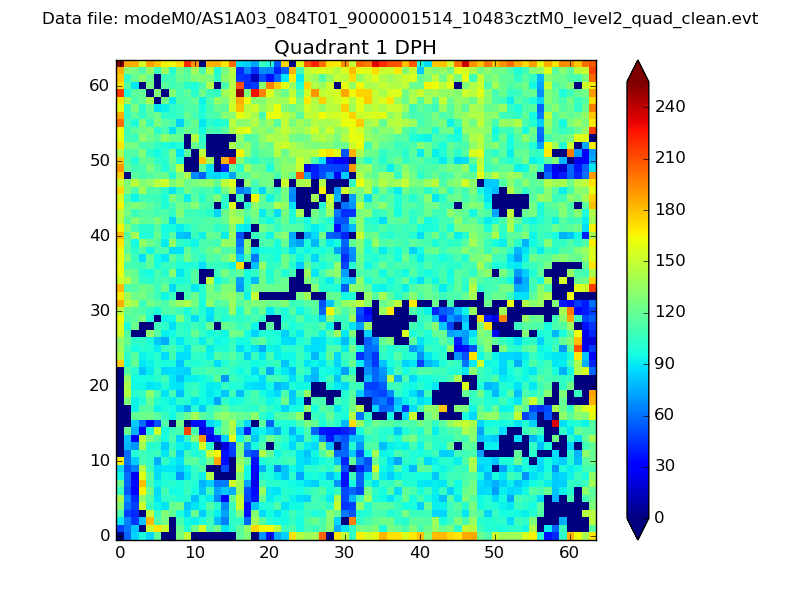 |
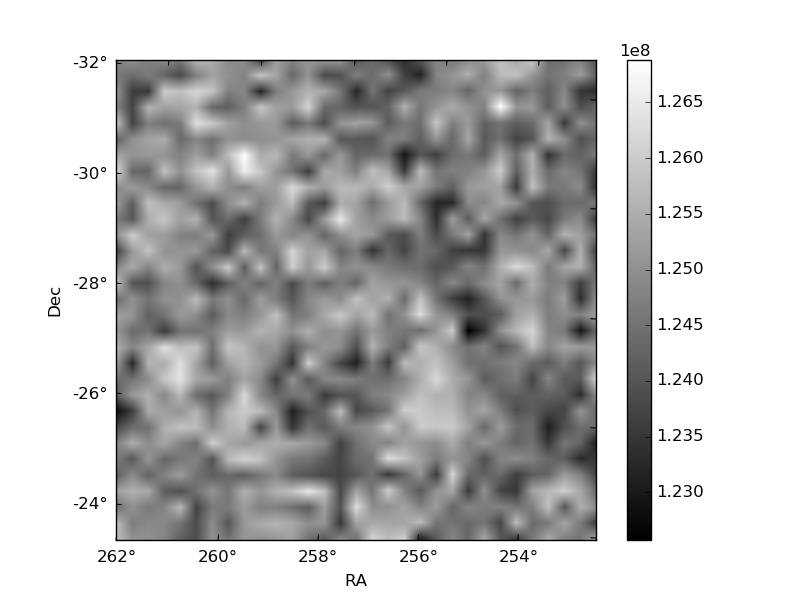
Quadrant B |
|---|---|---|---|
| Quadrant D | 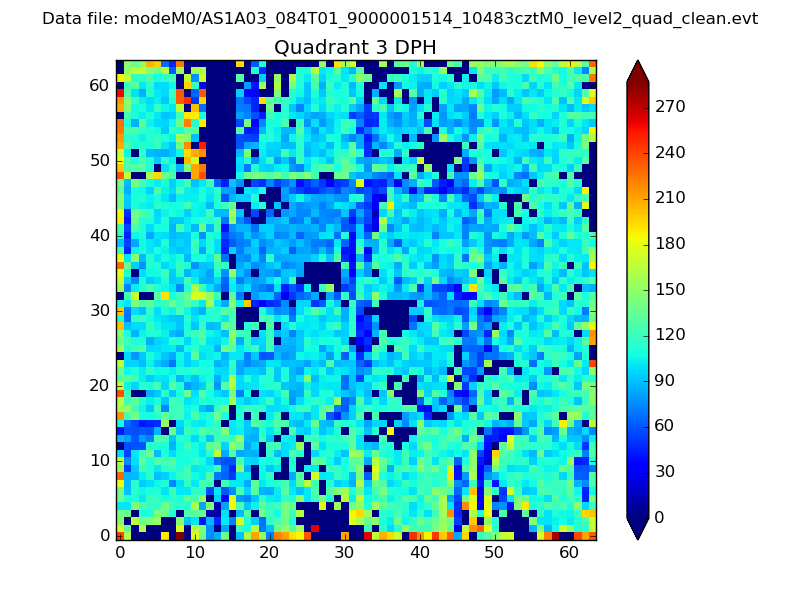 |
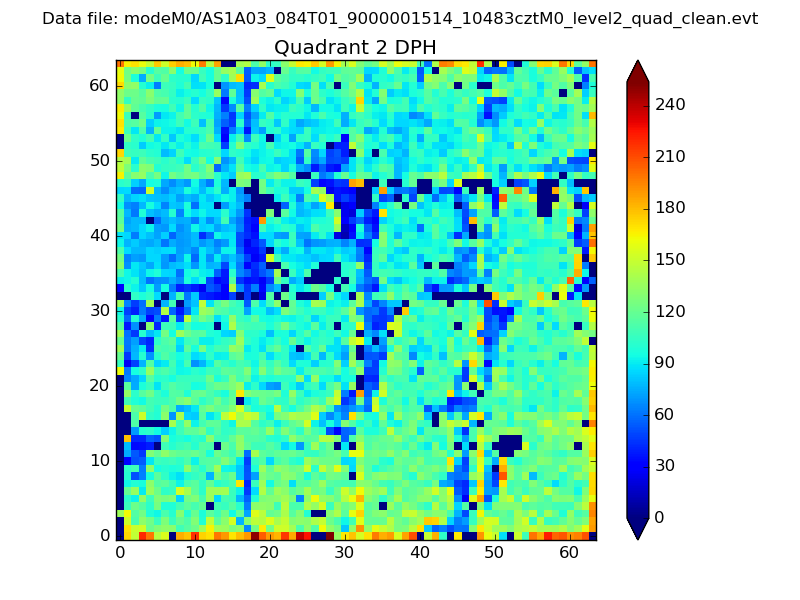 |
Quadrant C |
| Plot type | Count rate plots | Images |
|---|---|---|
| Comparison with Poisson distribution Blue bars denote a histogram of data divided into 1 sec bins. Red curve is a Poisson curve with rate = median count rate of data. |
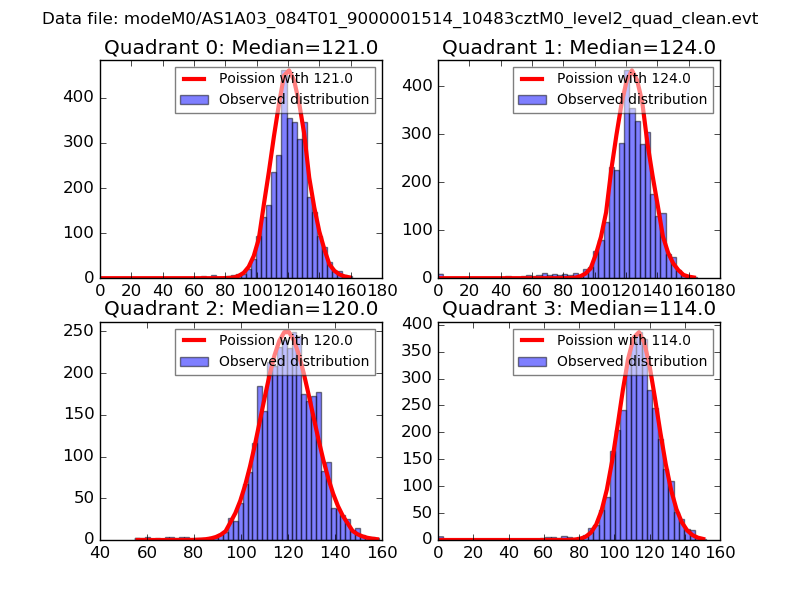 |
 |
| Quadrant-wise count rates Data is divided into 100 sec bins |
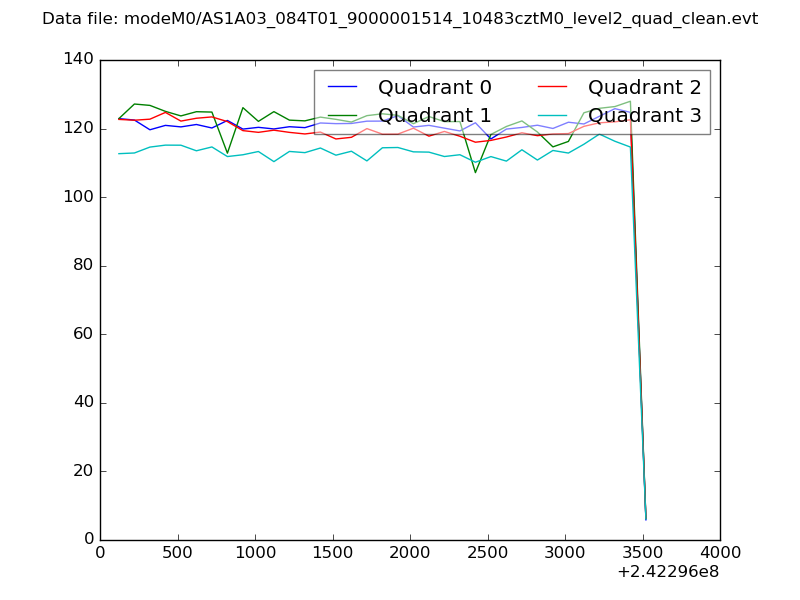 |
|
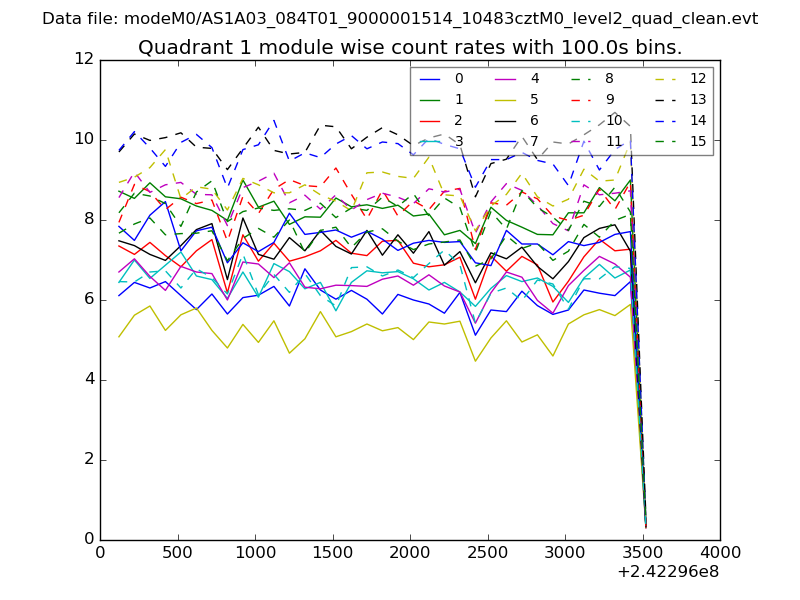
| Module-wise count rates for Quadrant A Data is divided into 100 sec bins |
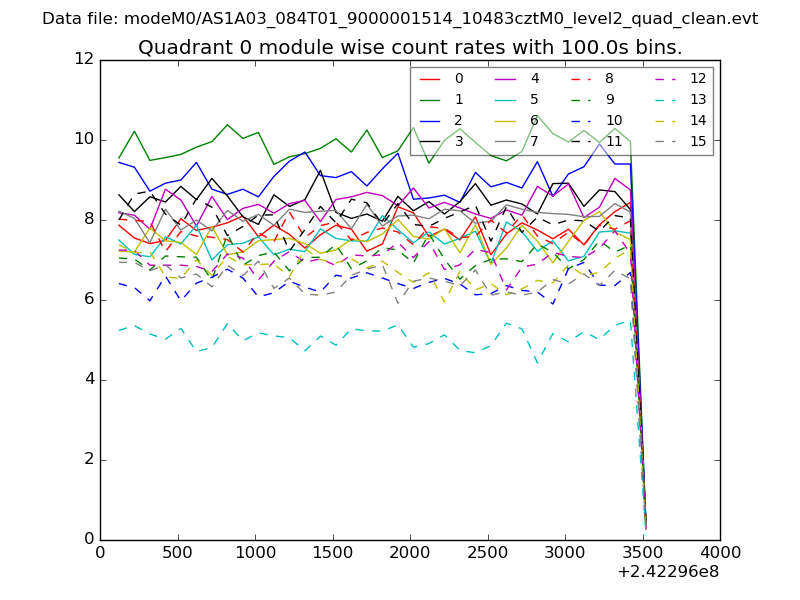 |
 |
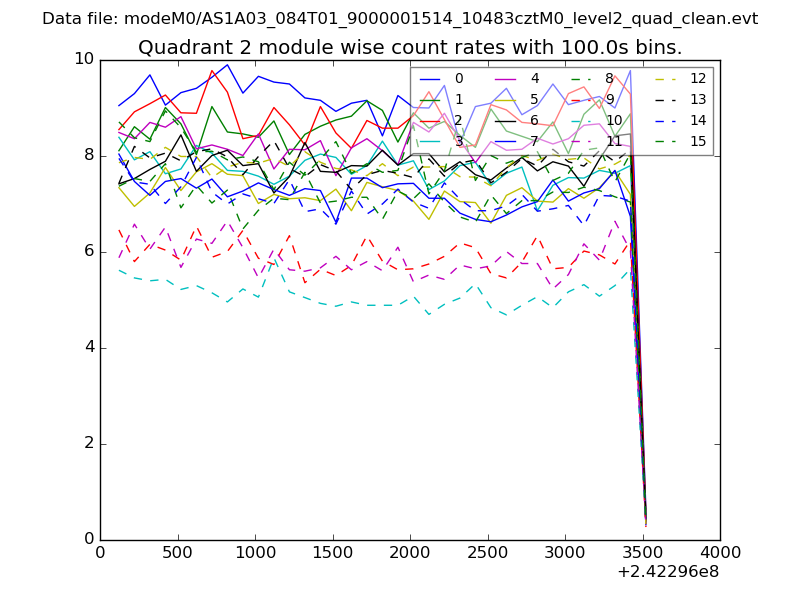
| Module-wise count rates for Quadrant B Data is divided into 100 sec bins |
 |
 |
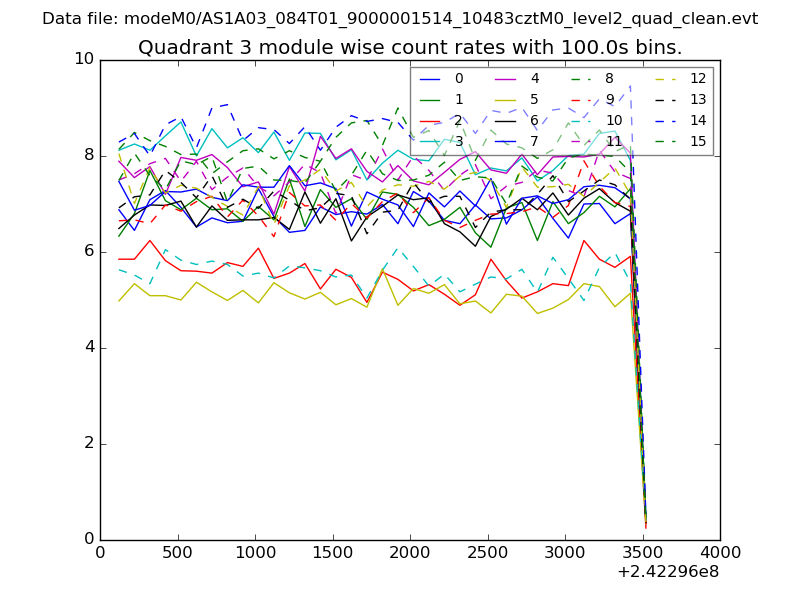
| Module-wise count rates for Quadrant C Data is divided into 100 sec bins |
 |
 |
| Module-wise count rates for Quadrant D Data is divided into 100 sec bins |
 |
 |
| Parameter | Plot |
|---|---|
| CZT HV Monitor | 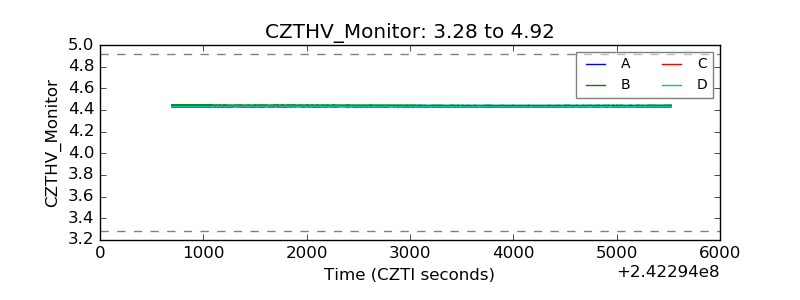 |
| D_VDD | 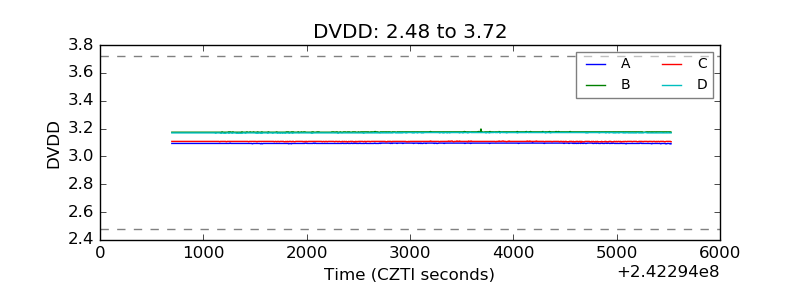 |
| Temperature 1 | 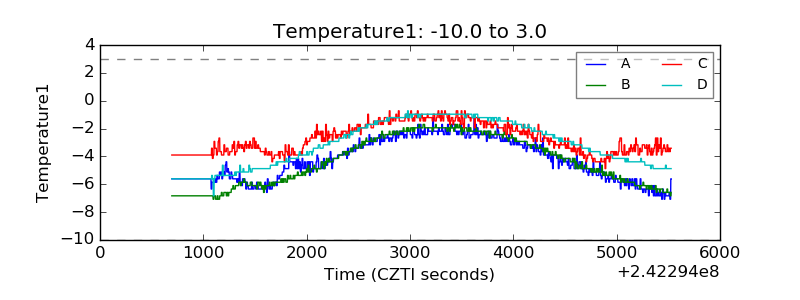 |
| Veto HV Monitor | 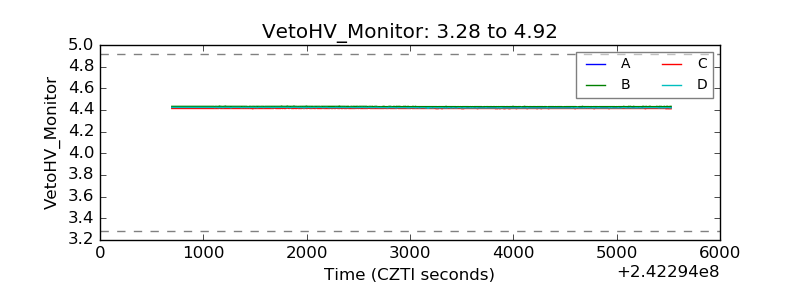 |
| Veto LLD | 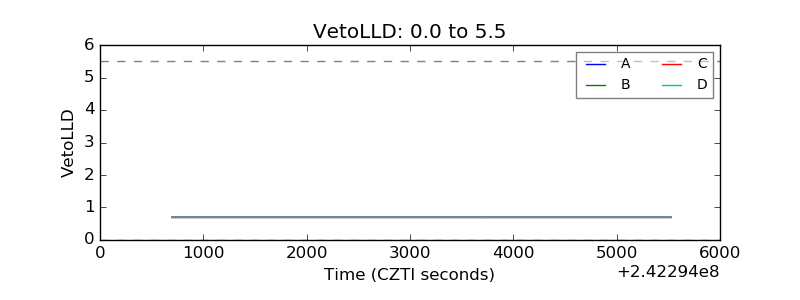 |
| Alpha Counter | 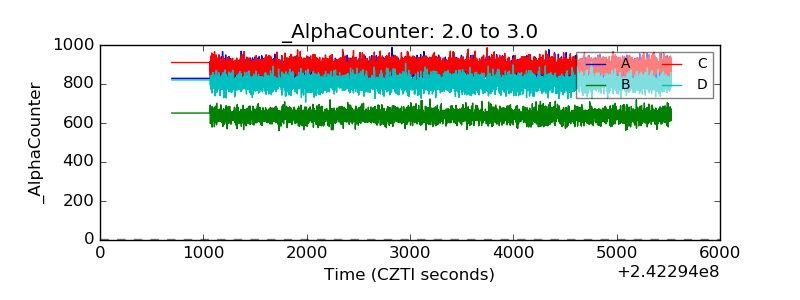 |
| _CPM_Rate | 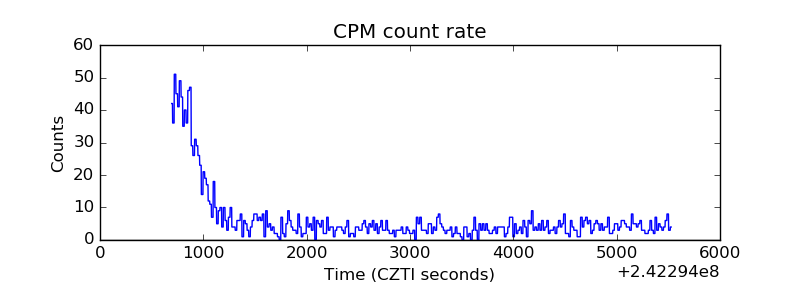 |
| CZT Counter | 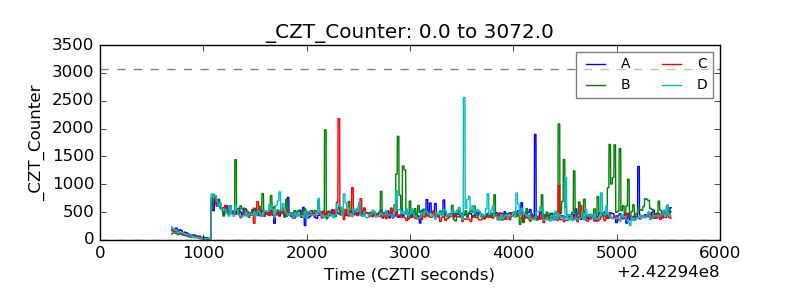 |
| +2.5 Volts monitor |  |
| +5 Volts monitor |  |
| _ROLL_ROT | 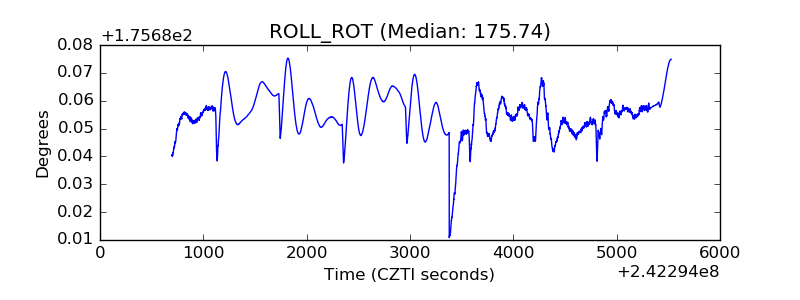 |
| _Roll_DEC | 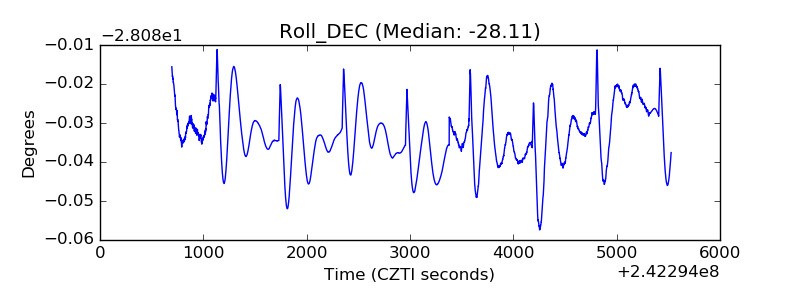 |
| _Roll_RA | 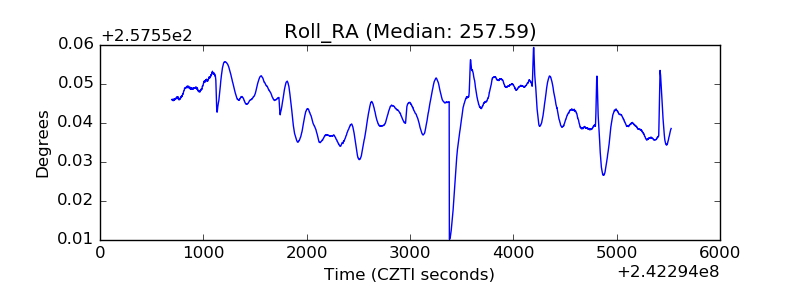 |
| Veto Counter | 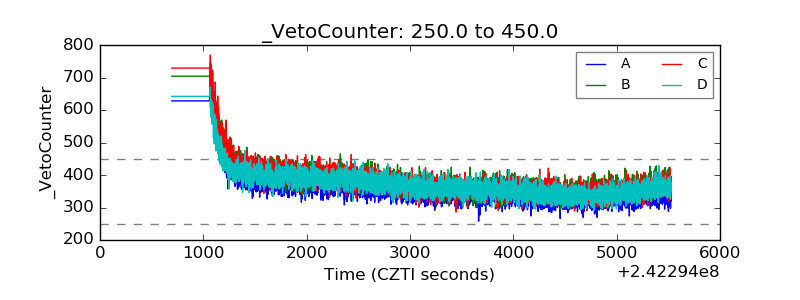 |