| Param | Original file | Final file |
|---|---|---|
| Filename | modeM0/AS1G07_027T01_9000001516cztM0_level2.fits | modeM0/AS1G07_027T01_9000001516cztM0_level2_quad_clean.evt |
| Size (bytes) | 121,291,200 | 123,143,040 |
| Size | 115.7 MB | 117.4 MB |
| Events in quadrant A | 715,764 | 737,329 |
| Events in quadrant B | 671,468 | 690,490 |
| Events in quadrant C | 743,314 | 760,223 |
| Events in quadrant D | 620,274 | 620,079 |
| Mode SS | |||
|---|---|---|---|
| Quadrant | BADHDUFLAG | Total packets | Discarded packets |
| A | 0 | 88 | 0 |
| B | 0 | 301 | 0 |
| C | 0 | 306 | 0 |
| D | 0 | 196 | 0 |
| Mode M9 | |||
|---|---|---|---|
| Quadrant | BADHDUFLAG | Total packets | Discarded packets |
| A | 0 | 8 | 0 |
| B | 0 | 8 | 0 |
| C | 0 | 8 | 0 |
| D | 0 | 8 | 0 |
| Mode M0 | |||
|---|---|---|---|
| Quadrant | BADHDUFLAG | Total packets | Discarded packets |
| A | 0 | 28387 | 0 |
| B | 0 | 28109 | 0 |
| C | 0 | 28641 | 0 |
| D | 0 | 31581 | 0 |
| Quadrant | Total seconds | Saturated seconds | Saturation percentage |
|---|---|---|---|
| A | 13540 | 351 | 2.592319% |
| B | 12998 | 440 | 3.385136% |
| C | 14033 | 294 | 2.095062% |
| D | 13526 | 373 | 2.757652% |
Noise dominated data is calculated using 1-second bins in cleaned event files. If a bin has >2000 counts, and if more than 50% of those come from <1% of pixels, then it is considered to be noise-dominated and hence unusable.
| Quadrant | # 1 sec bins | Bins with >0 counts | Bins with >2000 counts | High rate bins dominated by noise | Noise dominated (total time) | Noise dominated (detector-on time) | Marked lightcurve |
|---|---|---|---|---|---|---|---|
| A | 17040 | 13924 | 0 | 0 | 0.00% | 0.00% |  |
| B | 17040 | 13385 | 0 | 0 | 0.00% | 0.00% |  |
| C | 17041 | 14362 | 0 | 0 | 0.00% | 0.00% |  |
| D | 17040 | 13735 | 0 | 0 | 0.00% | 0.00% |  |
Top three noisy pixels from each quadrant. If the there are fewer than three noisy pixels in the level2.evt file, extra rows are filled as -1
| Pixel properties | Quadrant properties | ||||||
|---|---|---|---|---|---|---|---|
| Quadrant | DetID | PixID | Counts | Sigma | Mean | Median | Sigma |
| A | 14 | 188 | 759 | 12.08 | 185 | 174 | 48.4 |
| A | 0 | 29 | 657 | 9.98 | 185 | 174 | 48.4 |
| A | 7 | 110 | 622 | 9.25 | 185 | 174 | 48.4 |
| B | 2 | 9 | 555 | 10.07 | 177 | 168 | 38.4 |
| B | 5 | 128 | 453 | 7.42 | 177 | 168 | 38.4 |
| B | 14 | 254 | 448 | 7.29 | 177 | 168 | 38.4 |
| C | 12 | 241 | 518 | 6.37 | 196 | 182 | 52.8 |
| C | 7 | 111 | 507 | 6.16 | 196 | 182 | 52.8 |
| C | 2 | 191 | 497 | 5.97 | 196 | 182 | 52.8 |
| D | 3 | 14 | 461 | 6.19 | 176 | 159 | 48.8 |
| D | 6 | 231 | 452 | 6.0 | 176 | 159 | 48.8 |
| D | 7 | 5 | 444 | 5.84 | 176 | 159 | 48.8 |
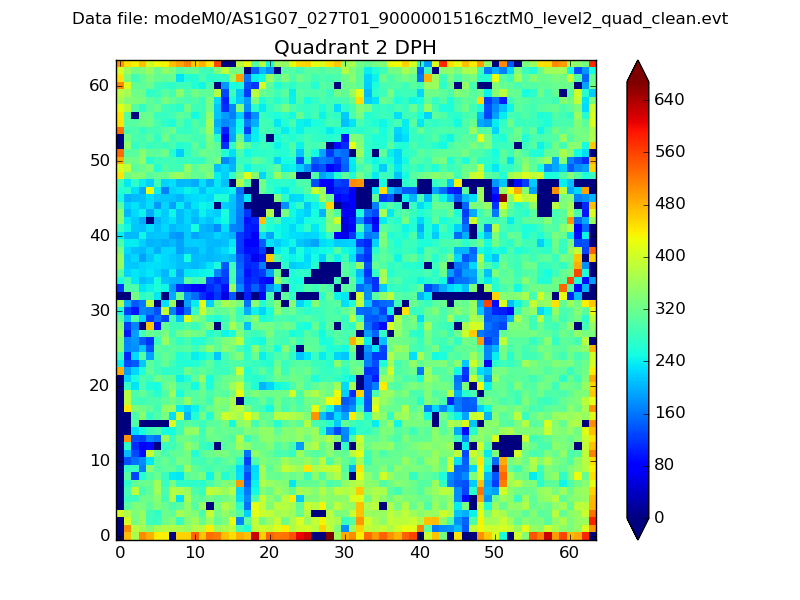
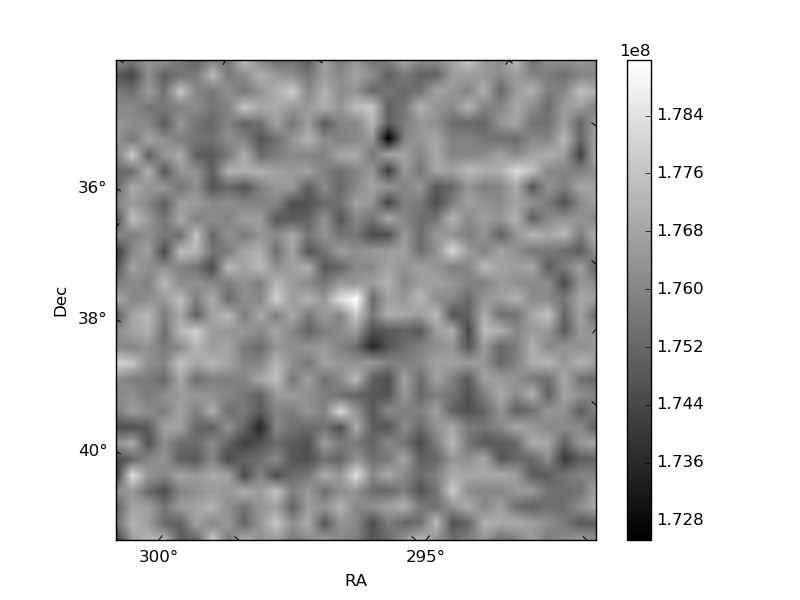
Histogram calculated using DETX and DETY for each event in the final _common_clean file
| Quadrant A |  |
 |
Quadrant B |
|---|---|---|---|
| Quadrant D |  |
 |
Quadrant C |
| Plot type | Count rate plots | Images |
|---|---|---|
| Comparison with Poisson distribution Blue bars denote a histogram of data divided into 1 sec bins. Red curve is a Poisson curve with rate = median count rate of data. |
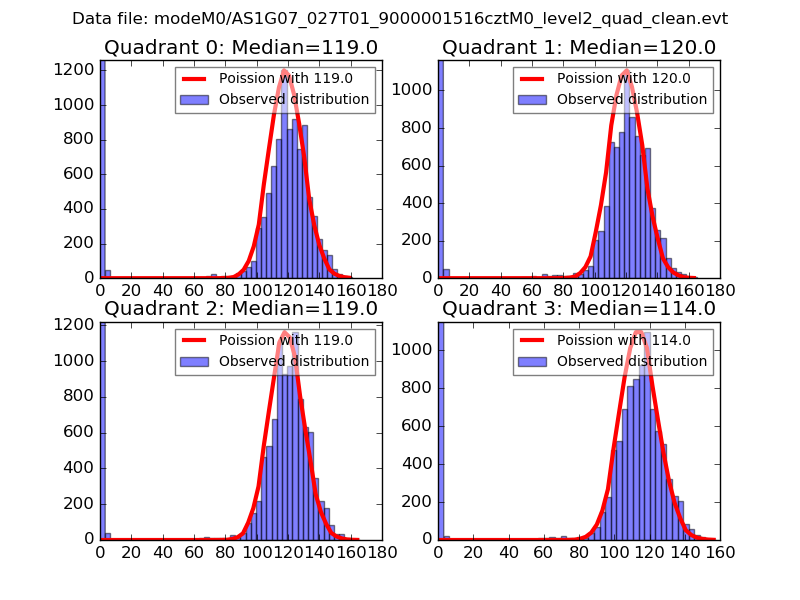 |
 |
| Quadrant-wise count rates Data is divided into 100 sec bins |
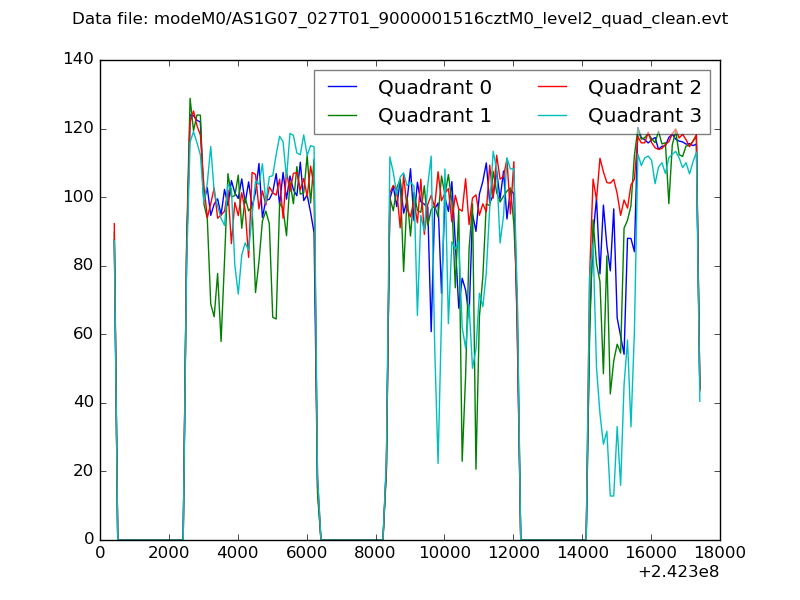 |
|
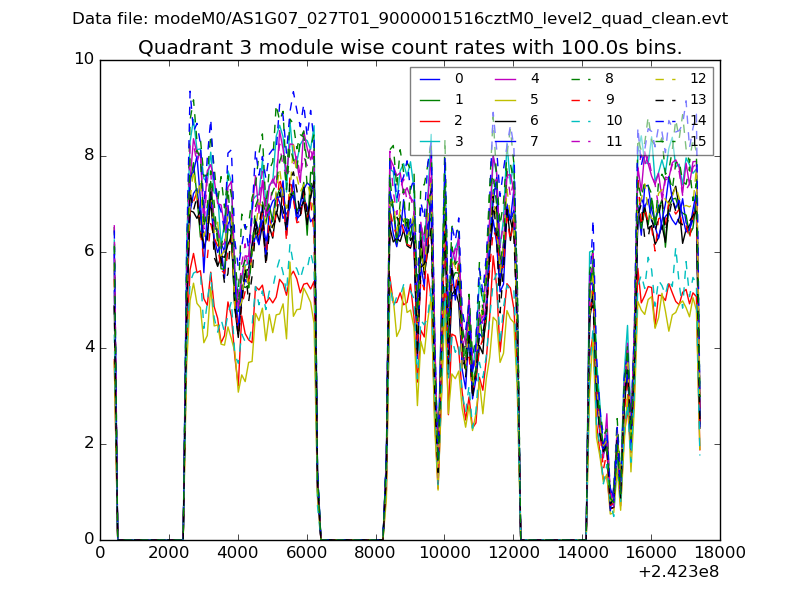
| Module-wise count rates for Quadrant A Data is divided into 100 sec bins |
 |
 |
| Module-wise count rates for Quadrant B Data is divided into 100 sec bins |
 |
 |
| Module-wise count rates for Quadrant C Data is divided into 100 sec bins |
 |
 |
| Module-wise count rates for Quadrant D Data is divided into 100 sec bins |
 |
 |
| Parameter | Plot |
|---|---|
| CZT HV Monitor |  |
| D_VDD |  |
| Temperature 1 |  |
| Veto HV Monitor |  |
| Veto LLD | 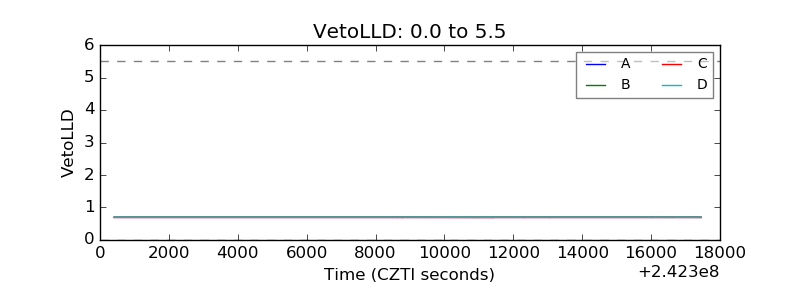 |
| Alpha Counter |  |
| _CPM_Rate | 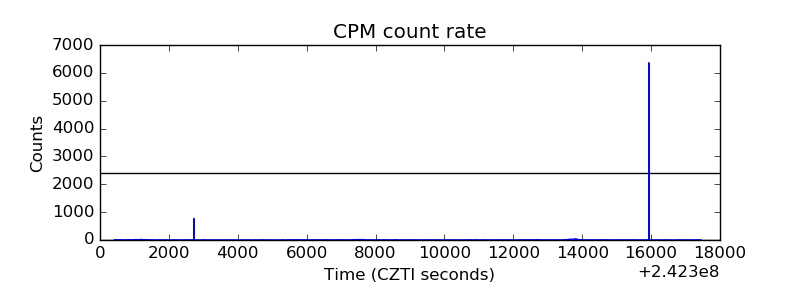 |
| CZT Counter | 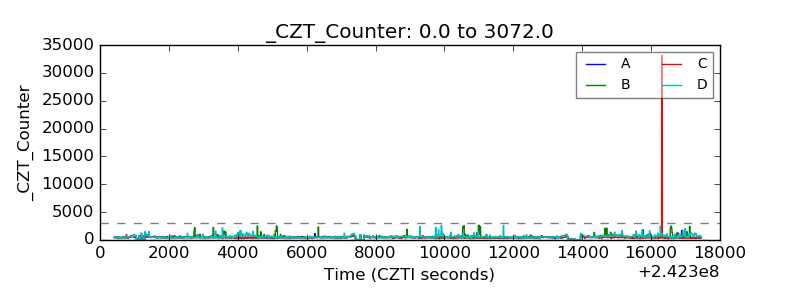 |
| +2.5 Volts monitor |  |
| +5 Volts monitor |  |
| _ROLL_ROT |  |
| _Roll_DEC | 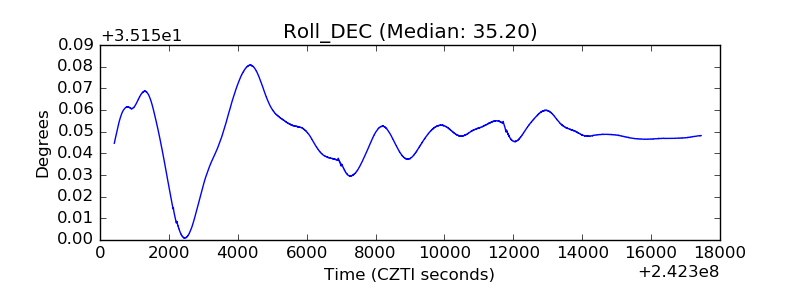 |
| _Roll_RA | 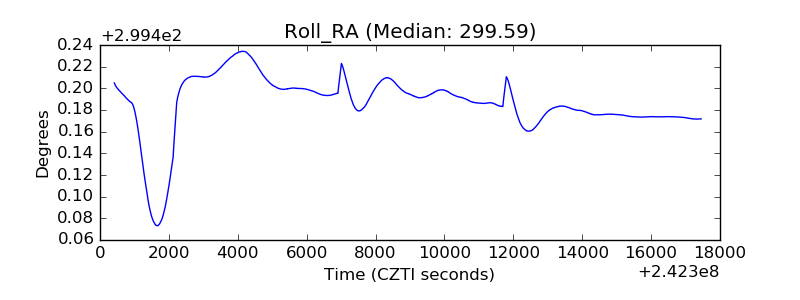 |
| Veto Counter | 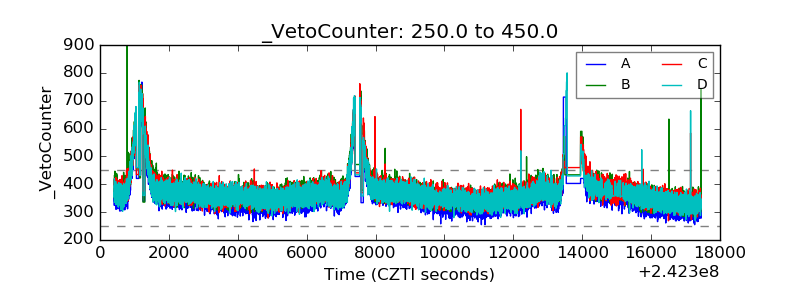 |