| Param | Original file | Final file |
|---|---|---|
| Filename | modeM0/AS1G07_027T01_9000001516_10484cztM0_level2.evt | modeM0/AS1G07_027T01_9000001516_10484cztM0_level2_quad_clean.evt |
| Size (bytes) | 388,054,080 | 73,762,560 |
| Size | 370.1 MB | 70.3 MB |
| Events in quadrant A | 2,705,945 | 464,600 |
| Events in quadrant B | 2,696,815 | 426,276 |
| Events in quadrant C | 2,537,692 | 460,715 |
| Events in quadrant D | 3,420,881 | 481,696 |
| Mode SS | |||
|---|---|---|---|
| Quadrant | BADHDUFLAG | Total packets | Discarded packets |
| A | 0 | 274 | 151 |
| B | 0 | 274 | 157 |
| C | 0 | 274 | 149 |
| D | 0 | 261 | 138 |
| Mode M9 | |||
|---|---|---|---|
| Quadrant | BADHDUFLAG | Total packets | Discarded packets |
| A | 0 | 4 | 2 |
| B | 0 | 4 | 2 |
| C | 0 | 4 | 2 |
| D | 0 | 4 | 2 |
| Mode M0 | |||
|---|---|---|---|
| Quadrant | BADHDUFLAG | Total packets | Discarded packets |
| A | 0 | 26630 | 14989 |
| B | 0 | 31213 | 19875 |
| C | 0 | 27357 | 15843 |
| D | 0 | 31295 | 17073 |
| Quadrant | Total seconds | Saturated seconds | Saturation percentage |
|---|---|---|---|
| A | 5687 | 97 | 1.705644% |
| B | 5314 | 95 | 1.787731% |
| C | 5661 | 78 | 1.377848% |
| D | 6243 | 104 | 1.665866% |
Noise dominated data is calculated using 1-second bins in cleaned event files. If a bin has >2000 counts, and if more than 50% of those come from <1% of pixels, then it is considered to be noise-dominated and hence unusable.
| Quadrant | # 1 sec bins | Bins with >0 counts | Bins with >2000 counts | High rate bins dominated by noise | Noise dominated (total time) | Noise dominated (detector-on time) | Marked lightcurve |
|---|---|---|---|---|---|---|---|
| A | 7073 | 6488 | 0 | 0 | 0.00% | 0.00% | 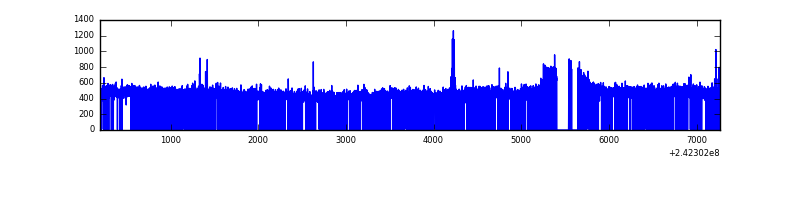 |
| B | 7073 | 6197 | 0 | 0 | 0.00% | 0.00% | 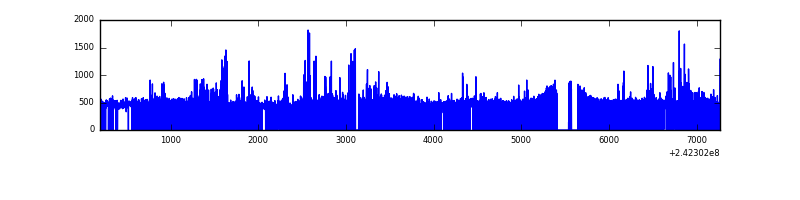 |
| C | 7073 | 6473 | 0 | 0 | 0.00% | 0.00% | 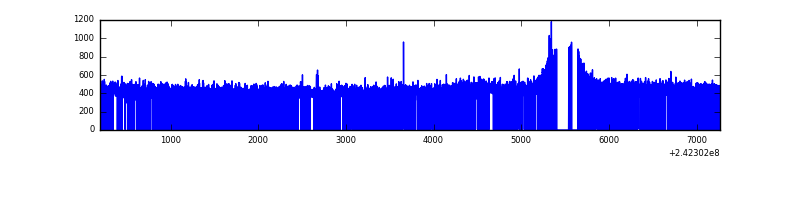 |
| D | 7073 | 6681 | 4 | 4 | 0.06% | 0.06% | 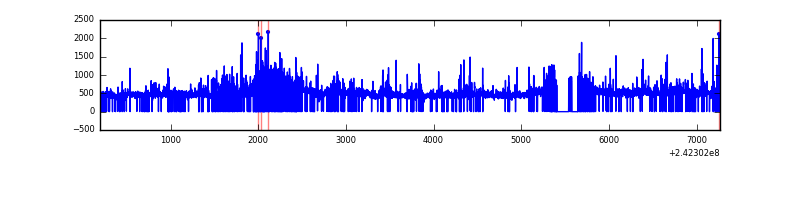 |
Top three noisy pixels from each quadrant. If the there are fewer than three noisy pixels in the level2.evt file, extra rows are filled as -1
| Pixel properties | Quadrant properties | ||||||
|---|---|---|---|---|---|---|---|
| Quadrant | DetID | PixID | Counts | Sigma | Mean | Median | Sigma |
| A | 3 | 80 | 76862 | 554.31 | 667 | 651 | 137.5 |
| A | 15 | 239 | 24600 | 174.19 | 667 | 651 | 137.5 |
| A | 5 | 16 | 18972 | 133.25 | 667 | 651 | 137.5 |
| B | 4 | 239 | 144015 | 1201.65 | 624 | 607 | 119.3 |
| B | 11 | 51 | 53511 | 443.29 | 624 | 607 | 119.3 |
| B | 0 | 214 | 42123 | 347.87 | 624 | 607 | 119.3 |
| C | 14 | 234 | 5707 | 33.44 | 647 | 649 | 151.3 |
| C | 13 | 61 | 4879 | 27.96 | 647 | 649 | 151.3 |
| C | 8 | 128 | 4064 | 22.58 | 647 | 649 | 151.3 |
| D | 1 | 52 | 316330 | 1851.33 | 707 | 688 | 170.5 |
| D | 8 | 195 | 178397 | 1042.31 | 707 | 688 | 170.5 |
| D | 1 | 20 | 170218 | 994.34 | 707 | 688 | 170.5 |
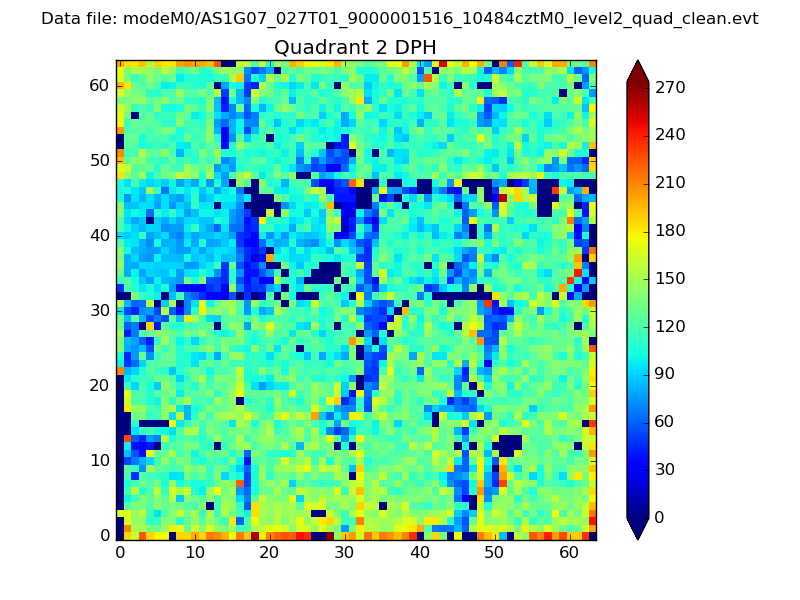
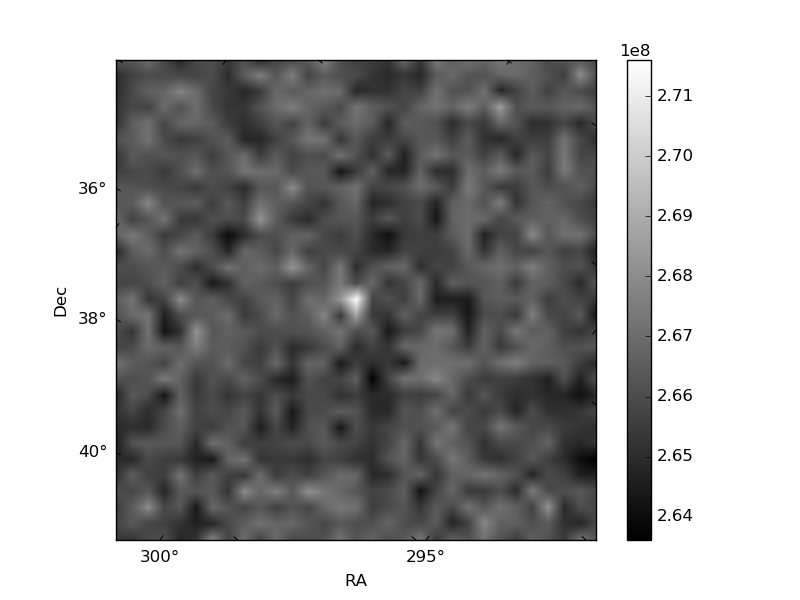
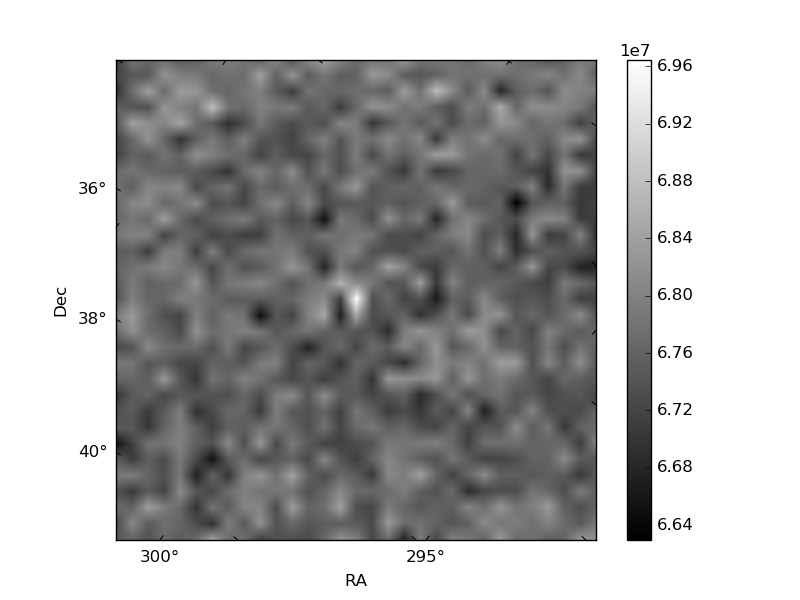
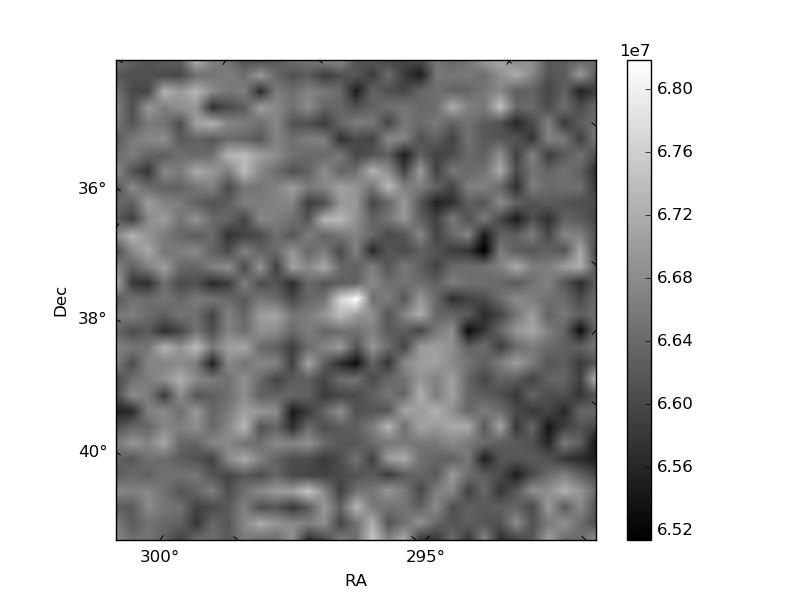
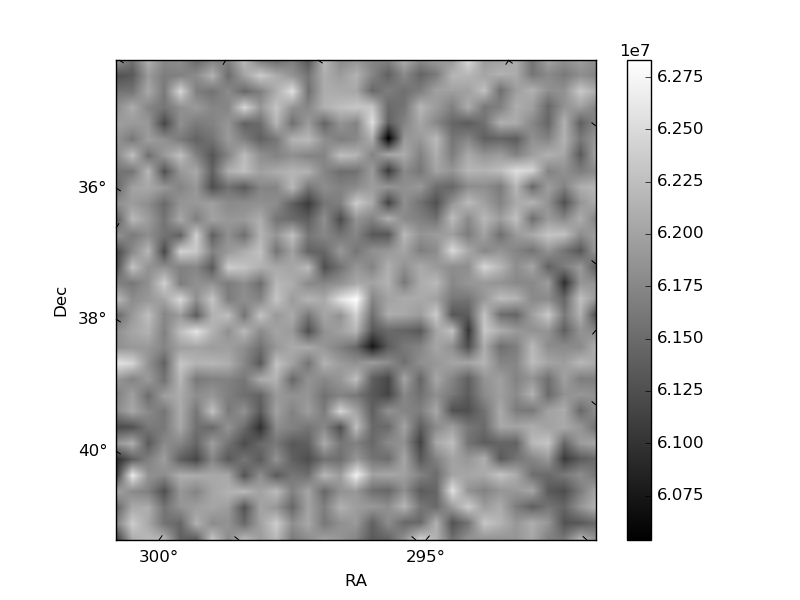
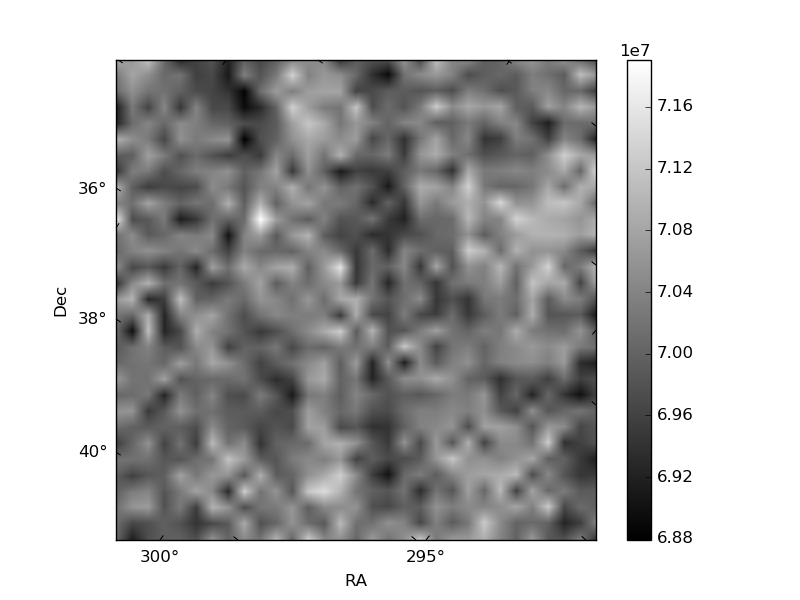
Histogram calculated using DETX and DETY for each event in the final _common_clean file
| Quadrant A | 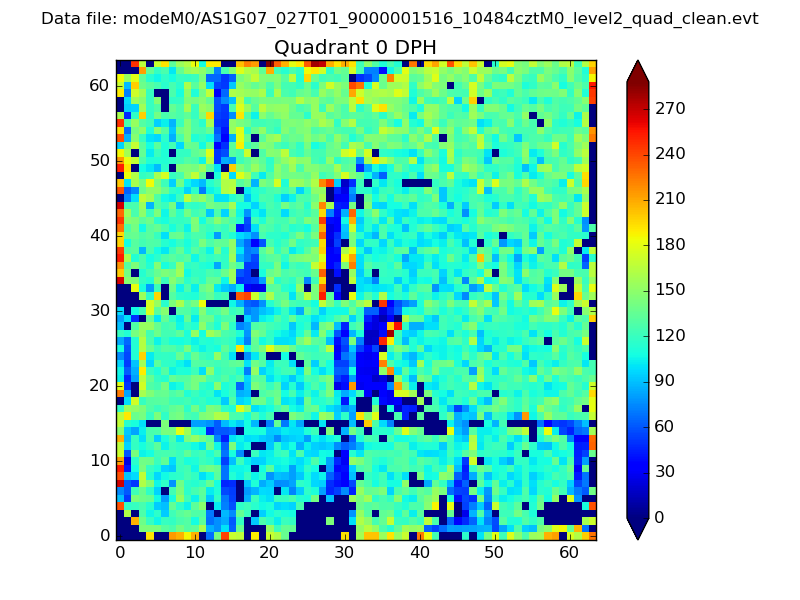 |
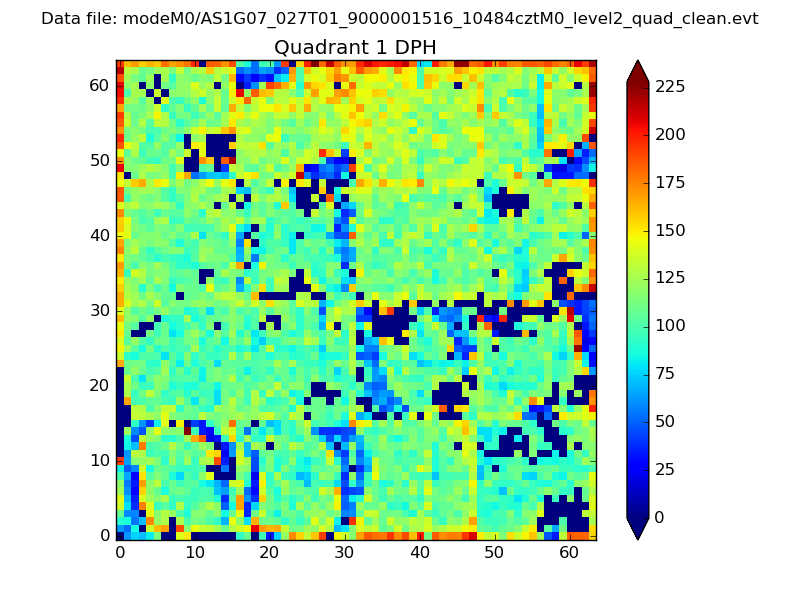 |
Quadrant B |
|---|---|---|---|
| Quadrant D | 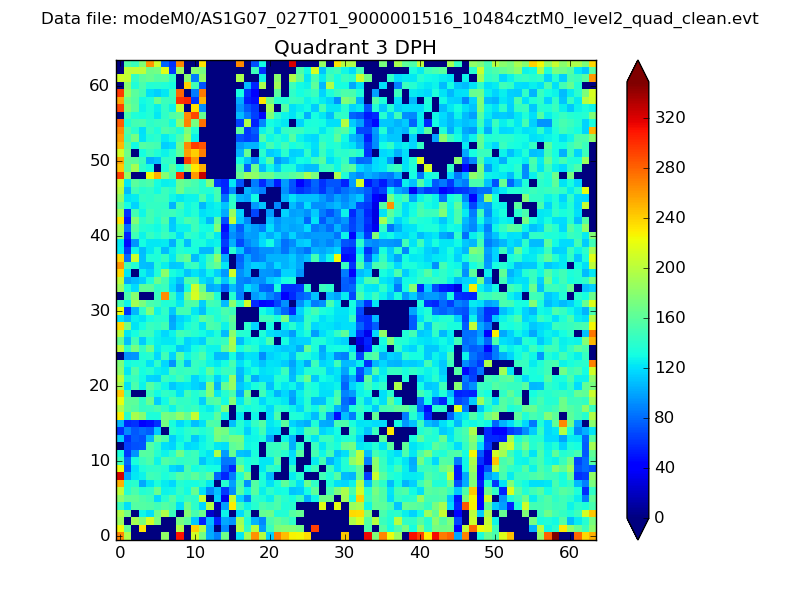 |
 |
Quadrant C |
| Plot type | Count rate plots | Images |
|---|---|---|
| Comparison with Poisson distribution Blue bars denote a histogram of data divided into 1 sec bins. Red curve is a Poisson curve with rate = median count rate of data. |
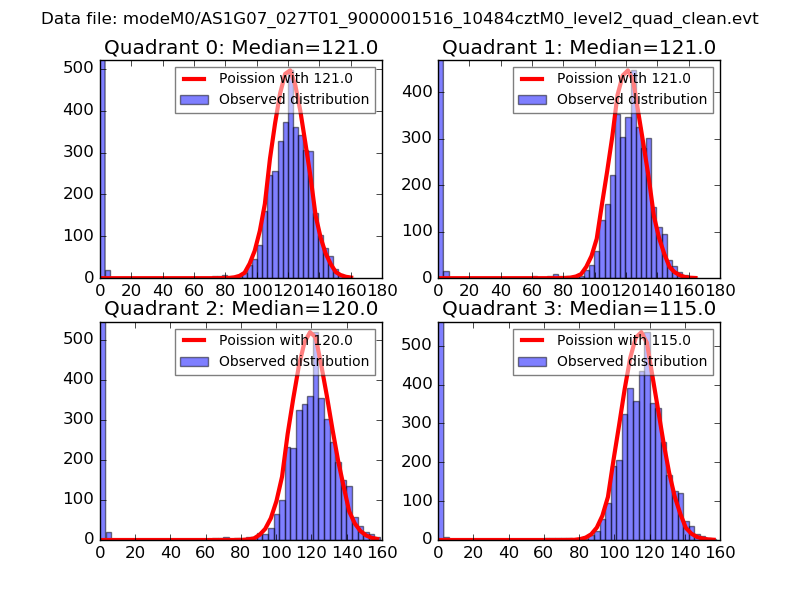 |
 |
| Quadrant-wise count rates Data is divided into 100 sec bins |
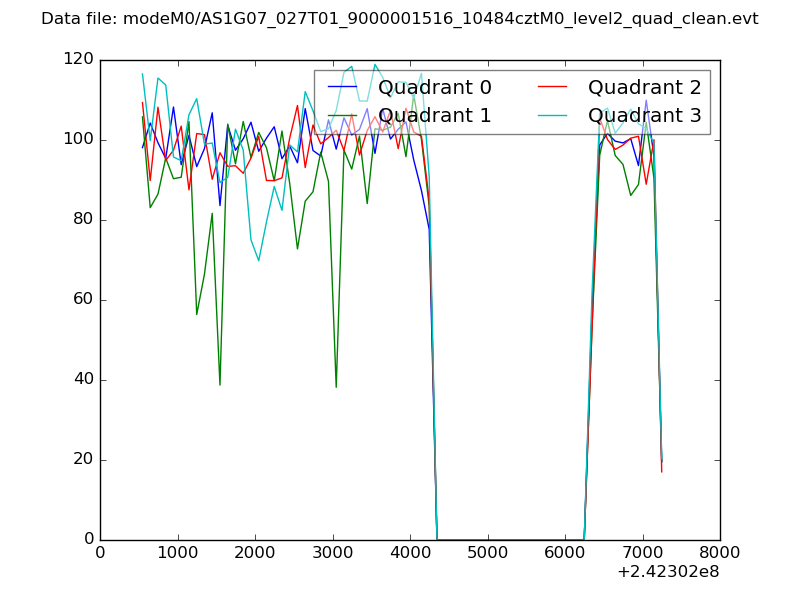 |
|
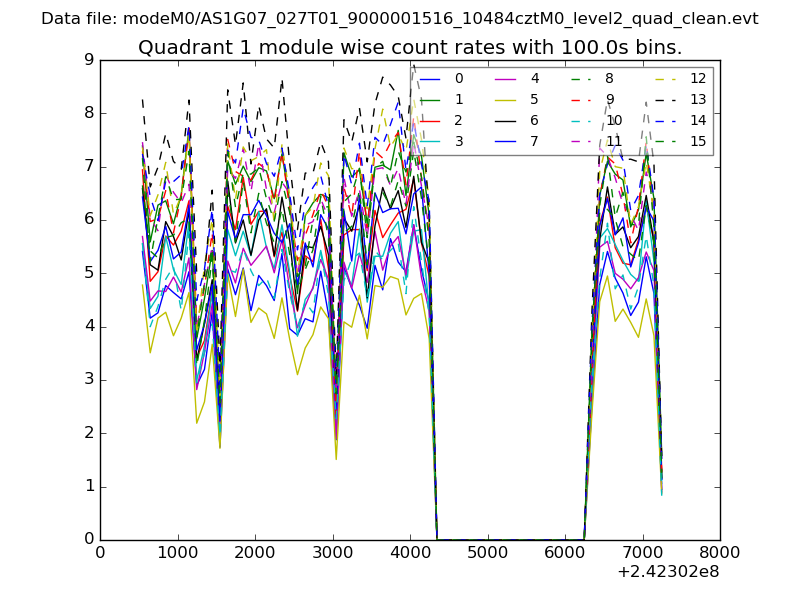
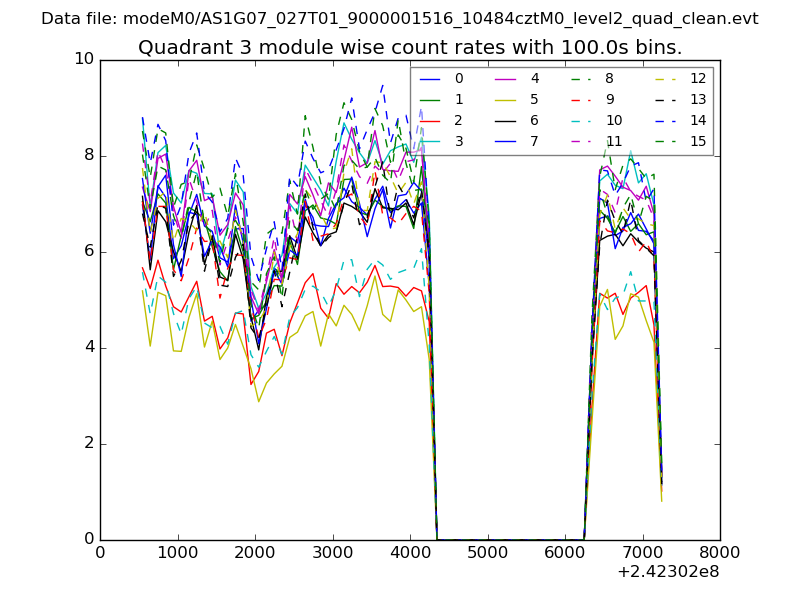
| Module-wise count rates for Quadrant A Data is divided into 100 sec bins |
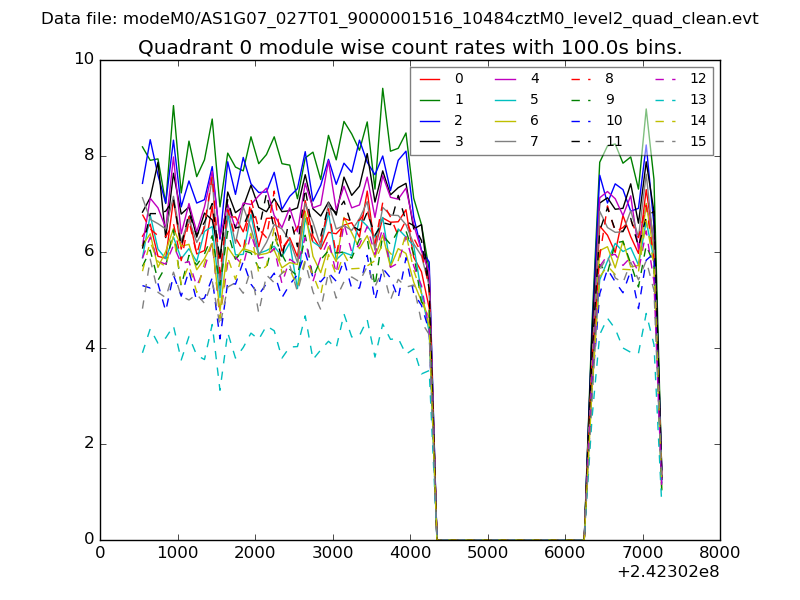 |
 |
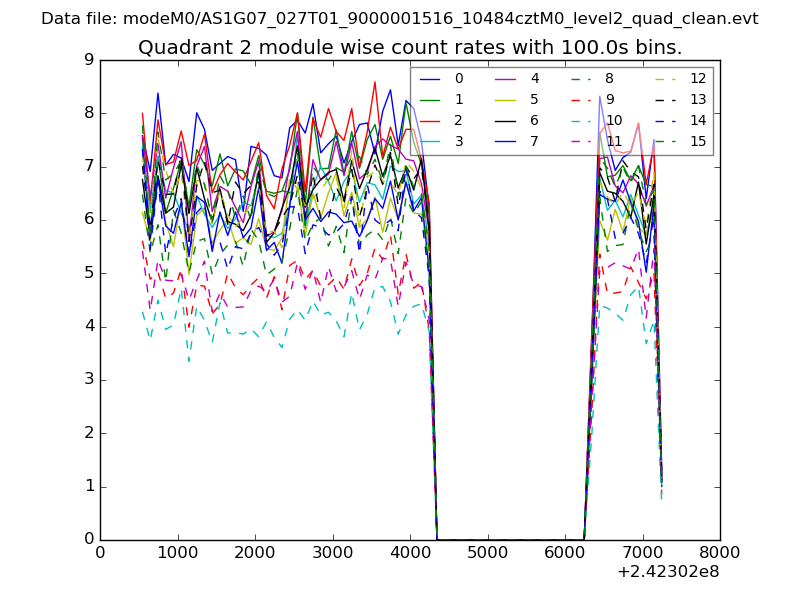
| Module-wise count rates for Quadrant B Data is divided into 100 sec bins |
 |
 |
| Module-wise count rates for Quadrant C Data is divided into 100 sec bins |
 |
 |
| Module-wise count rates for Quadrant D Data is divided into 100 sec bins |
 |
 |
| Parameter | Plot |
|---|---|
| CZT HV Monitor | 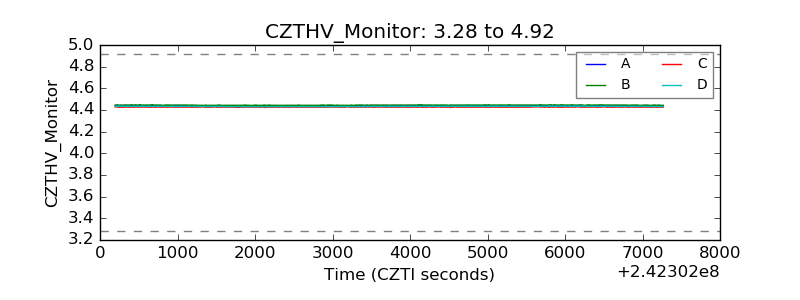 |
| D_VDD | 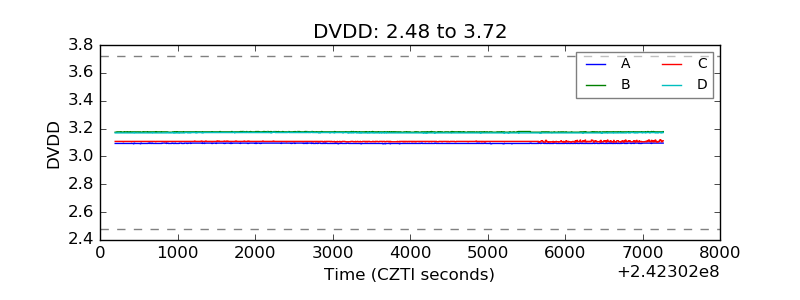 |
| Temperature 1 | 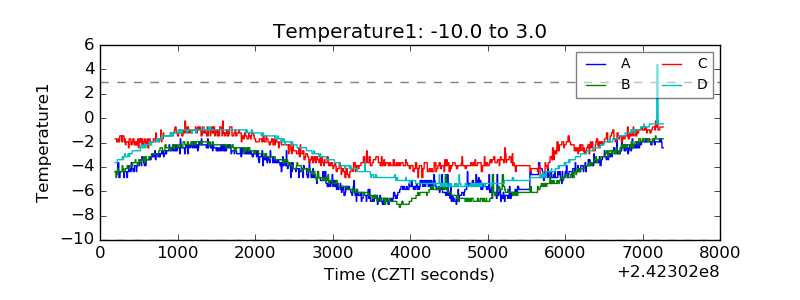 |
| Veto HV Monitor | 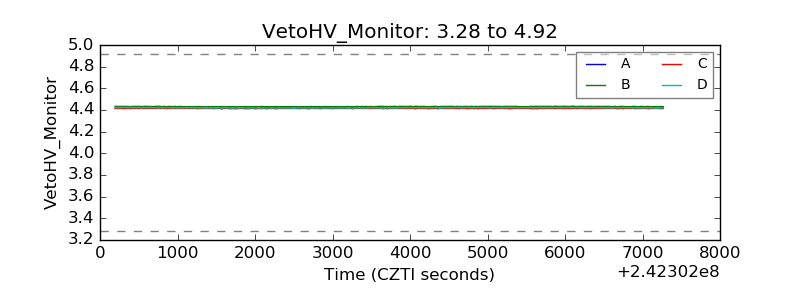 |
| Veto LLD | 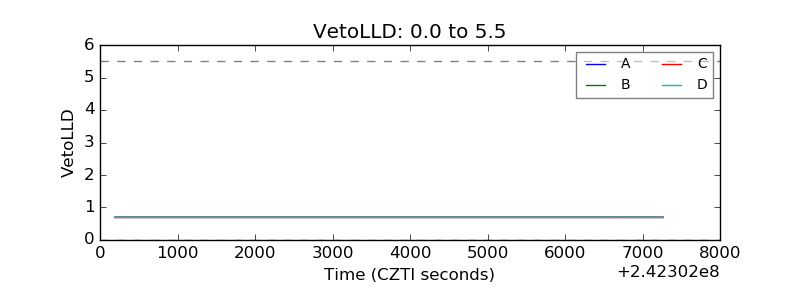 |
| Alpha Counter | 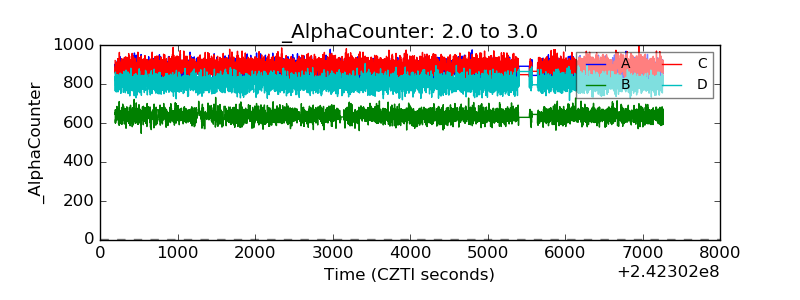 |
| _CPM_Rate | 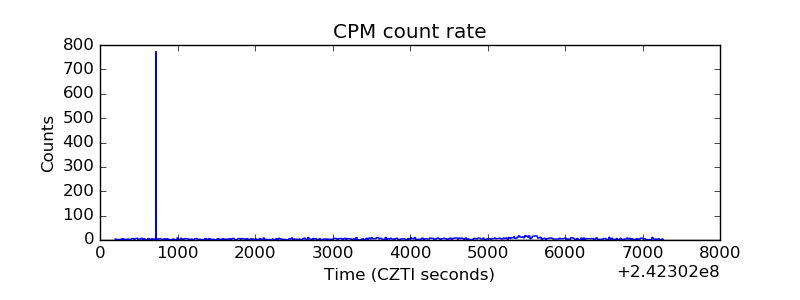 |
| CZT Counter | 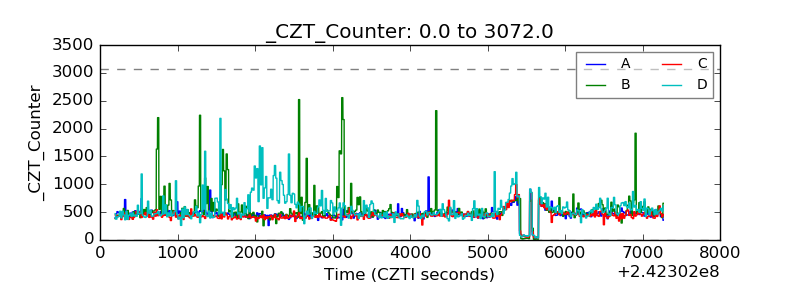 |
| +2.5 Volts monitor | 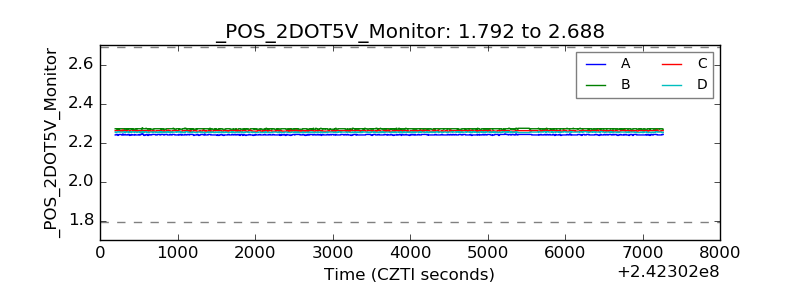 |
| +5 Volts monitor | 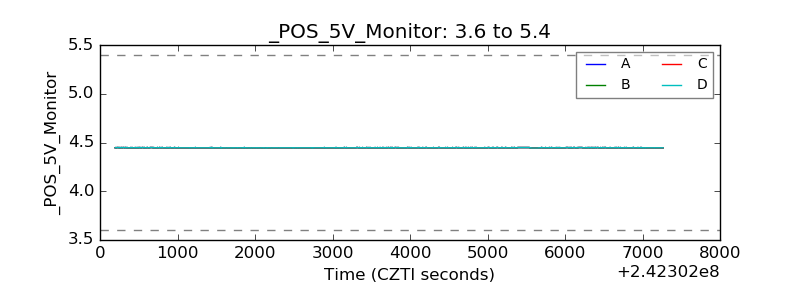 |
| _ROLL_ROT | 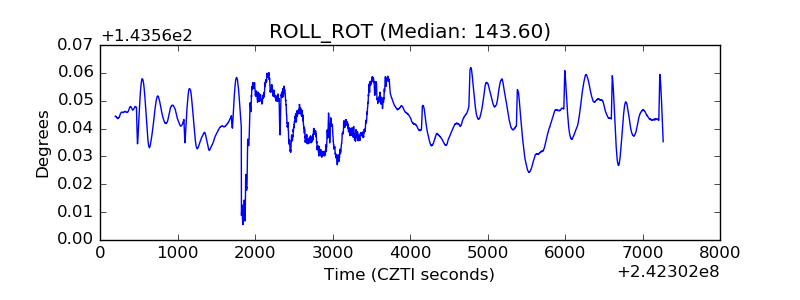 |
| _Roll_DEC | 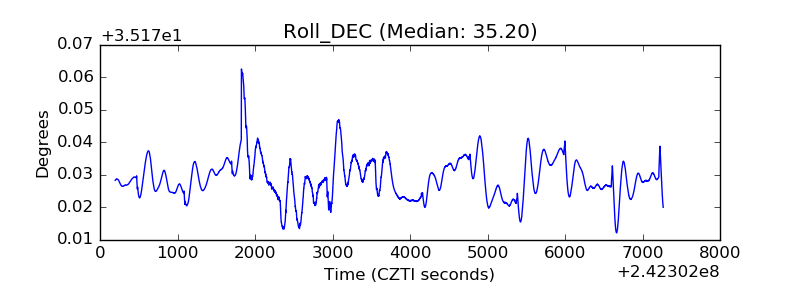 |
| _Roll_RA | 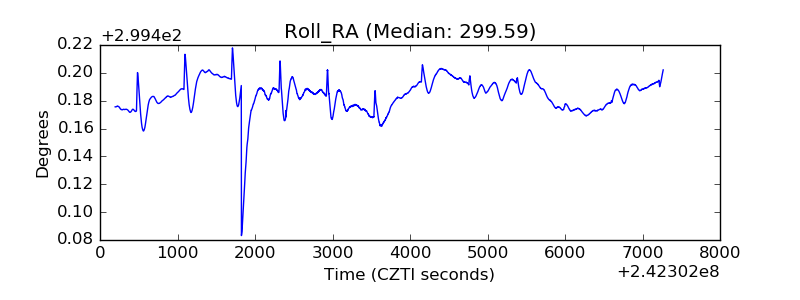 |
| Veto Counter | 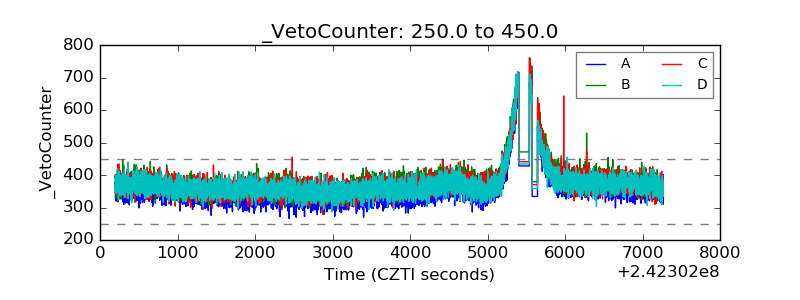 |