| Param | Original file | Final file |
|---|---|---|
| Filename | modeM0/AS1G07_027T01_9000001516_10485cztM0_level2.evt | modeM0/AS1G07_027T01_9000001516_10485cztM0_level2_quad_clean.evt |
| Size (bytes) | 339,707,520 | 70,922,880 |
| Size | 324.0 MB | 67.6 MB |
| Events in quadrant A | 2,588,522 | 468,833 |
| Events in quadrant B | 2,306,639 | 430,145 |
| Events in quadrant C | 2,556,724 | 517,047 |
| Events in quadrant D | 2,479,494 | 366,103 |
| Mode SS | |||
|---|---|---|---|
| Quadrant | BADHDUFLAG | Total packets | Discarded packets |
| A | 0 | 290 | 159 |
| B | 0 | 290 | 156 |
| C | 0 | 290 | 158 |
| D | 0 | 276 | 144 |
| Mode M9 | |||
|---|---|---|---|
| Quadrant | BADHDUFLAG | Total packets | Discarded packets |
| A | 0 | 7 | 3 |
| B | 0 | 8 | 4 |
| C | 0 | 8 | 4 |
| D | 0 | 7 | 3 |
| Mode M0 | |||
|---|---|---|---|
| Quadrant | BADHDUFLAG | Total packets | Discarded packets |
| A | 0 | 29201 | 18670 |
| B | 0 | 33240 | 23461 |
| C | 0 | 28980 | 17412 |
| D | 0 | 34892 | 25186 |
| Quadrant | Total seconds | Saturated seconds | Saturation percentage |
|---|---|---|---|
| A | 5265 | 3 | 0.056980% |
| B | 4890 | 3 | 0.061350% |
| C | 5786 | 2 | 0.034566% |
| D | 4670 | 9 | 0.192719% |
Noise dominated data is calculated using 1-second bins in cleaned event files. If a bin has >2000 counts, and if more than 50% of those come from <1% of pixels, then it is considered to be noise-dominated and hence unusable.
| Quadrant | # 1 sec bins | Bins with >0 counts | Bins with >2000 counts | High rate bins dominated by noise | Noise dominated (total time) | Noise dominated (detector-on time) | Marked lightcurve |
|---|---|---|---|---|---|---|---|
| A | 7533 | 6316 | 0 | 0 | 0.00% | 0.00% | 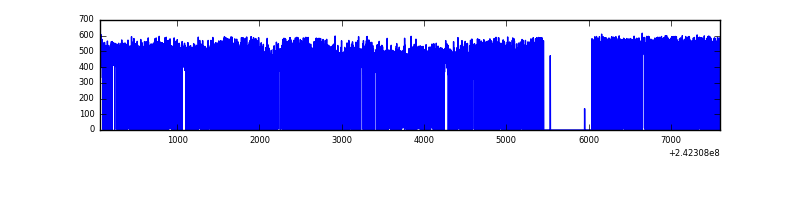 |
| B | 7533 | 5885 | 0 | 0 | 0.00% | 0.00% | 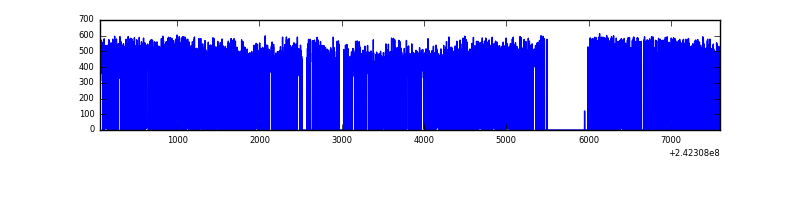 |
| C | 7533 | 6627 | 0 | 0 | 0.00% | 0.00% | 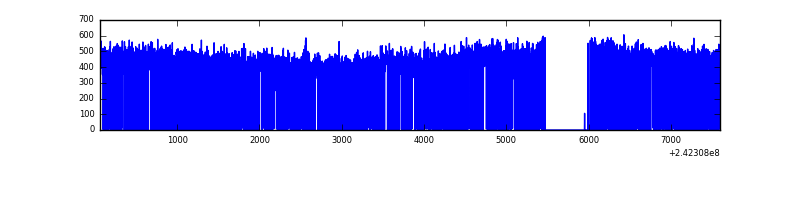 |
| D | 7530 | 5517 | 0 | 0 | 0.00% | 0.00% | 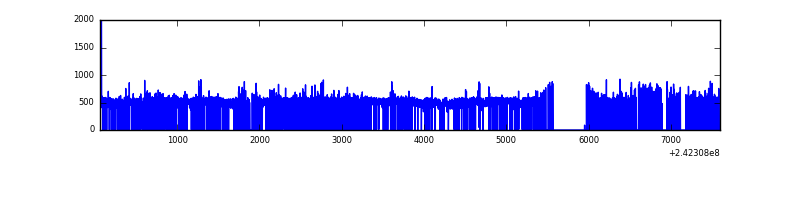 |
Top three noisy pixels from each quadrant. If the there are fewer than three noisy pixels in the level2.evt file, extra rows are filled as -1
| Pixel properties | Quadrant properties | ||||||
|---|---|---|---|---|---|---|---|
| Quadrant | DetID | PixID | Counts | Sigma | Mean | Median | Sigma |
| A | 15 | 239 | 165278 | 1328.88 | 603 | 590 | 123.9 |
| A | 3 | 80 | 77362 | 619.48 | 603 | 590 | 123.9 |
| A | 5 | 16 | 7748 | 57.76 | 603 | 590 | 123.9 |
| B | 0 | 214 | 44999 | 406.8 | 563 | 549 | 109.3 |
| B | 4 | 239 | 34182 | 307.8 | 563 | 549 | 109.3 |
| B | 0 | 219 | 14938 | 131.68 | 563 | 549 | 109.3 |
| C | 8 | 128 | 8585 | 52.04 | 651 | 654 | 152.4 |
| C | 8 | 112 | 4929 | 28.05 | 651 | 654 | 152.4 |
| C | 13 | 61 | 4776 | 27.05 | 651 | 654 | 152.4 |
| D | 8 | 195 | 379756 | 3050.51 | 511 | 498 | 124.3 |
| D | 1 | 20 | 71954 | 574.75 | 511 | 498 | 124.3 |
| D | 1 | 52 | 71278 | 569.31 | 511 | 498 | 124.3 |
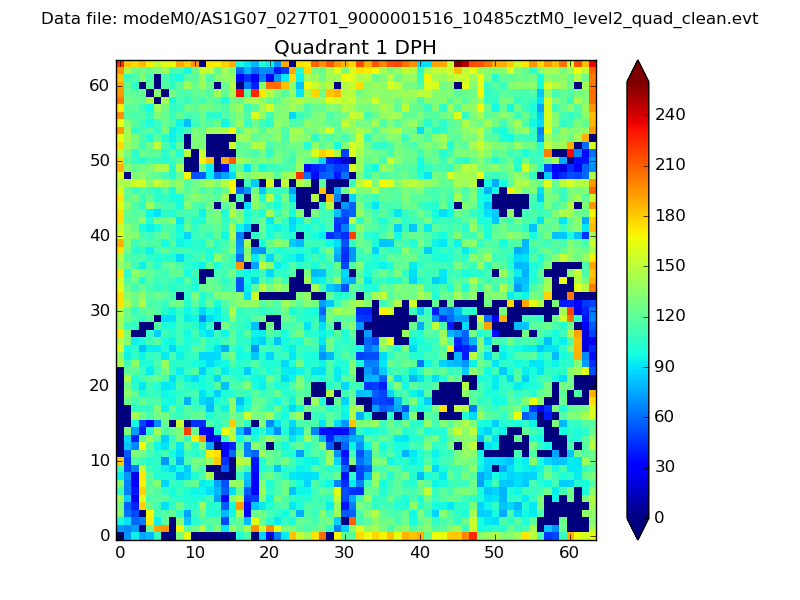
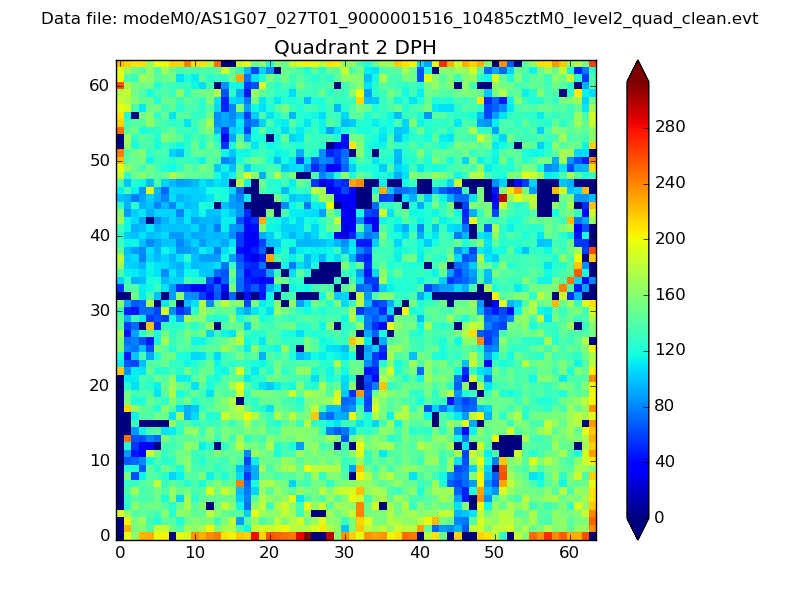
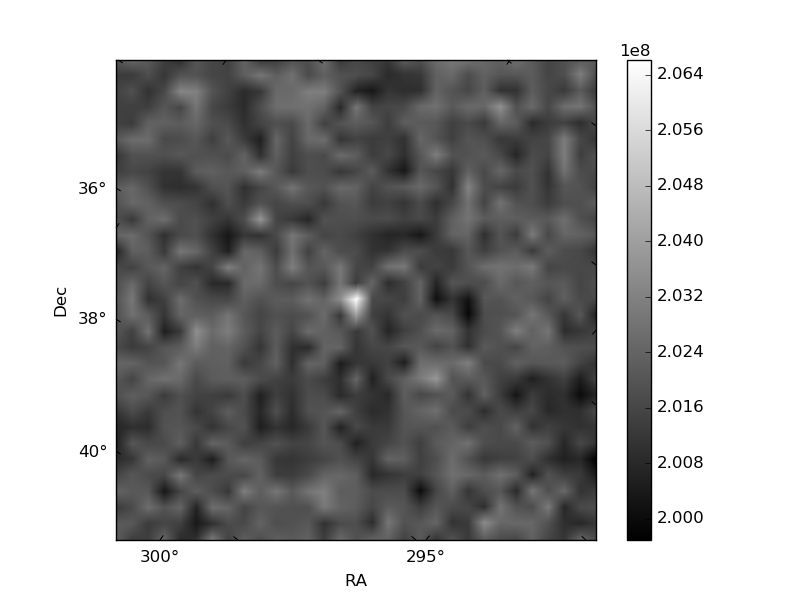
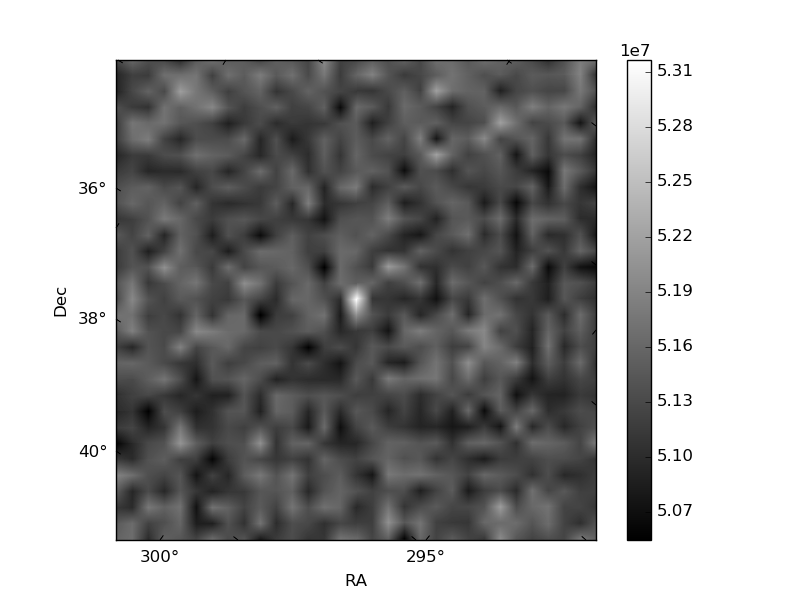
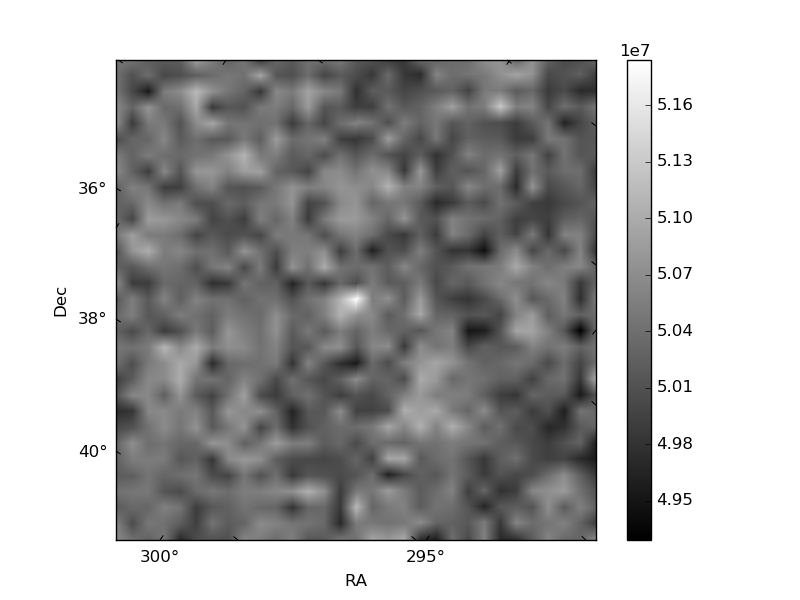
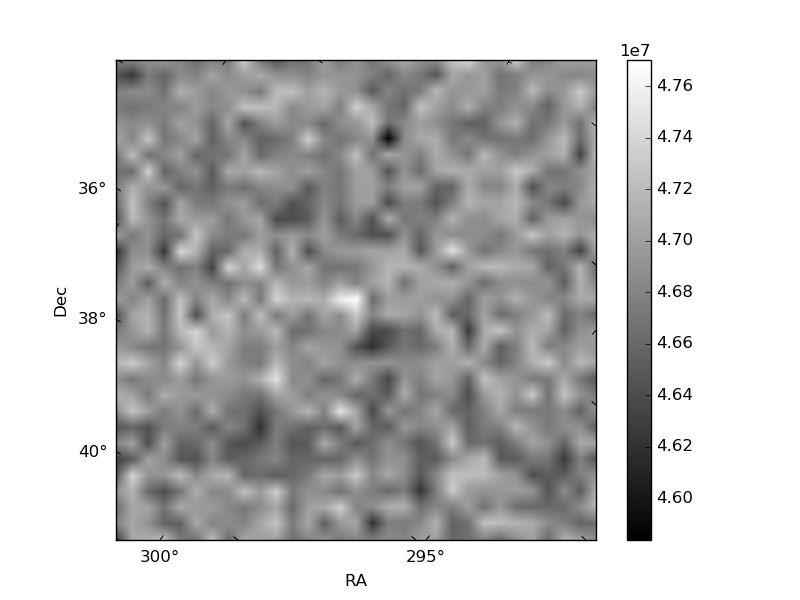
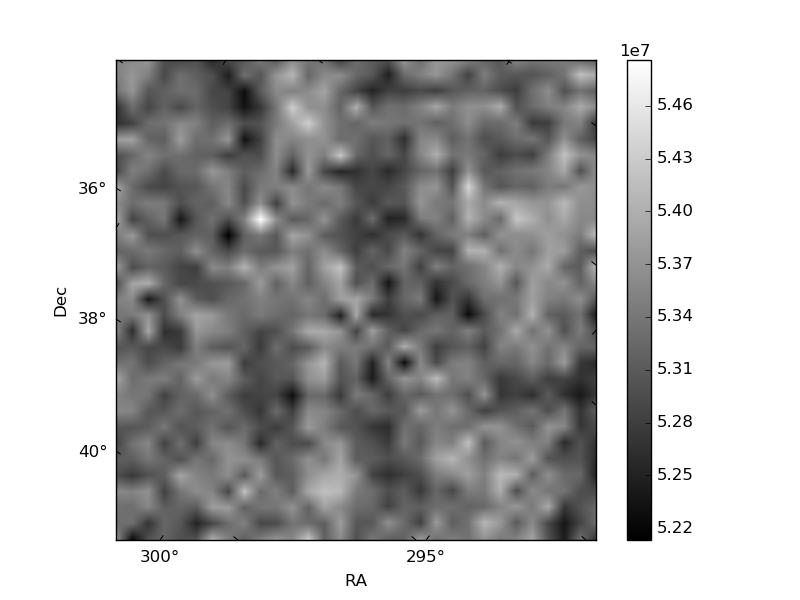
Histogram calculated using DETX and DETY for each event in the final _common_clean file
| Quadrant A |  |
 |
Quadrant B |
|---|---|---|---|
| Quadrant D | 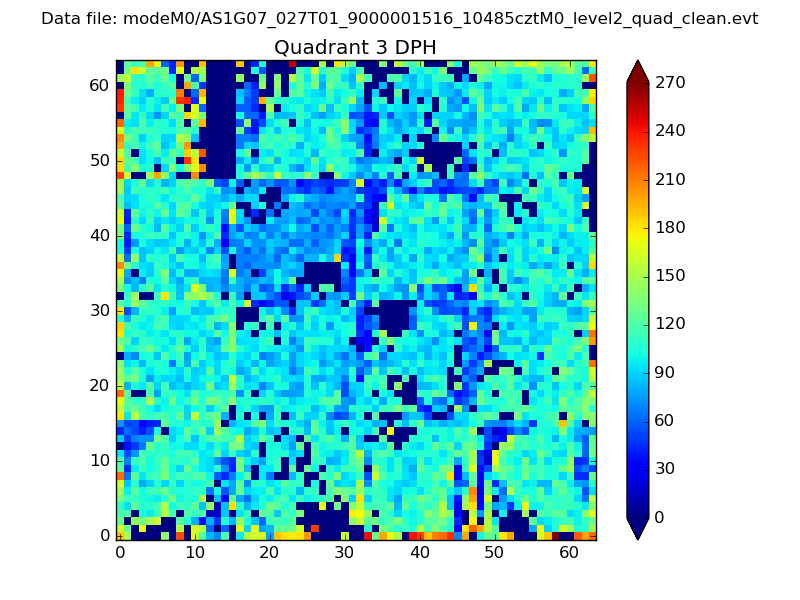 |
 |
Quadrant C |
| Plot type | Count rate plots | Images |
|---|---|---|
| Comparison with Poisson distribution Blue bars denote a histogram of data divided into 1 sec bins. Red curve is a Poisson curve with rate = median count rate of data. |
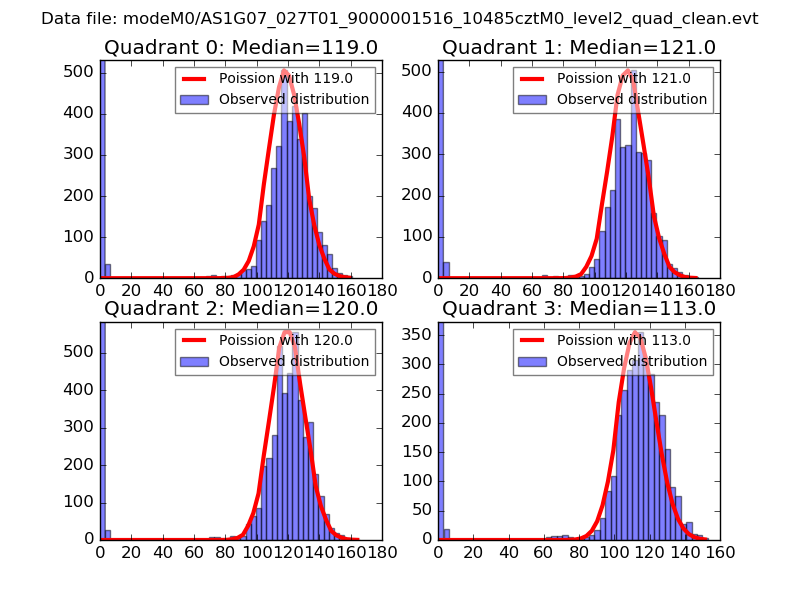 |
 |
| Quadrant-wise count rates Data is divided into 100 sec bins |
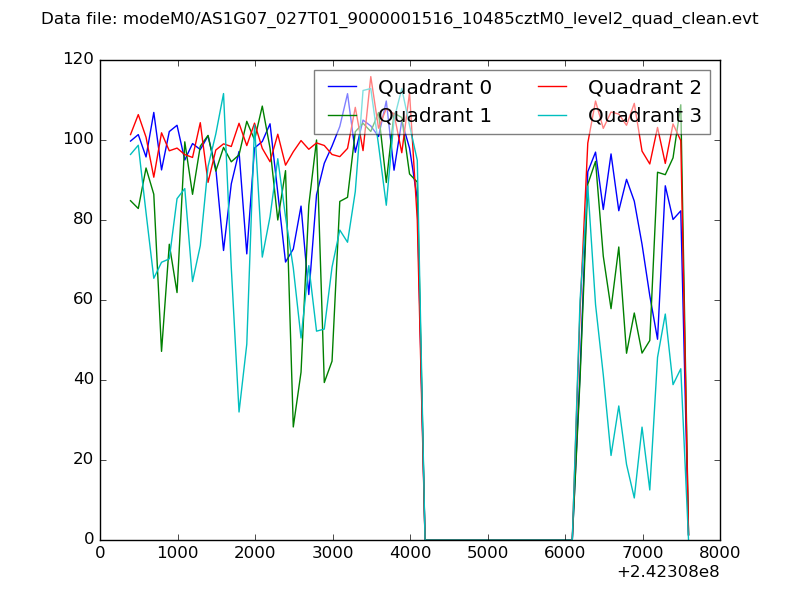 |
|
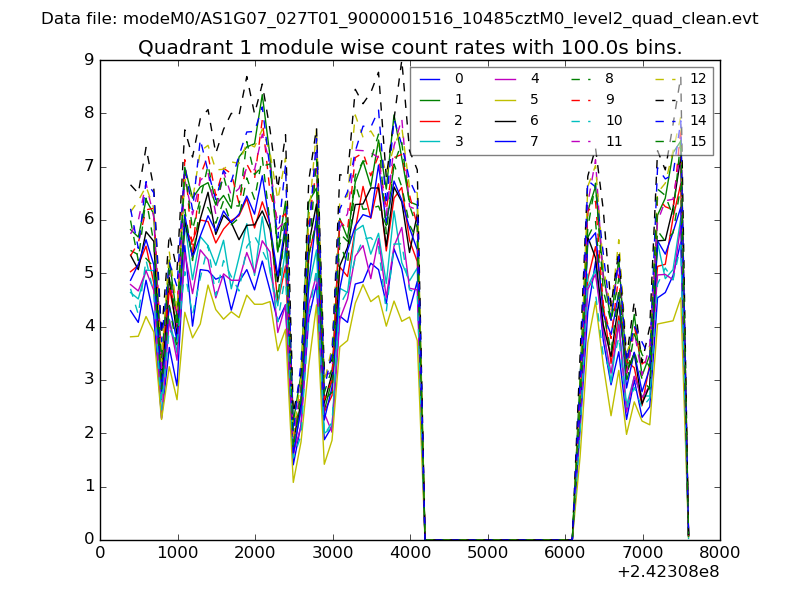
| Module-wise count rates for Quadrant A Data is divided into 100 sec bins |
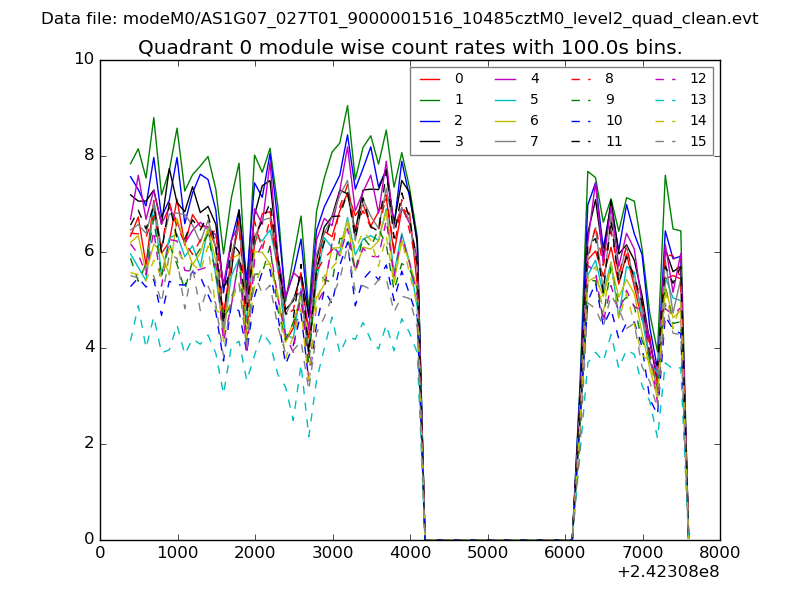 |
 |
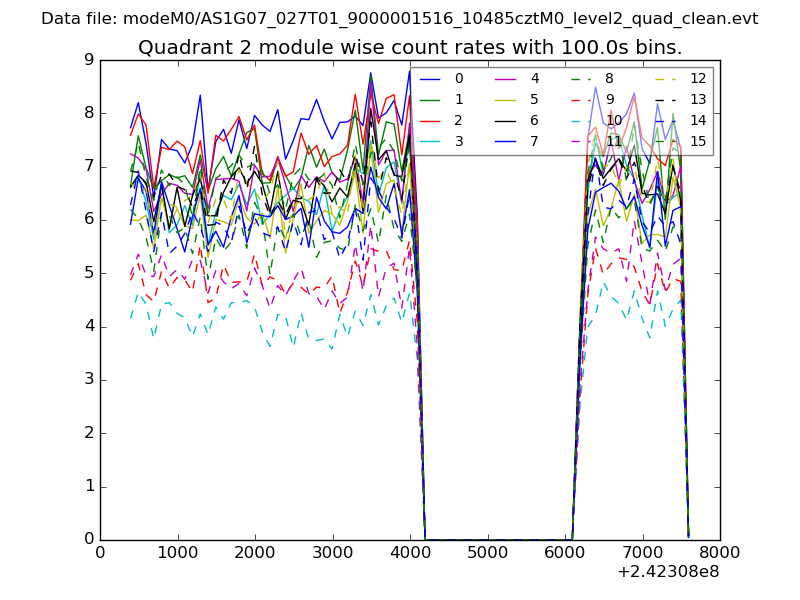
| Module-wise count rates for Quadrant B Data is divided into 100 sec bins |
 |
 |
| Module-wise count rates for Quadrant C Data is divided into 100 sec bins |
 |
 |
| Module-wise count rates for Quadrant D Data is divided into 100 sec bins |
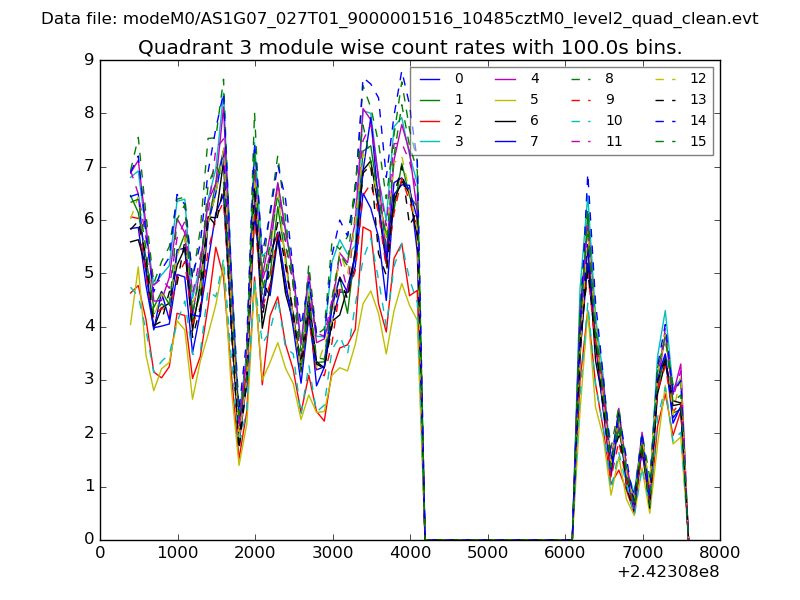 |
 |
| Parameter | Plot |
|---|---|
| CZT HV Monitor | 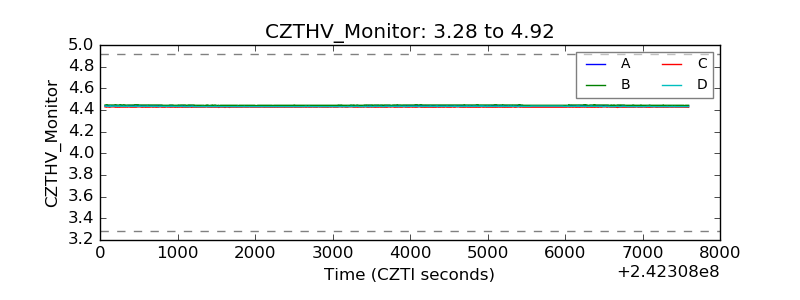 |
| D_VDD | 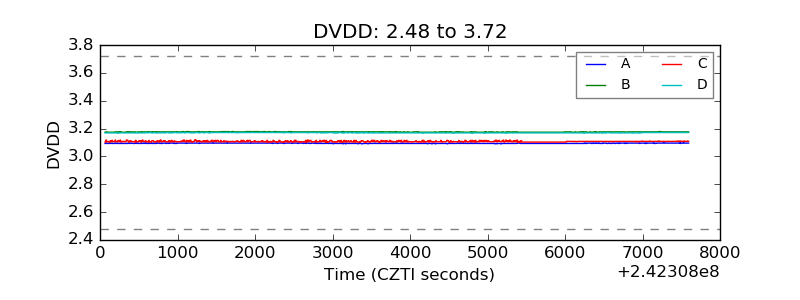 |
| Temperature 1 | 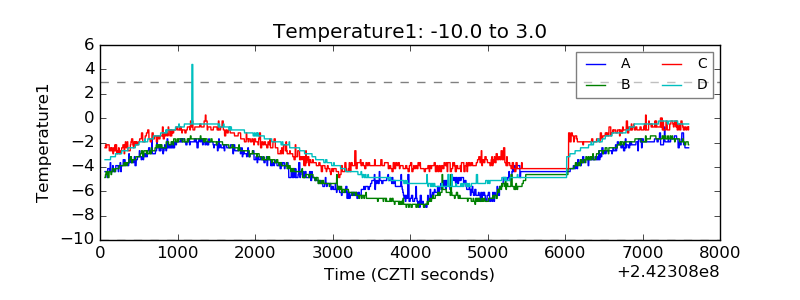 |
| Veto HV Monitor | 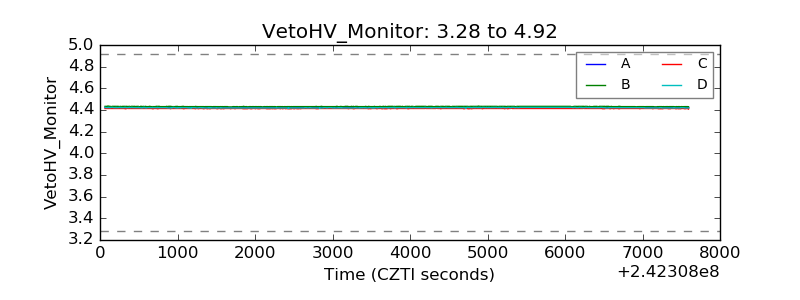 |
| Veto LLD | 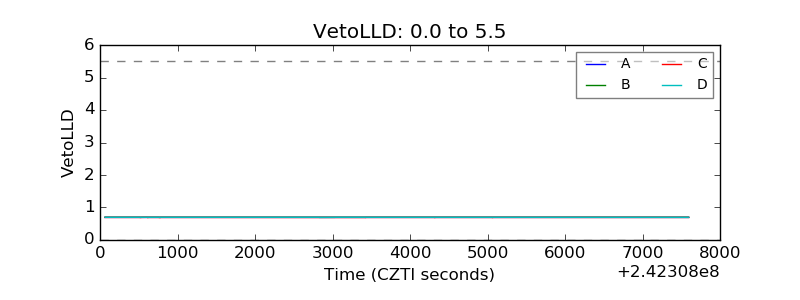 |
| Alpha Counter | 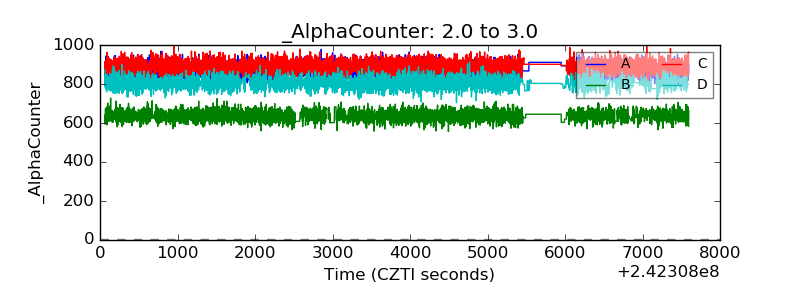 |
| _CPM_Rate | 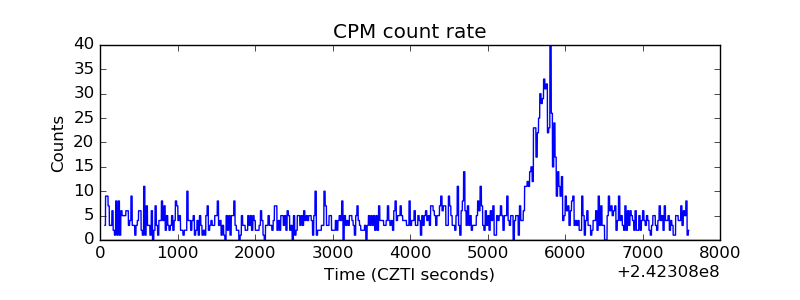 |
| CZT Counter | 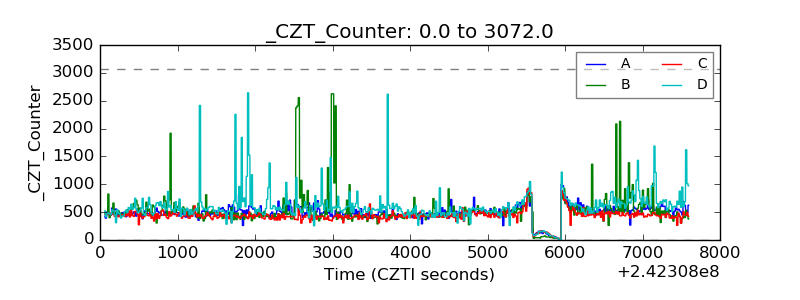 |
| +2.5 Volts monitor |  |
| +5 Volts monitor |  |
| _ROLL_ROT |  |
| _Roll_DEC | 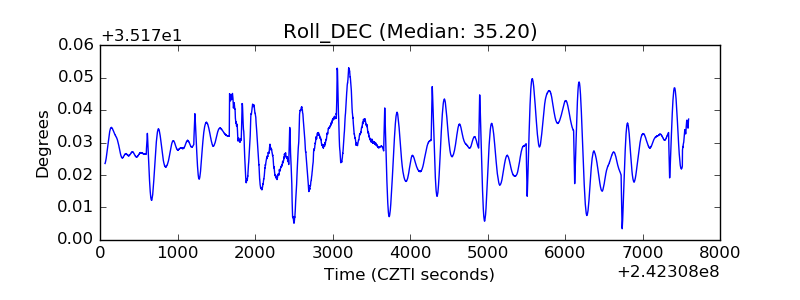 |
| _Roll_RA | 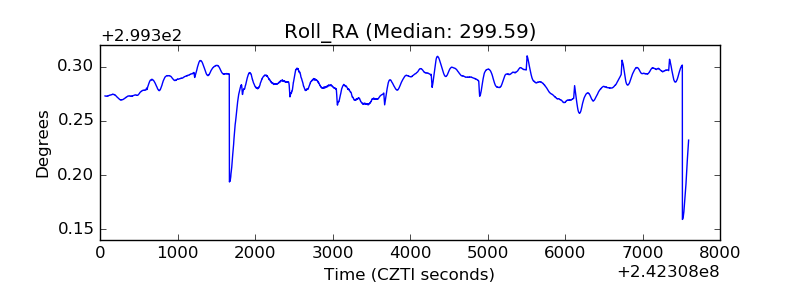 |
| Veto Counter | 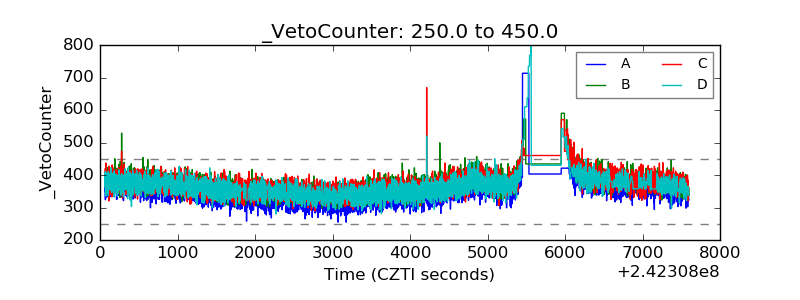 |