| Param | Original file | Final file |
|---|---|---|
| Filename | modeM0/AS1G07_027T01_9000001516_10492cztM0_level2.evt | modeM0/AS1G07_027T01_9000001516_10492cztM0_level2_quad_clean.evt |
| Size (bytes) | 170,000,640 | 38,168,640 |
| Size | 162.1 MB | 36.4 MB |
| Events in quadrant A | 1,192,320 | 252,930 |
| Events in quadrant B | 1,233,926 | 252,001 |
| Events in quadrant C | 883,793 | 253,792 |
| Events in quadrant D | 1,688,799 | 239,591 |
| Mode SS | |||
|---|---|---|---|
| Quadrant | BADHDUFLAG | Total packets | Discarded packets |
| A | 0 | 44 | 0 |
| B | 0 | 44 | 0 |
| C | 0 | 44 | 0 |
| D | 0 | 44 | 0 |
| Mode M0 | |||
|---|---|---|---|
| Quadrant | BADHDUFLAG | Total packets | Discarded packets |
| A | 0 | 5003 | 2 |
| B | 0 | 5225 | 2 |
| C | 0 | 4349 | 0 |
| D | 0 | 6503 | 3 |
| Quadrant | Total seconds | Saturated seconds | Saturation percentage |
|---|---|---|---|
| A | 2168 | 7 | 0.322878% |
| B | 2168 | 71 | 3.274908% |
| C | 2169 | 1 | 0.046104% |
| D | 2168 | 40 | 1.845018% |
Noise dominated data is calculated using 1-second bins in cleaned event files. If a bin has >2000 counts, and if more than 50% of those come from <1% of pixels, then it is considered to be noise-dominated and hence unusable.
| Quadrant | # 1 sec bins | Bins with >0 counts | Bins with >2000 counts | High rate bins dominated by noise | Noise dominated (total time) | Noise dominated (detector-on time) | Marked lightcurve |
|---|---|---|---|---|---|---|---|
| A | 2169 | 2169 | 7 | 7 | 0.32% | 0.32% | 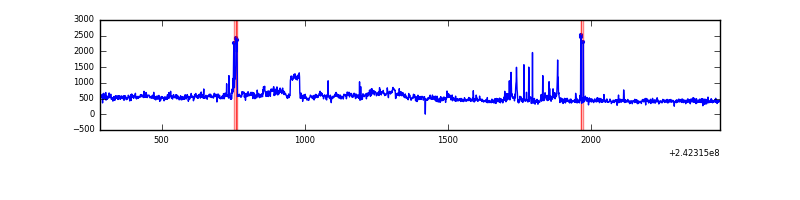 |
| B | 2169 | 2169 | 71 | 71 | 3.27% | 3.27% | 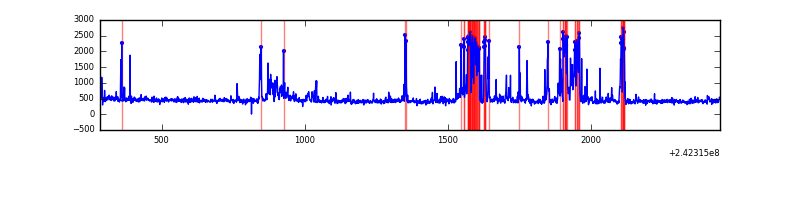 |
| C | 2169 | 2169 | 1 | 1 | 0.05% | 0.05% | 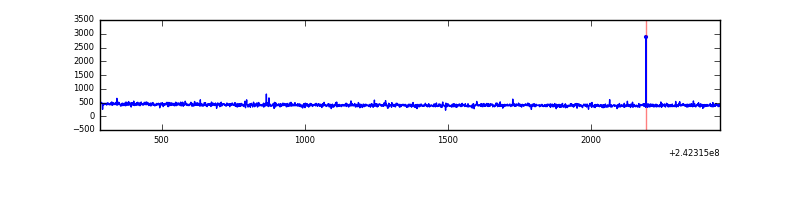 |
| D | 2169 | 2169 | 42 | 42 | 1.94% | 1.94% | 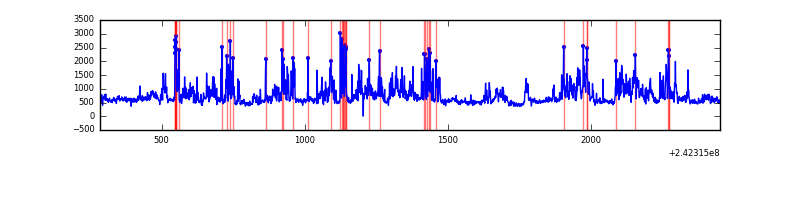 |
Top three noisy pixels from each quadrant. If the there are fewer than three noisy pixels in the level2.evt file, extra rows are filled as -1
| Pixel properties | Quadrant properties | ||||||
|---|---|---|---|---|---|---|---|
| Quadrant | DetID | PixID | Counts | Sigma | Mean | Median | Sigma |
| A | 15 | 239 | 189550 | 3901.18 | 227 | 222 | 48.5 |
| A | 5 | 16 | 44783 | 918.2 | 227 | 222 | 48.5 |
| A | 3 | 80 | 43458 | 890.89 | 227 | 222 | 48.5 |
| B | 4 | 239 | 280086 | 6222.44 | 226 | 221 | 45.0 |
| B | 10 | 245 | 55028 | 1218.56 | 226 | 221 | 45.0 |
| B | 0 | 197 | 7653 | 165.24 | 226 | 221 | 45.0 |
| C | 14 | 234 | 4313 | 76.08 | 225 | 227 | 53.7 |
| C | 13 | 61 | 1693 | 27.3 | 225 | 227 | 53.7 |
| C | 14 | 238 | 889 | 12.33 | 225 | 227 | 53.7 |
| D | 1 | 52 | 260834 | 4676.72 | 223 | 216 | 55.7 |
| D | 1 | 20 | 253285 | 4541.25 | 223 | 216 | 55.7 |
| D | 8 | 195 | 252741 | 4531.49 | 223 | 216 | 55.7 |
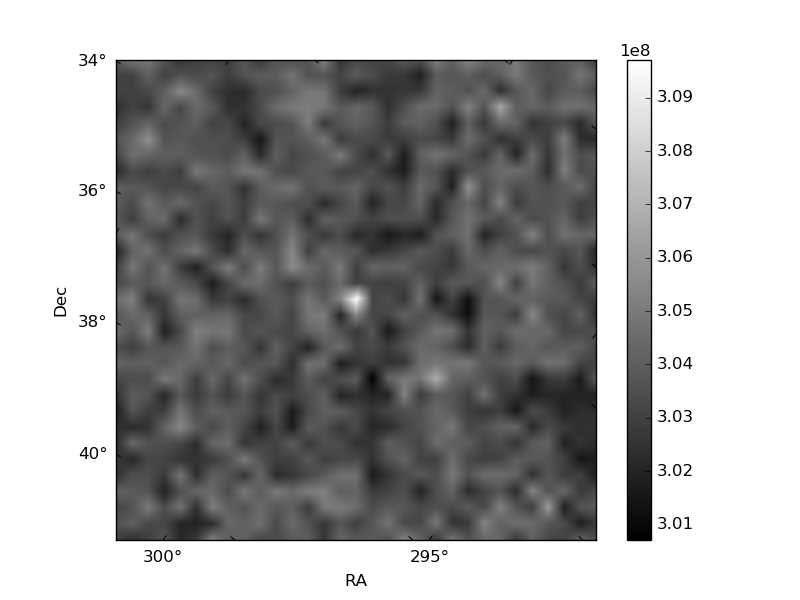
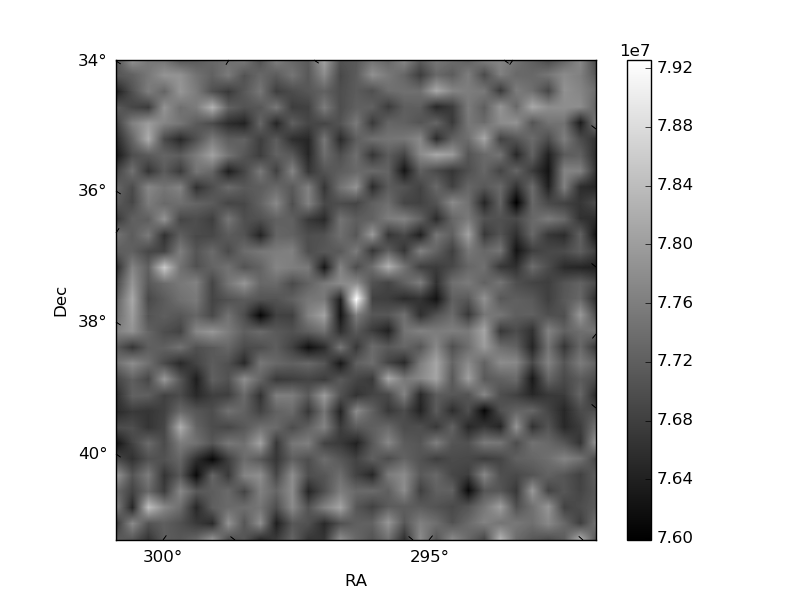
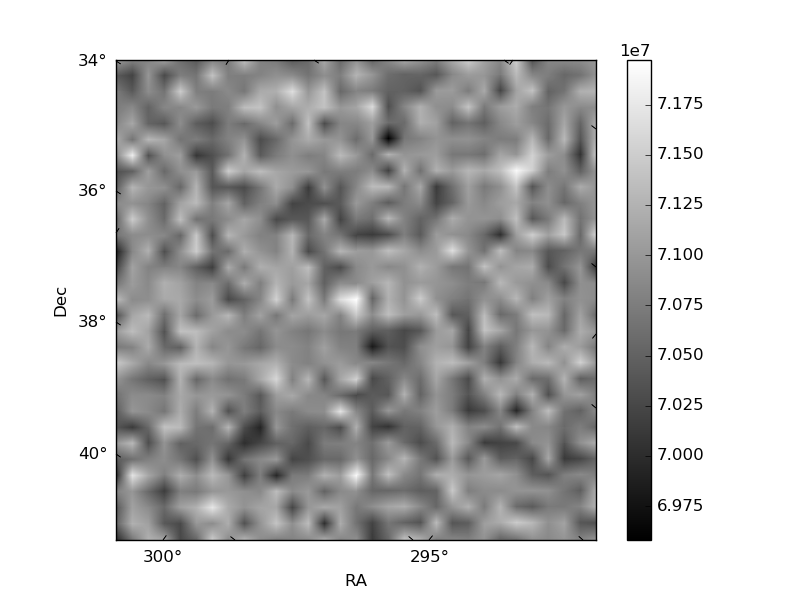
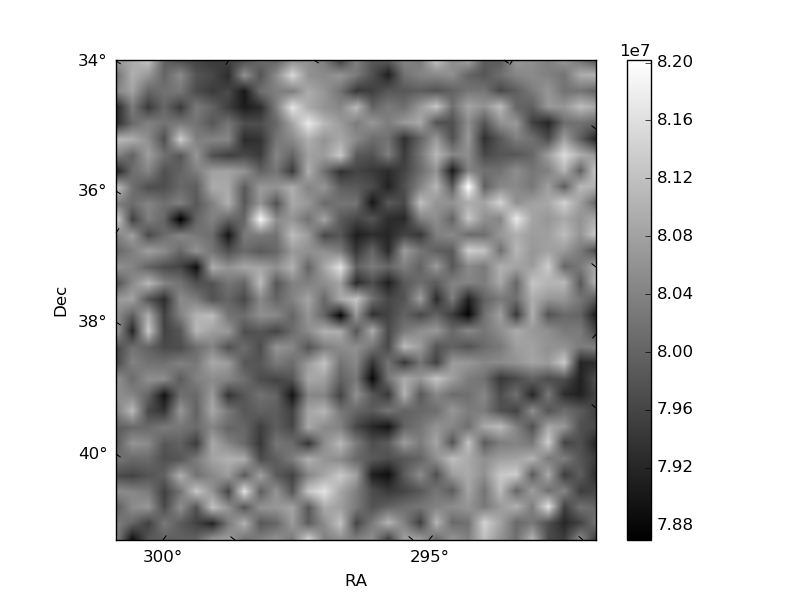
Histogram calculated using DETX and DETY for each event in the final _common_clean file
| Quadrant A | 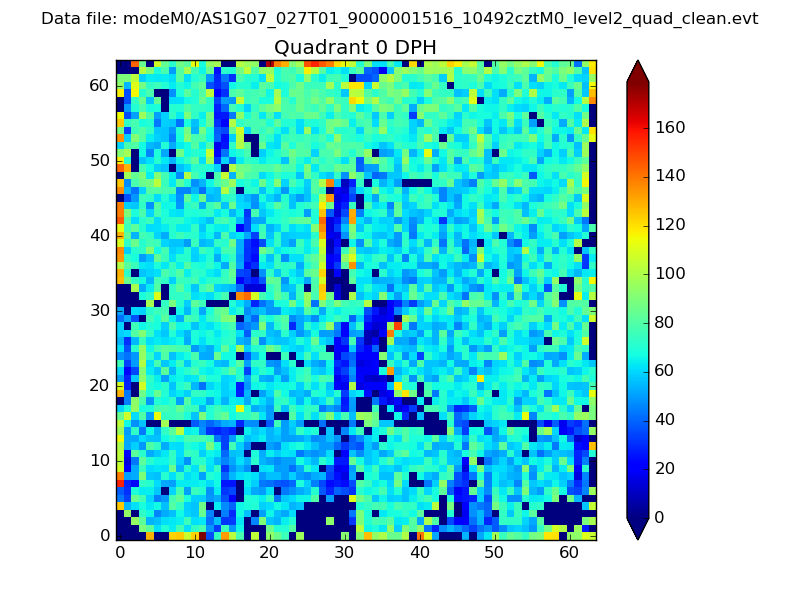 |
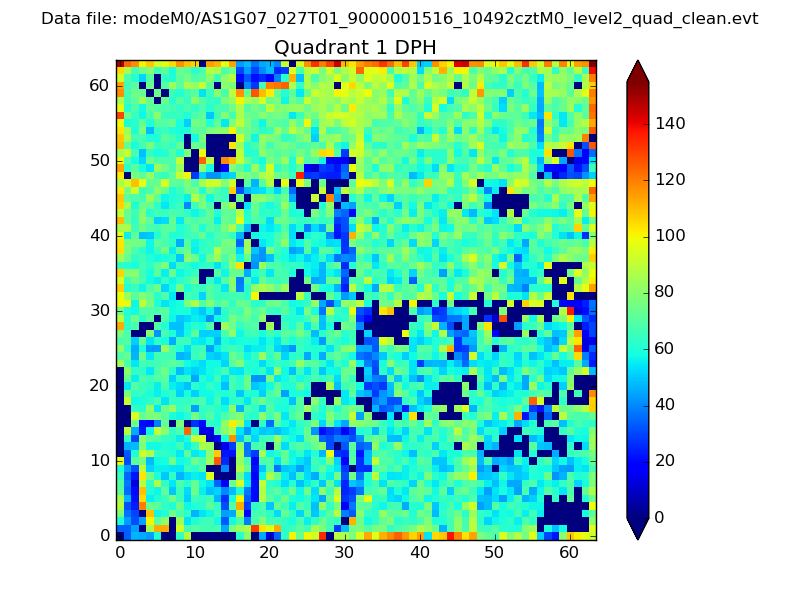 |
Quadrant B |
|---|---|---|---|
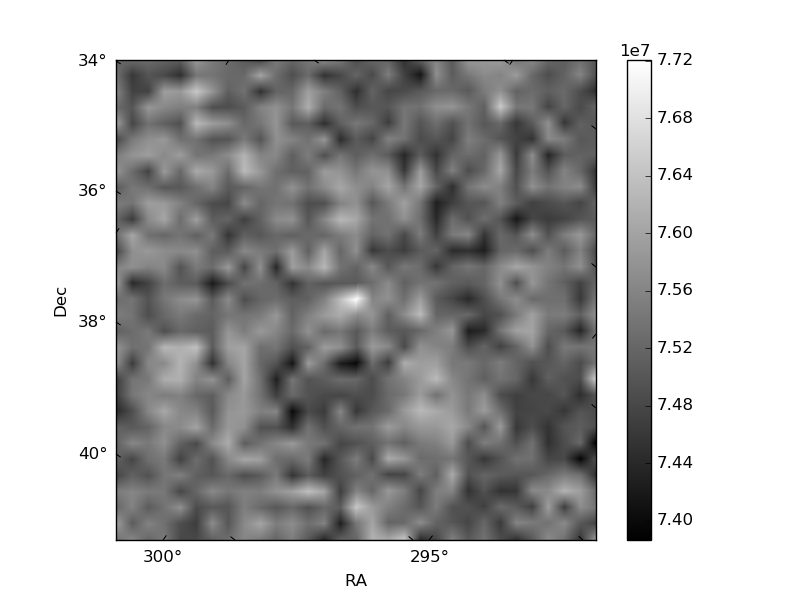
| Quadrant D | 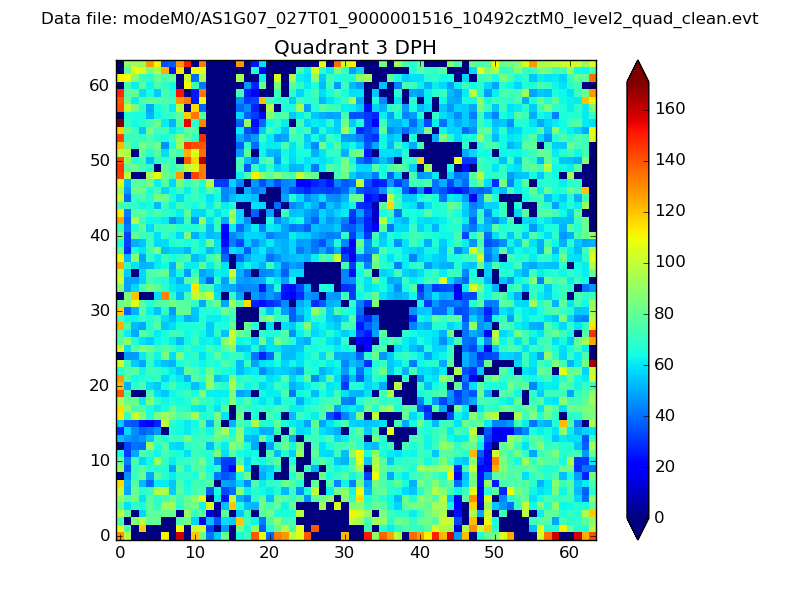 |
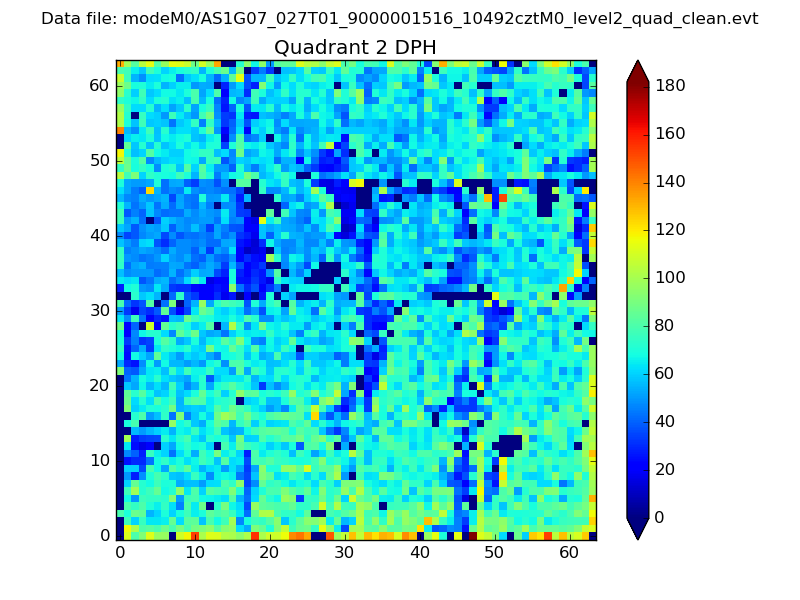 |
Quadrant C |
| Plot type | Count rate plots | Images |
|---|---|---|
| Comparison with Poisson distribution Blue bars denote a histogram of data divided into 1 sec bins. Red curve is a Poisson curve with rate = median count rate of data. |
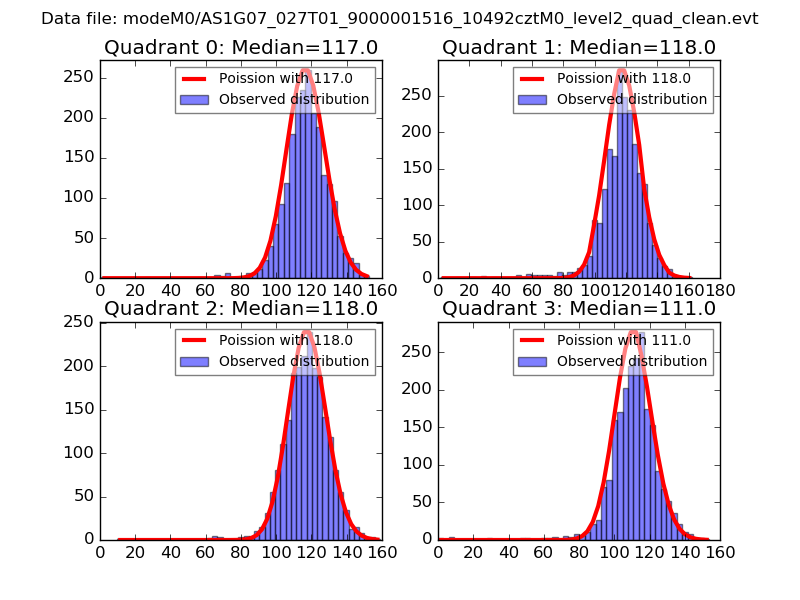 |
 |
| Quadrant-wise count rates Data is divided into 100 sec bins |
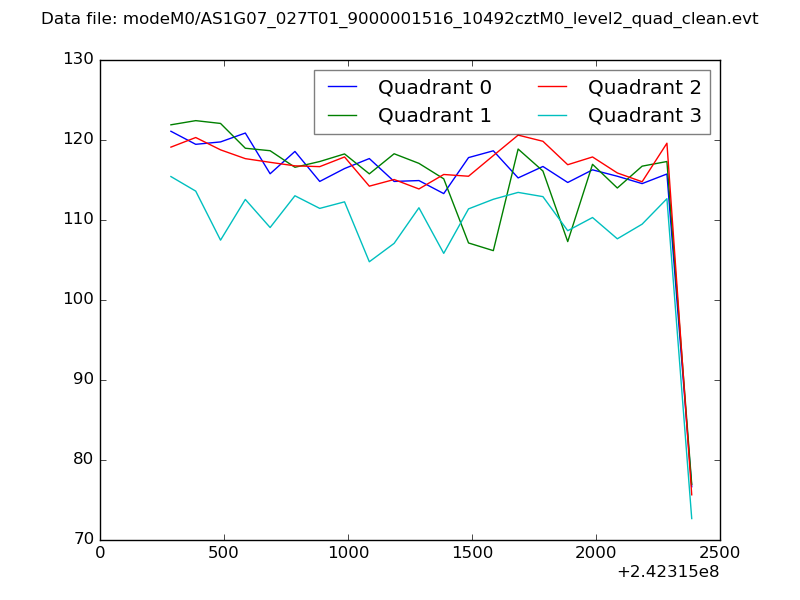 |
|
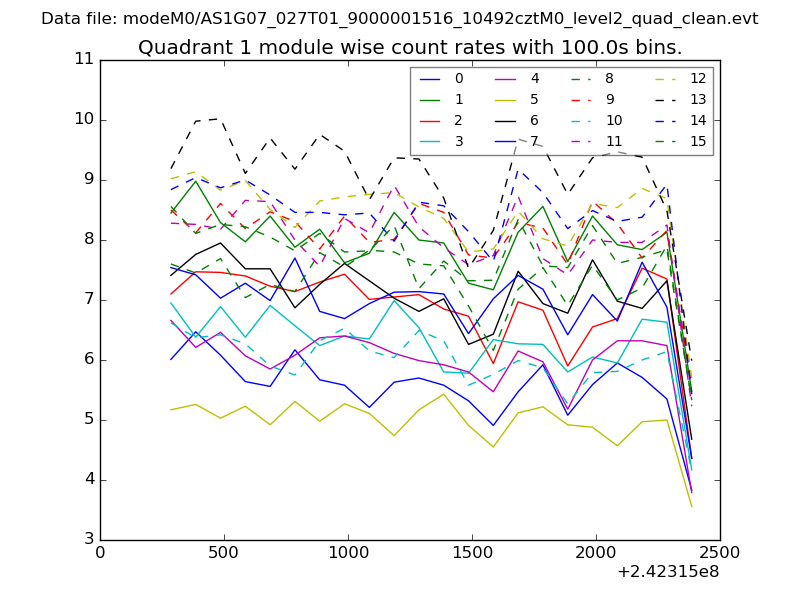
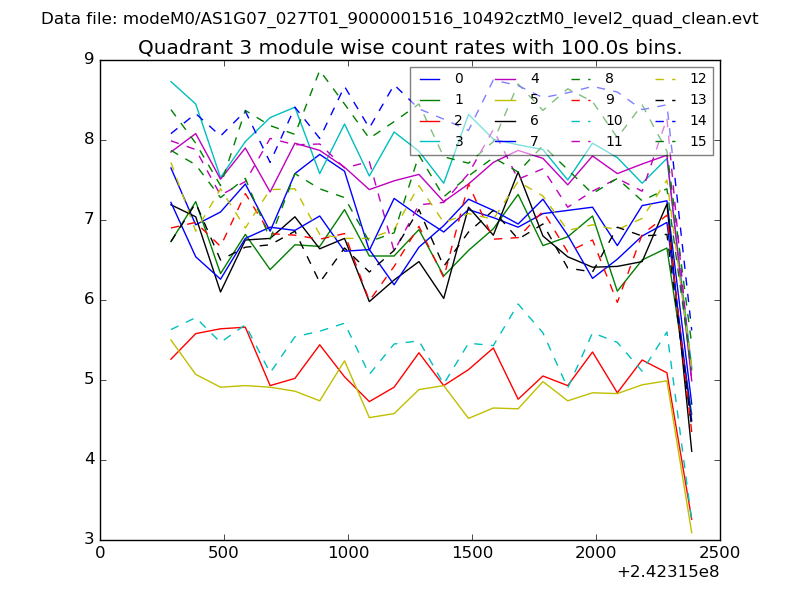
| Module-wise count rates for Quadrant A Data is divided into 100 sec bins |
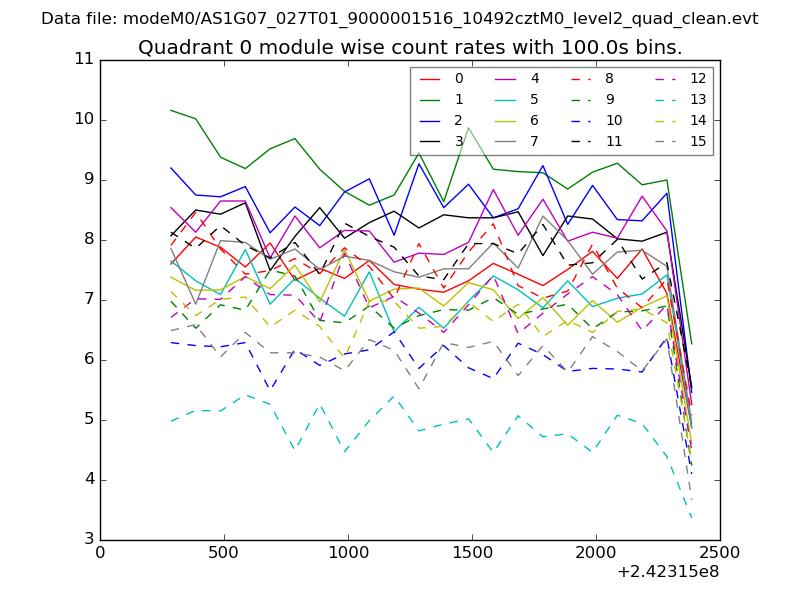 |
 |
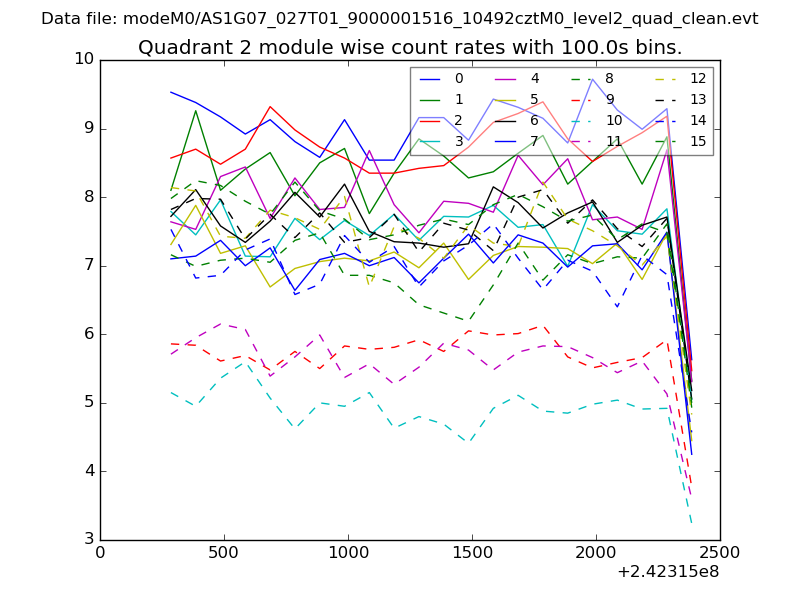
| Module-wise count rates for Quadrant B Data is divided into 100 sec bins |
 |
 |
| Module-wise count rates for Quadrant C Data is divided into 100 sec bins |
 |
 |
| Module-wise count rates for Quadrant D Data is divided into 100 sec bins |
 |
 |
| Parameter | Plot |
|---|---|
| CZT HV Monitor | 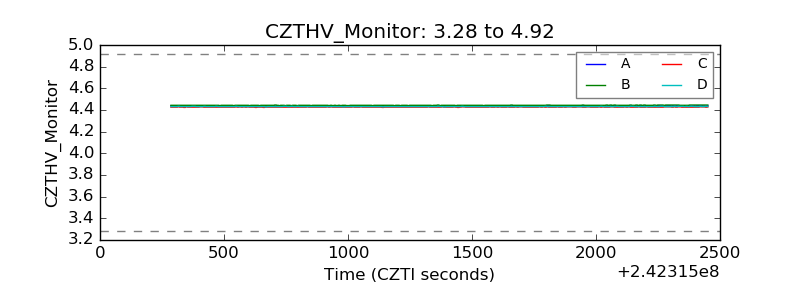 |
| D_VDD | 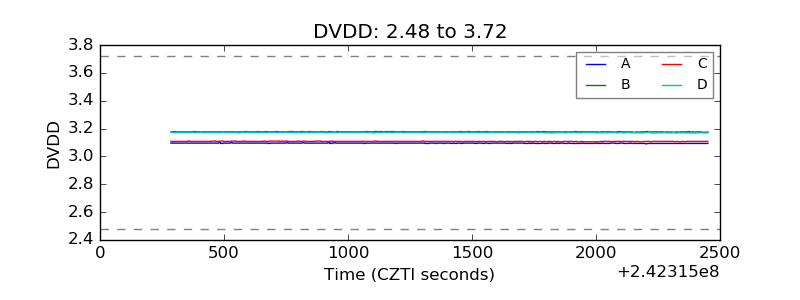 |
| Temperature 1 | 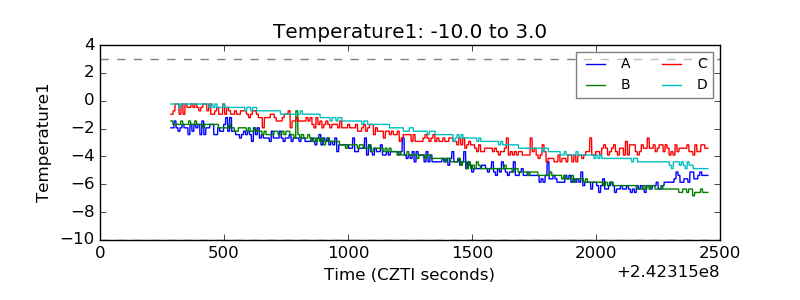 |
| Veto HV Monitor | 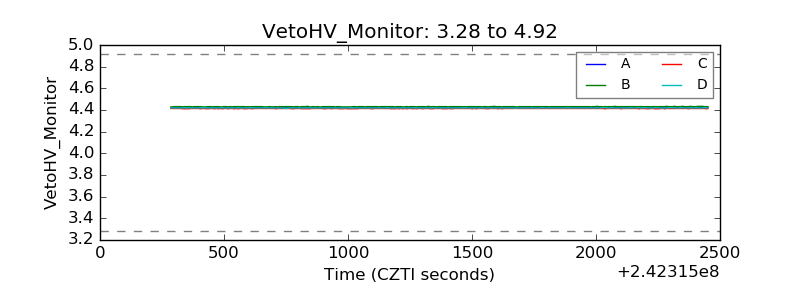 |
| Veto LLD |  |
| Alpha Counter | 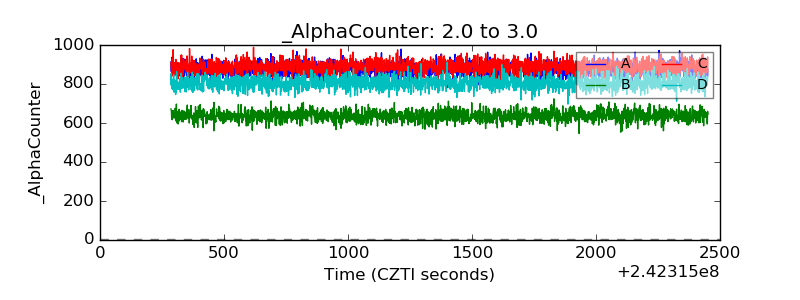 |
| _CPM_Rate | 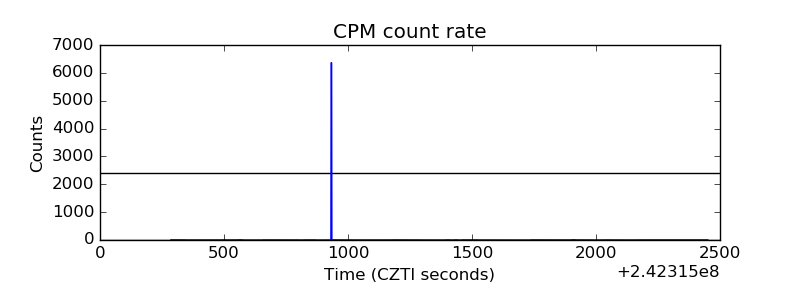 |
| CZT Counter | 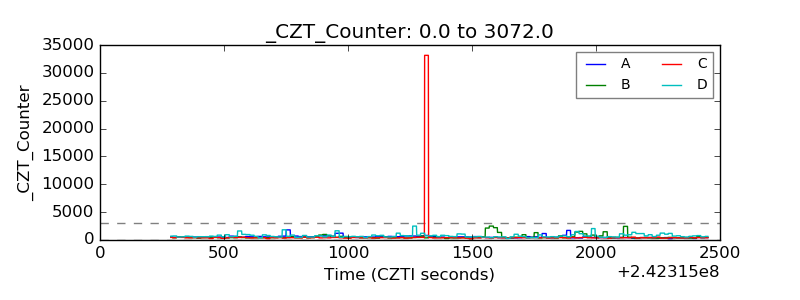 |
| +2.5 Volts monitor | 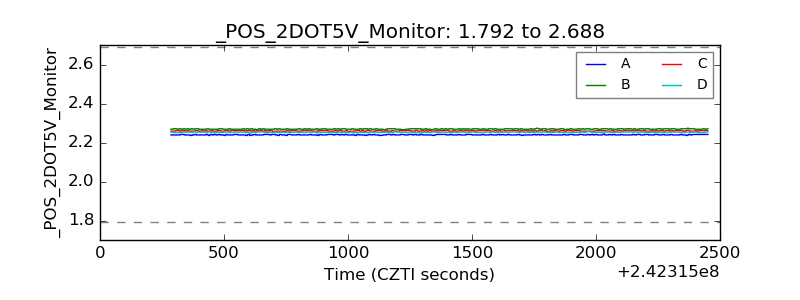 |
| +5 Volts monitor |  |
| _ROLL_ROT | 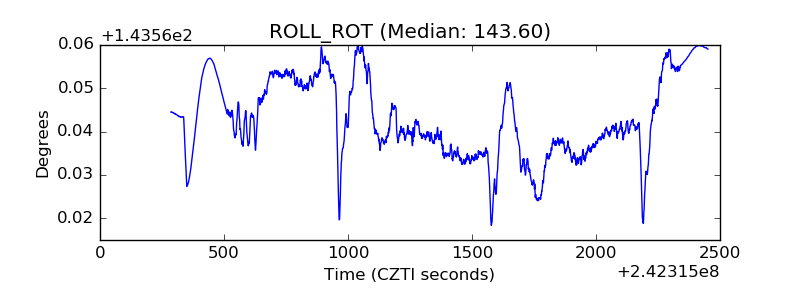 |
| _Roll_DEC | 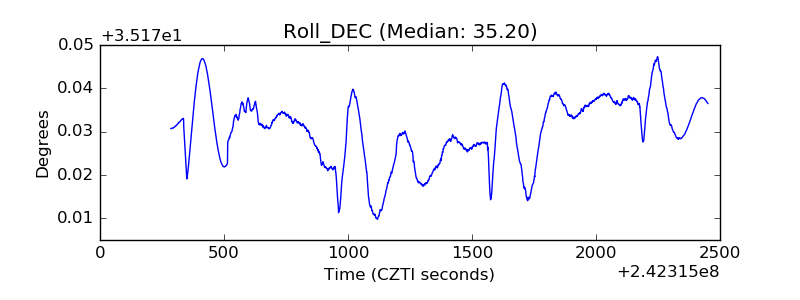 |
| _Roll_RA | 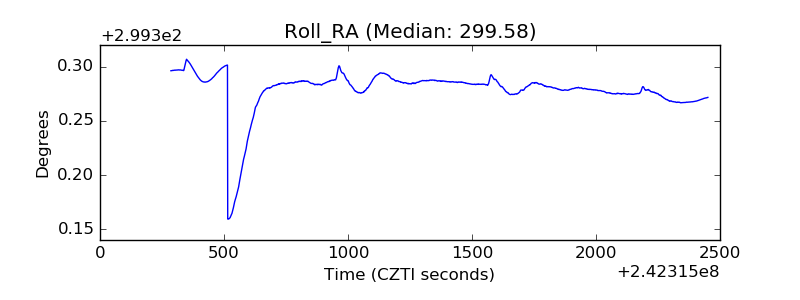 |
| Veto Counter | 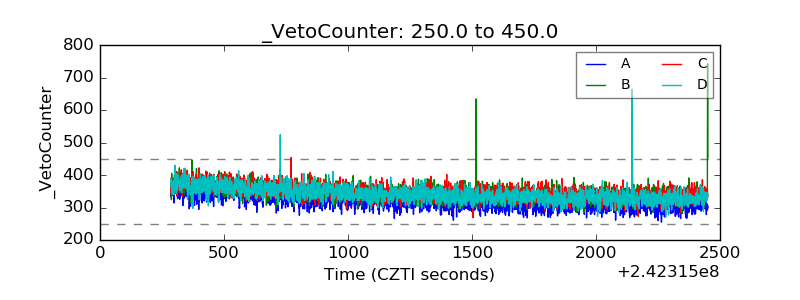 |