| Param | Original file | Final file |
|---|---|---|
| Filename | modeM0/AS1G07_057T01_9000001520_10492cztM0_level2.evt | modeM0/AS1G07_057T01_9000001520_10492cztM0_level2_quad_clean.evt |
| Size (bytes) | 903,913,920 | 168,664,320 |
| Size | 862.0 MB | 160.9 MB |
| Events in quadrant A | 6,200,986 | 1,058,110 |
| Events in quadrant B | 6,619,685 | 1,076,536 |
| Events in quadrant C | 5,679,259 | 1,075,276 |
| Events in quadrant D | 8,044,006 | 1,049,966 |
| Mode SS | |||
|---|---|---|---|
| Quadrant | BADHDUFLAG | Total packets | Discarded packets |
| A | 0 | 454 | 193 |
| B | 0 | 454 | 191 |
| C | 0 | 454 | 199 |
| D | 0 | 443 | 176 |
| Mode M9 | |||
|---|---|---|---|
| Quadrant | BADHDUFLAG | Total packets | Discarded packets |
| A | 0 | 50 | 15 |
| B | 0 | 59 | 24 |
| C | 0 | 58 | 23 |
| D | 0 | 51 | 16 |
| Mode M0 | |||
|---|---|---|---|
| Quadrant | BADHDUFLAG | Total packets | Discarded packets |
| A | 0 | 46589 | 20426 |
| B | 0 | 55035 | 27260 |
| C | 0 | 46697 | 21509 |
| D | 0 | 58068 | 25635 |
| Quadrant | Total seconds | Saturated seconds | Saturation percentage |
|---|---|---|---|
| A | 12252 | 61 | 0.497878% |
| B | 11873 | 315 | 2.653078% |
| C | 12262 | 49 | 0.399609% |
| D | 12640 | 193 | 1.526899% |
Noise dominated data is calculated using 1-second bins in cleaned event files. If a bin has >2000 counts, and if more than 50% of those come from <1% of pixels, then it is considered to be noise-dominated and hence unusable.
| Quadrant | # 1 sec bins | Bins with >0 counts | Bins with >2000 counts | High rate bins dominated by noise | Noise dominated (total time) | Noise dominated (detector-on time) | Marked lightcurve |
|---|---|---|---|---|---|---|---|
| A | 16982 | 13209 | 3 | 3 | 0.02% | 0.02% | 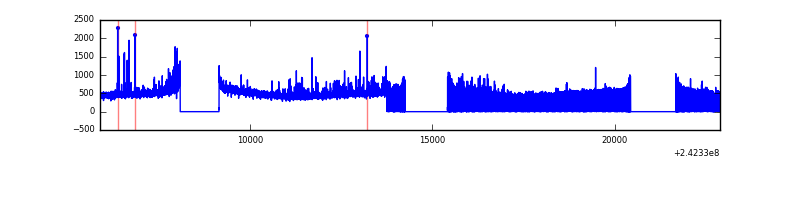 |
| B | 16982 | 12897 | 130 | 130 | 0.77% | 1.01% | 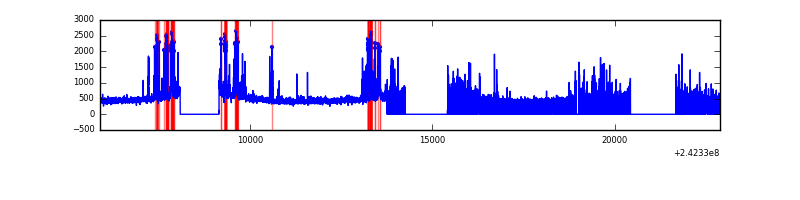 |
| C | 16981 | 13218 | 0 | 0 | 0.00% | 0.00% | 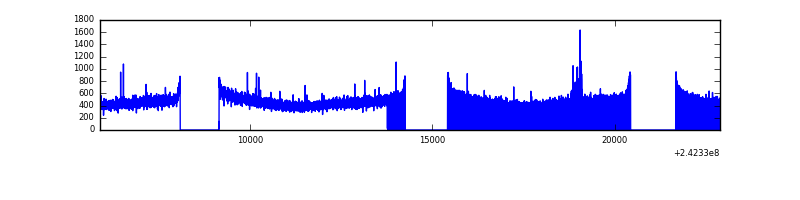 |
| D | 16982 | 13233 | 103 | 103 | 0.61% | 0.78% | 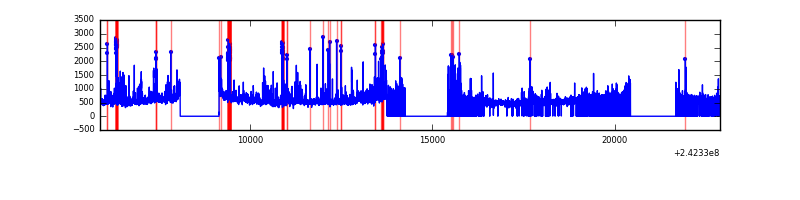 |
Top three noisy pixels from each quadrant. If the there are fewer than three noisy pixels in the level2.evt file, extra rows are filled as -1
| Pixel properties | Quadrant properties | ||||||
|---|---|---|---|---|---|---|---|
| Quadrant | DetID | PixID | Counts | Sigma | Mean | Median | Sigma |
| A | 15 | 239 | 301287 | 1008.32 | 1475 | 1444 | 297.4 |
| A | 3 | 80 | 170499 | 568.5 | 1475 | 1444 | 297.4 |
| A | 0 | 226 | 13421 | 40.28 | 1475 | 1444 | 297.4 |
| B | 4 | 239 | 855379 | 3175.44 | 1429 | 1395 | 268.9 |
| B | 0 | 214 | 87745 | 321.08 | 1429 | 1395 | 268.9 |
| B | 10 | 246 | 45042 | 162.3 | 1429 | 1395 | 268.9 |
| C | 14 | 234 | 29026 | 82.37 | 1448 | 1457 | 334.7 |
| C | 13 | 61 | 10729 | 27.7 | 1448 | 1457 | 334.7 |
| C | 8 | 222 | 3712 | 6.74 | 1448 | 1457 | 334.7 |
| D | 8 | 195 | 1284391 | 3672.09 | 1462 | 1423 | 349.4 |
| D | 1 | 52 | 427506 | 1219.53 | 1462 | 1423 | 349.4 |
| D | 1 | 20 | 358598 | 1022.3 | 1462 | 1423 | 349.4 |
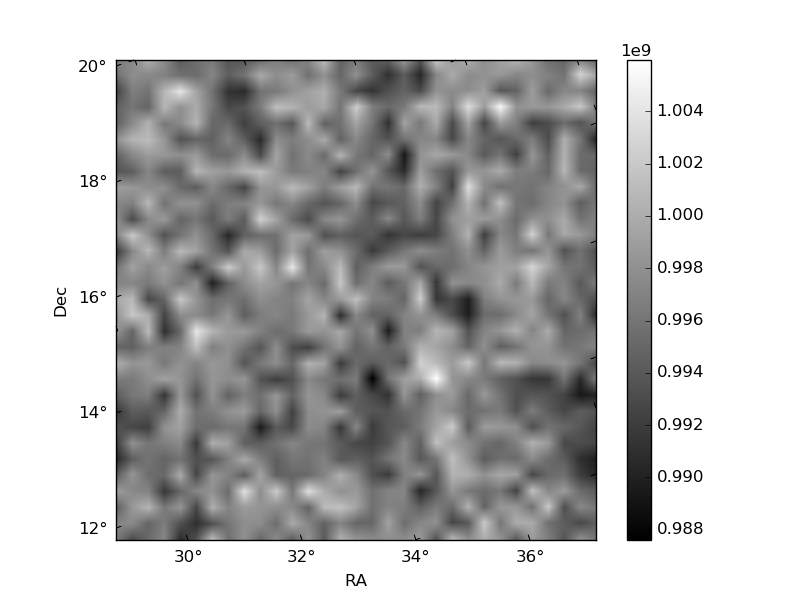
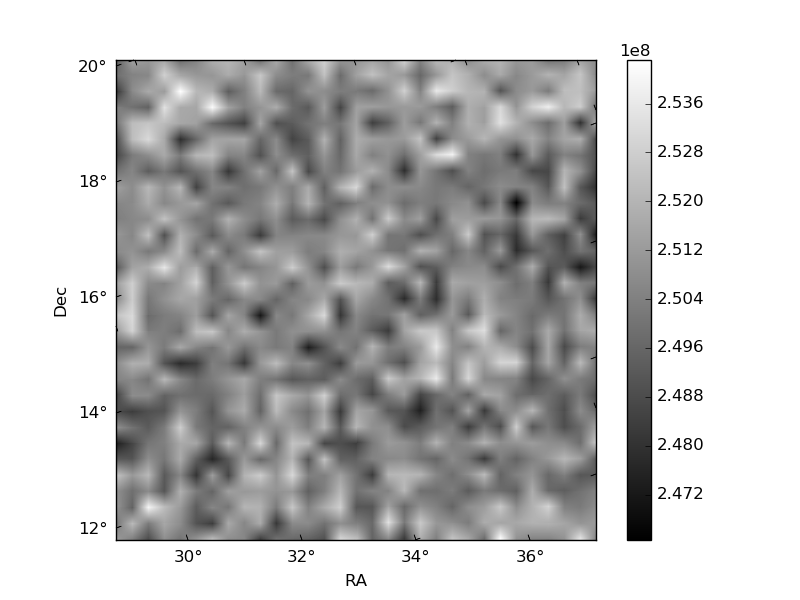
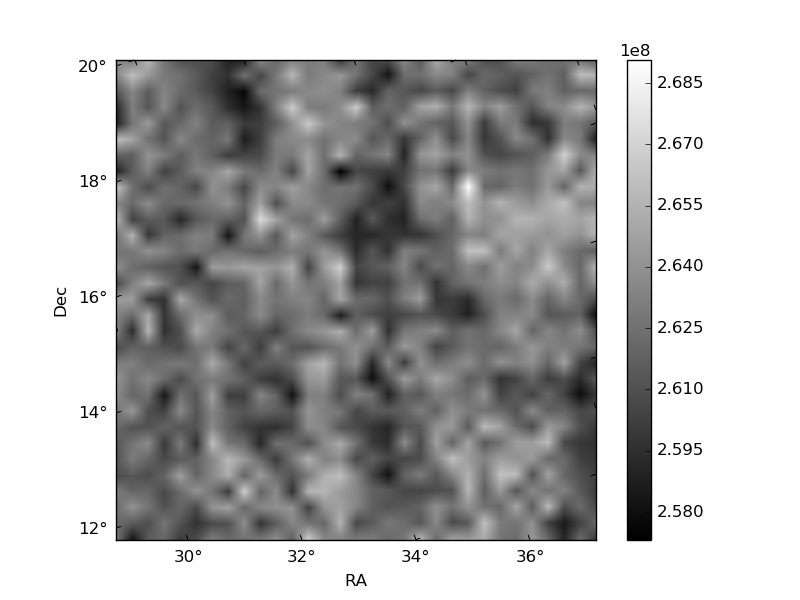
Histogram calculated using DETX and DETY for each event in the final _common_clean file
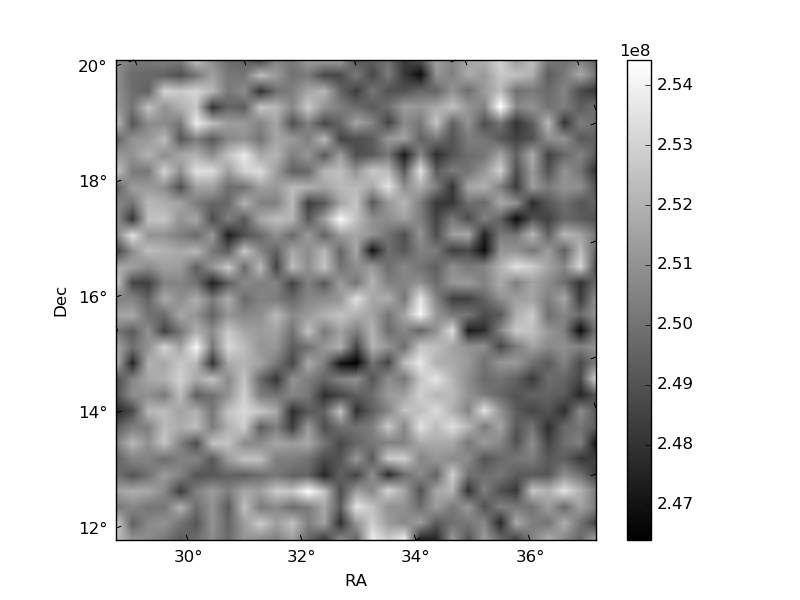
| Quadrant A | 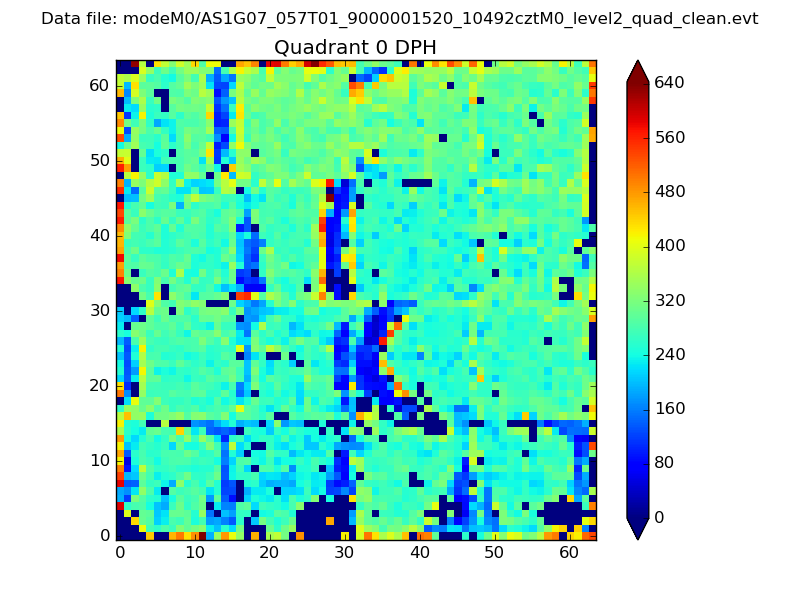 |
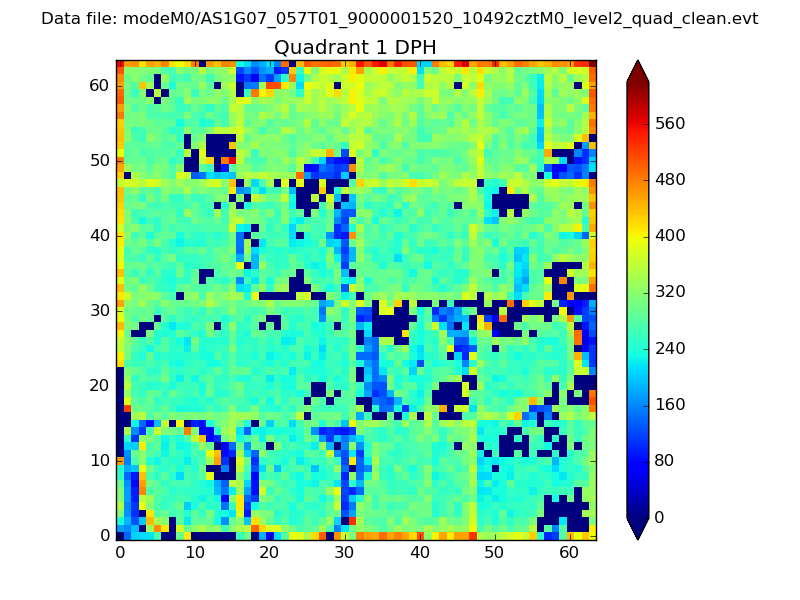 |
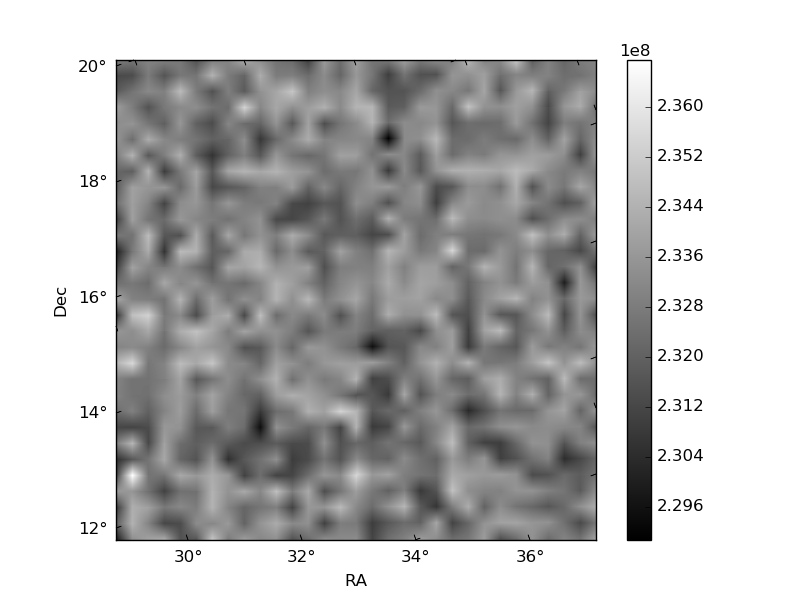
Quadrant B |
|---|---|---|---|
| Quadrant D | 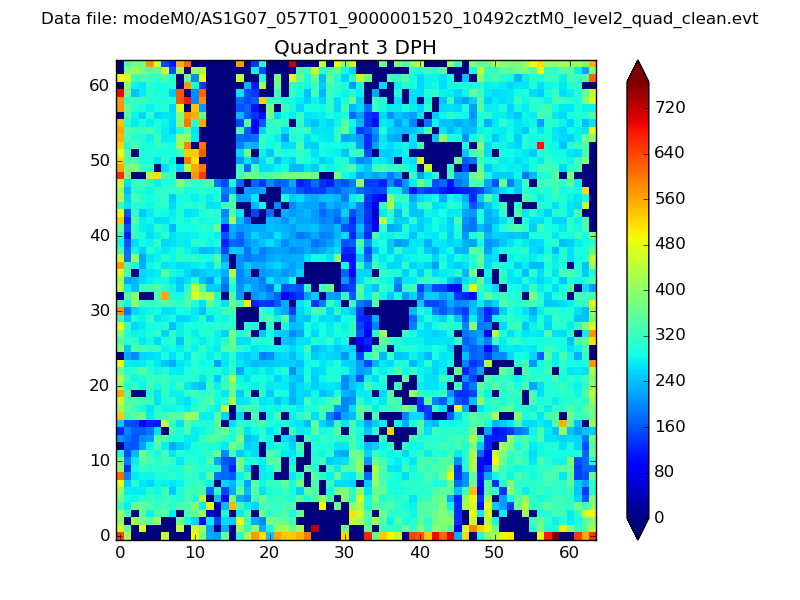 |
 |
Quadrant C |
| Plot type | Count rate plots | Images |
|---|---|---|
| Comparison with Poisson distribution Blue bars denote a histogram of data divided into 1 sec bins. Red curve is a Poisson curve with rate = median count rate of data. |
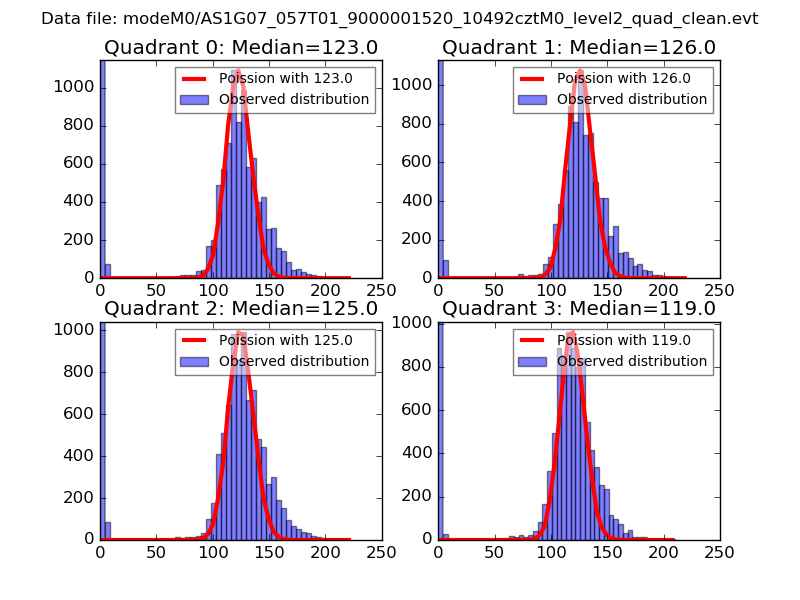 |
 |
| Quadrant-wise count rates Data is divided into 100 sec bins |
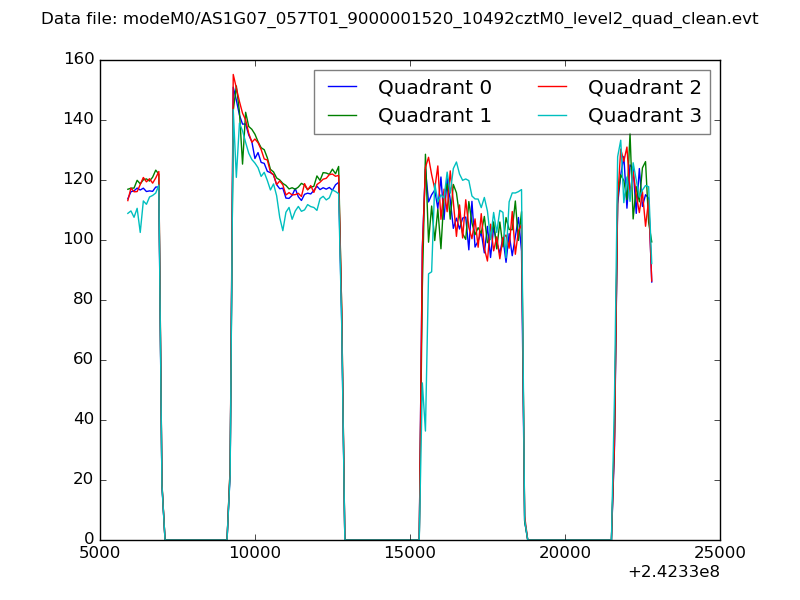 |
|
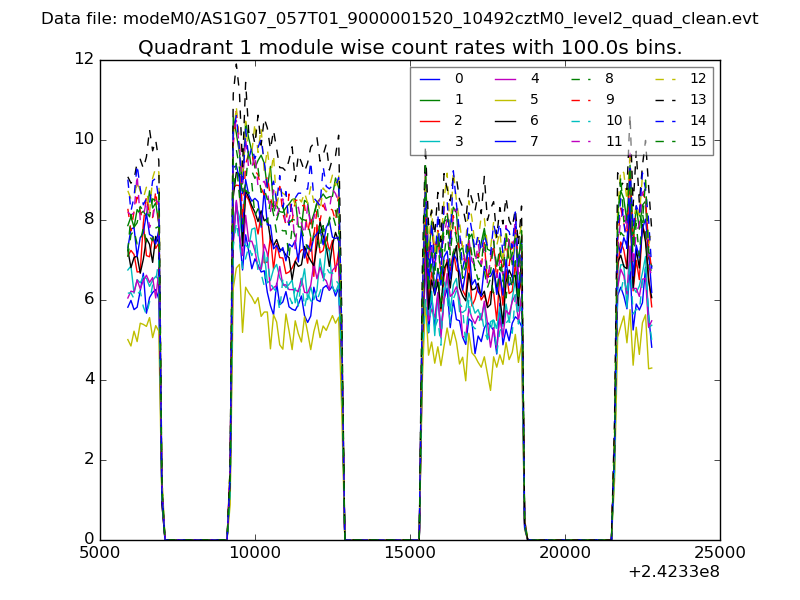
| Module-wise count rates for Quadrant A Data is divided into 100 sec bins |
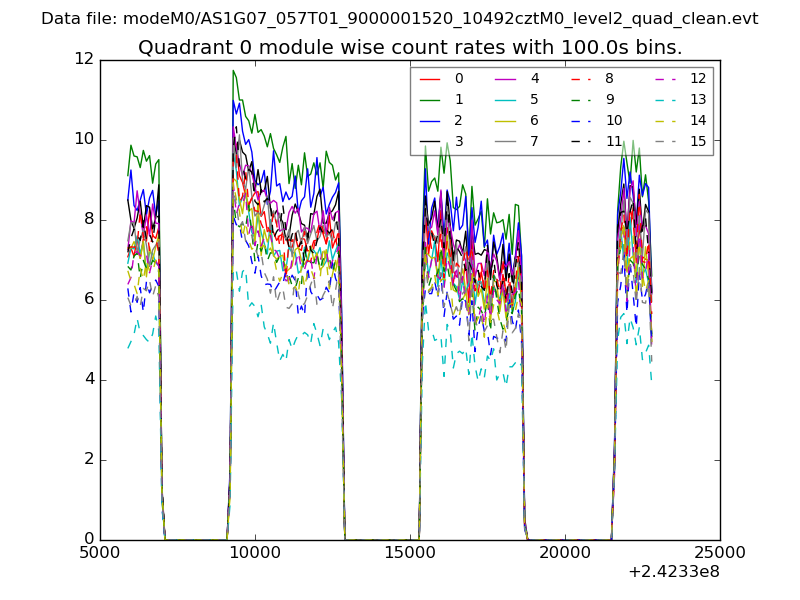 |
 |
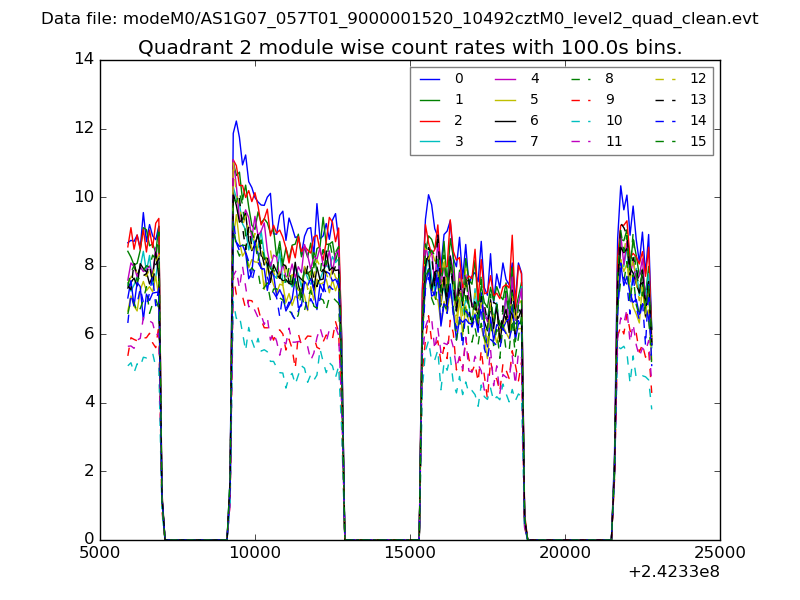
| Module-wise count rates for Quadrant B Data is divided into 100 sec bins |
 |
 |
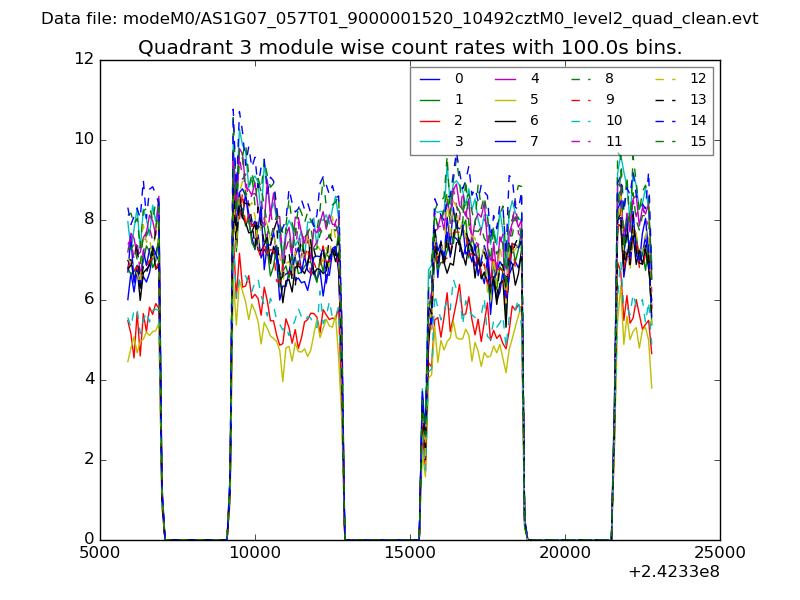
| Module-wise count rates for Quadrant C Data is divided into 100 sec bins |
 |
 |
| Module-wise count rates for Quadrant D Data is divided into 100 sec bins |
 |
 |
| Parameter | Plot |
|---|---|
| CZT HV Monitor | 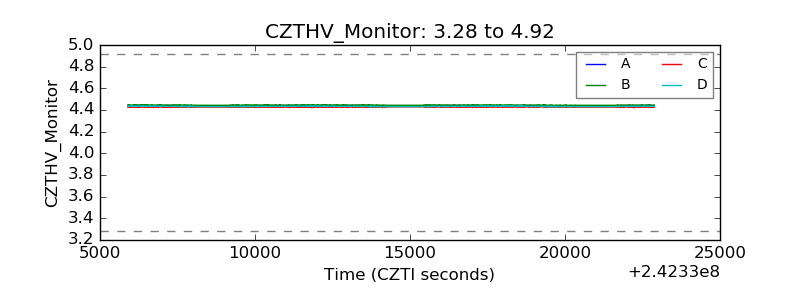 |
| D_VDD |  |
| Temperature 1 | 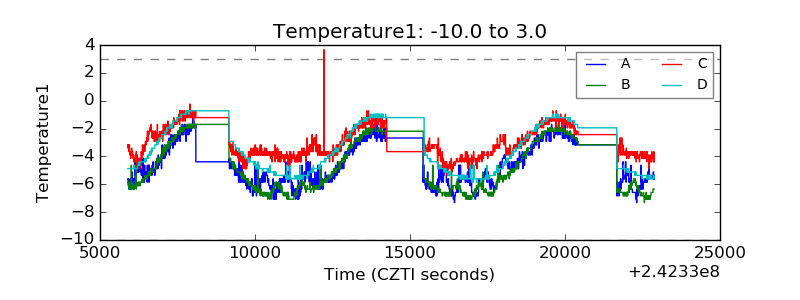 |
| Veto HV Monitor |  |
| Veto LLD | 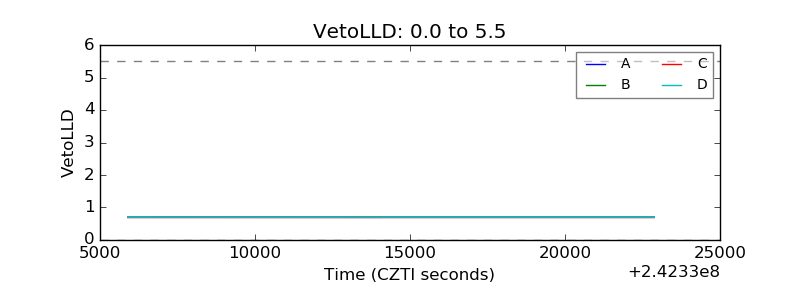 |
| Alpha Counter |  |
| _CPM_Rate |  |
| CZT Counter | 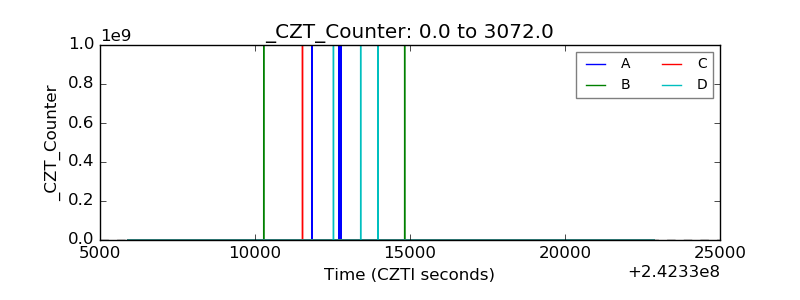 |
| +2.5 Volts monitor |  |
| +5 Volts monitor |  |
| _ROLL_ROT | 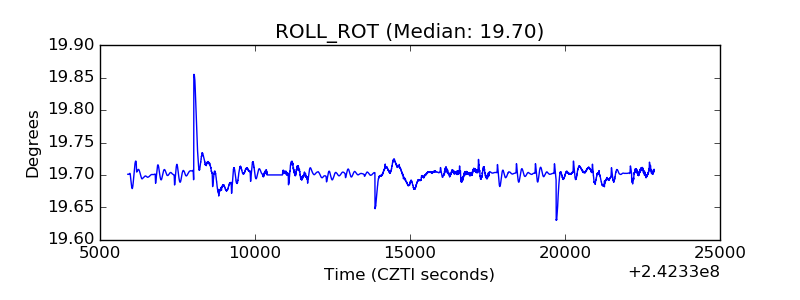 |
| _Roll_DEC | 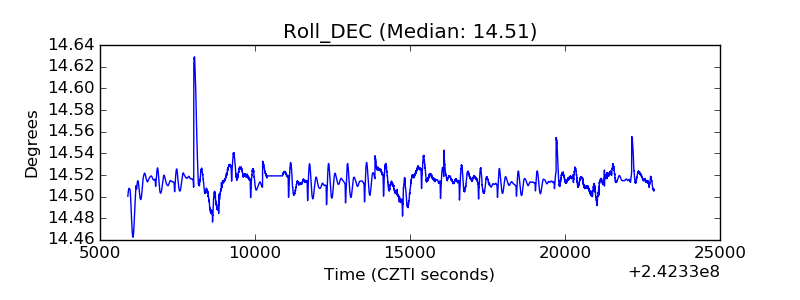 |
| _Roll_RA | 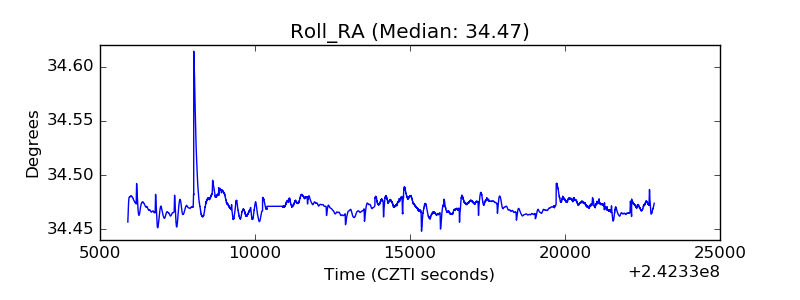 |
| Veto Counter | 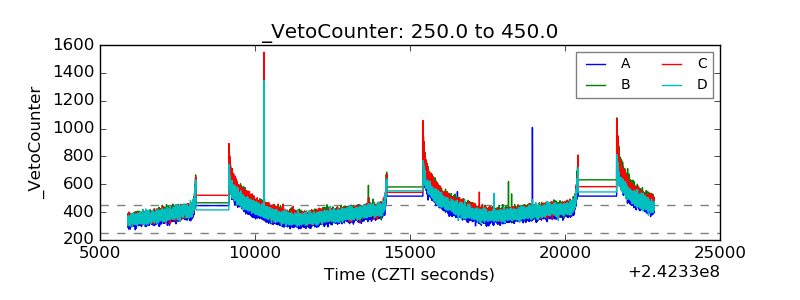 |