| Param | Original file | Final file |
|---|---|---|
| Filename | modeM0/AS1G07_057T01_9000001520_10493cztM0_level2.fits | modeM0/AS1G07_057T01_9000001520_10493cztM0_level2_quad_clean.evt |
| Size (bytes) | 288,509,760 | 88,205,760 |
| Size | 275.1 MB | 84.1 MB |
| Events in quadrant A | 2,448,172 | 609,259 |
| Events in quadrant B | 2,409,883 | 577,905 |
| Events in quadrant C | 2,352,276 | 599,797 |
| Events in quadrant D | 3,088,433 | 541,490 |
| Mode SS | |||
|---|---|---|---|
| Quadrant | BADHDUFLAG | Total packets | Discarded packets |
| A | 0 | 244 | 128 |
| B | 0 | 244 | 136 |
| C | 0 | 244 | 131 |
| D | 0 | 236 | 120 |
| Mode M9 | |||
|---|---|---|---|
| Quadrant | BADHDUFLAG | Total packets | Discarded packets |
| A | 0 | 34 | 10 |
| B | 0 | 37 | 13 |
| C | 0 | 37 | 13 |
| D | 0 | 31 | 7 |
| Mode M0 | |||
|---|---|---|---|
| Quadrant | BADHDUFLAG | Total packets | Discarded packets |
| A | 0 | 24455 | 14283 |
| B | 0 | 28848 | 18849 |
| C | 0 | 25258 | 15078 |
| D | 0 | 31698 | 19266 |
| Quadrant | Total seconds | Saturated seconds | Saturation percentage |
|---|---|---|---|
| A | 4915 | 27 | 0.549339% |
| B | 4563 | 56 | 1.227263% |
| C | 4937 | 20 | 0.405104% |
| D | 4985 | 24 | 0.481444% |
Noise dominated data is calculated using 1-second bins in cleaned event files. If a bin has >2000 counts, and if more than 50% of those come from <1% of pixels, then it is considered to be noise-dominated and hence unusable.
| Quadrant | # 1 sec bins | Bins with >0 counts | Bins with >2000 counts | High rate bins dominated by noise | Noise dominated (total time) | Noise dominated (detector-on time) | Marked lightcurve |
|---|---|---|---|---|---|---|---|
| A | 7404 | 5791 | 0 | 0 | 0.00% | 0.00% | 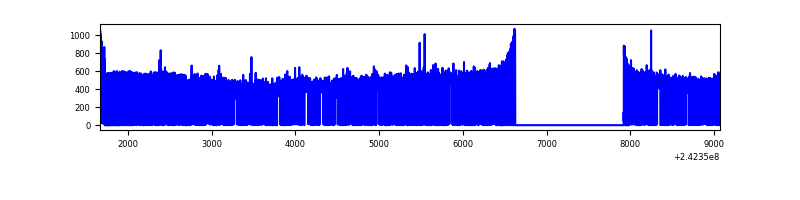 |
| B | 7404 | 5457 | 0 | 0 | 0.00% | 0.00% | 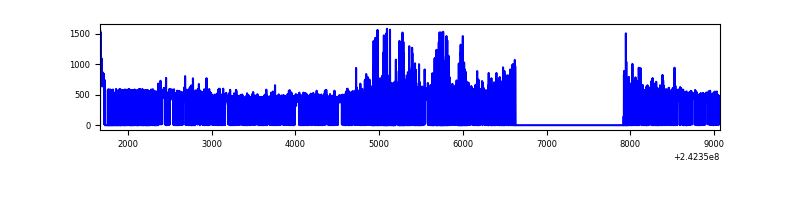 |
| C | 7402 | 5813 | 0 | 0 | 0.00% | 0.00% | 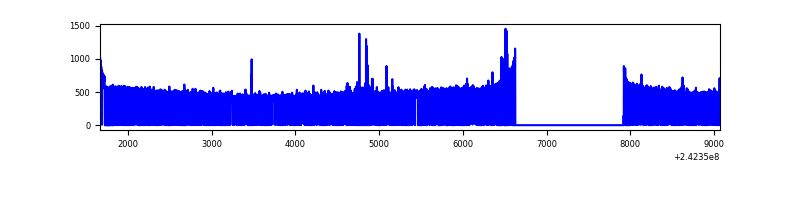 |
| D | 7404 | 5595 | 0 | 0 | 0.00% | 0.00% | 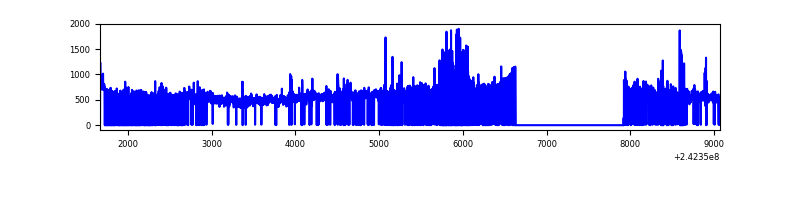 |
Top three noisy pixels from each quadrant. If the there are fewer than three noisy pixels in the level2.evt file, extra rows are filled as -1
| Pixel properties | Quadrant properties | ||||||
|---|---|---|---|---|---|---|---|
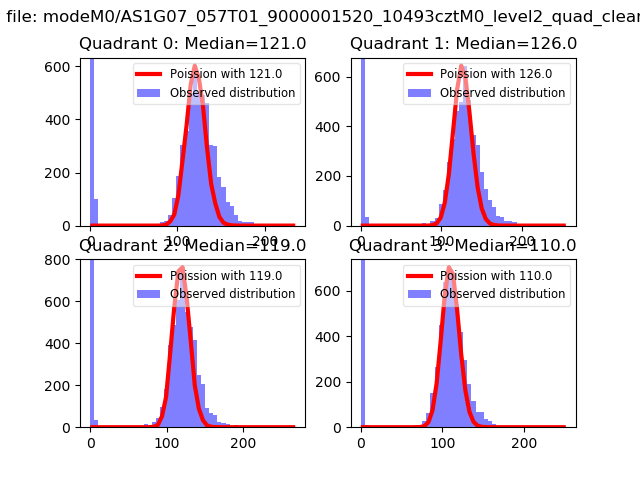
| Quadrant | DetID | PixID | Counts | Sigma | Mean | Median | Sigma |
| A | 3 | 80 | 61669 | 493.71 | 608 | 596 | 123.7 |
| A | 15 | 239 | 39636 | 315.6 | 608 | 596 | 123.7 |
| A | 0 | 226 | 5630 | 40.69 | 608 | 596 | 123.7 |
| B | 4 | 239 | 137160 | 1266.73 | 568 | 556 | 107.8 |
| B | 4 | 81 | 23237 | 210.32 | 568 | 556 | 107.8 |
| B | 0 | 214 | 20738 | 187.15 | 568 | 556 | 107.8 |
| C | 14 | 234 | 22680 | 160.15 | 596 | 599 | 137.9 |
| C | 13 | 61 | 4443 | 27.88 | 596 | 599 | 137.9 |
| C | 1 | 0 | 2507 | 13.84 | 596 | 599 | 137.9 |
| D | 8 | 195 | 673826 | 4751.61 | 589 | 573 | 141.7 |
| D | 1 | 52 | 66715 | 466.81 | 589 | 573 | 141.7 |
| D | 12 | 233 | 55407 | 387.0 | 589 | 573 | 141.7 |
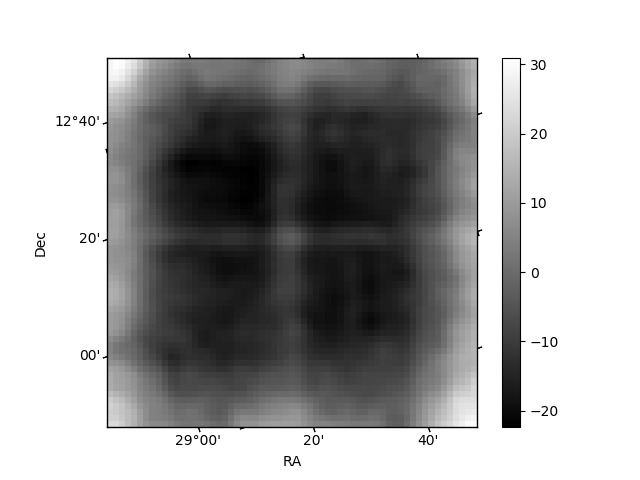
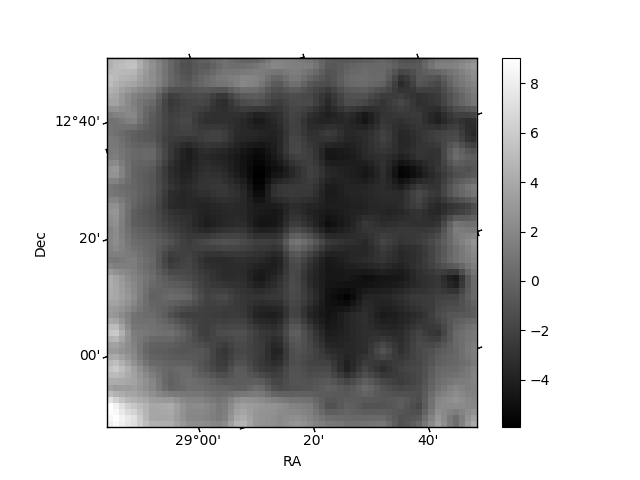
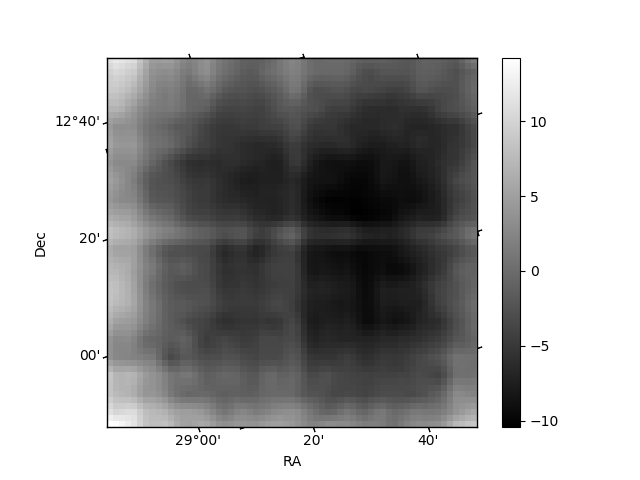
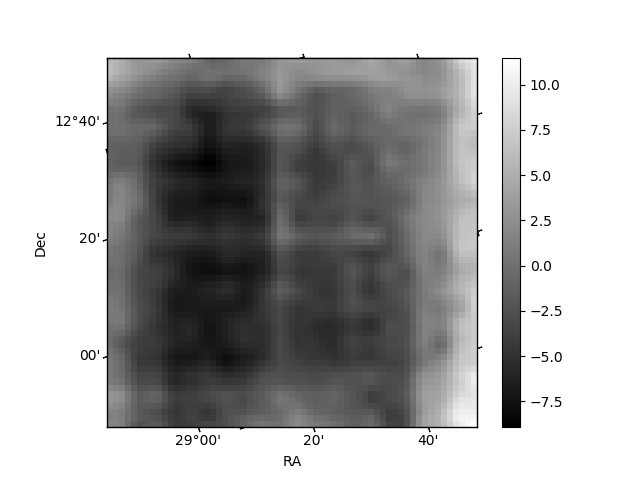
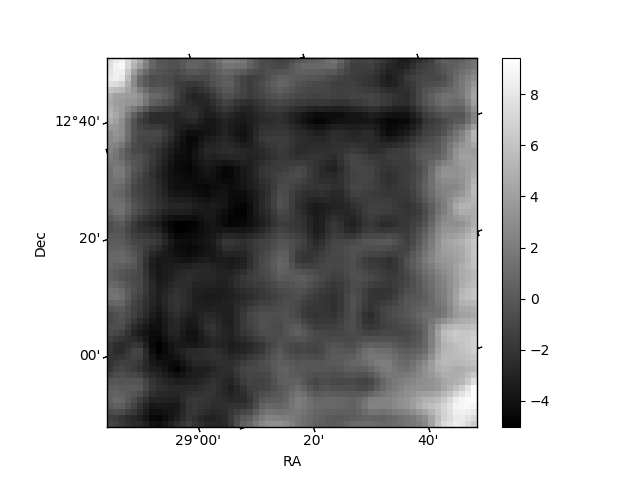
Histogram calculated using DETX and DETY for each event in the final _common_clean file
| Quadrant A | 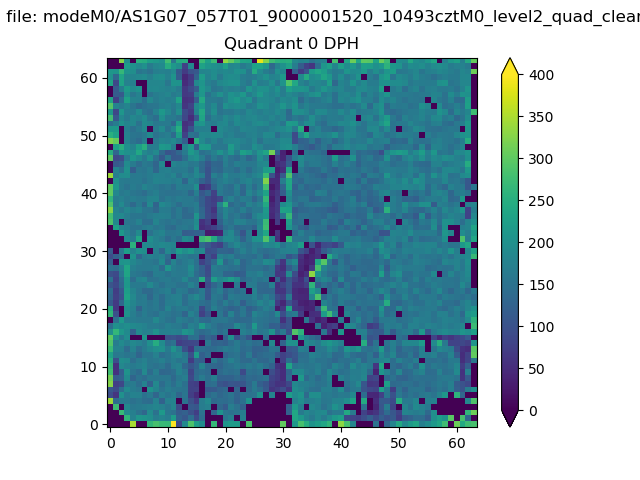 |
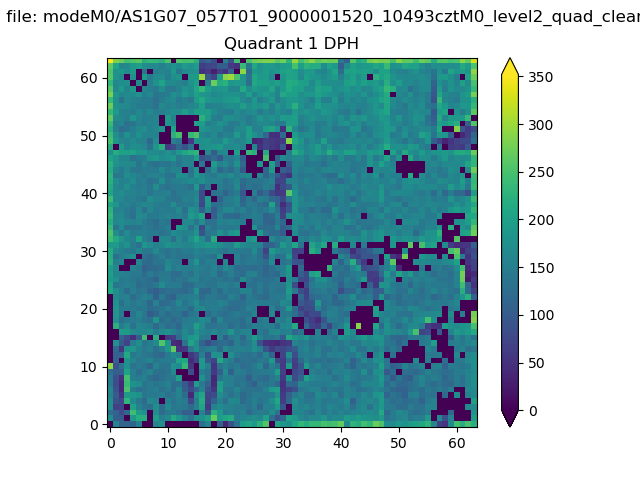 |
Quadrant B |
|---|---|---|---|
| Quadrant D | 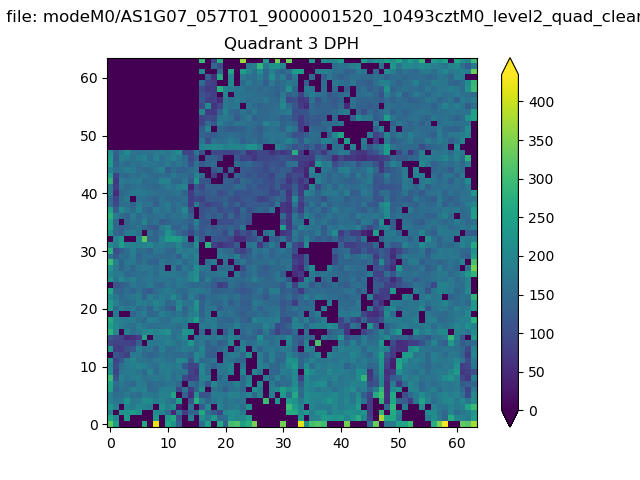 |
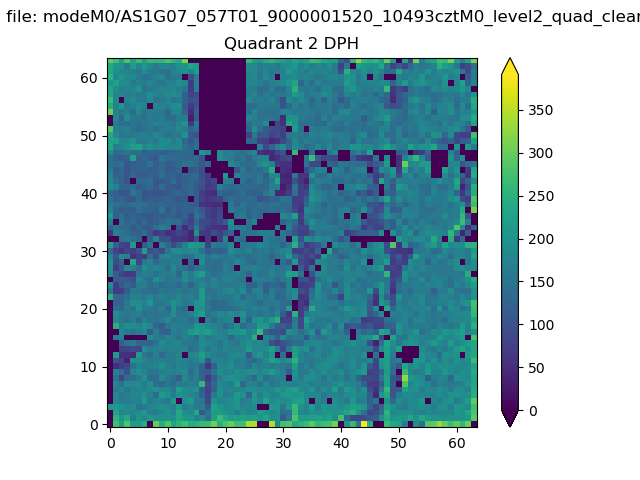 |
Quadrant C |
| Plot type | Count rate plots | Images |
|---|---|---|
| Comparison with Poisson distribution Blue bars denote a histogram of data divided into 1 sec bins. Red curve is a Poisson curve with rate = median count rate of data. |
 |
 |
| Quadrant-wise count rates Data is divided into 100 sec bins |
 |
|
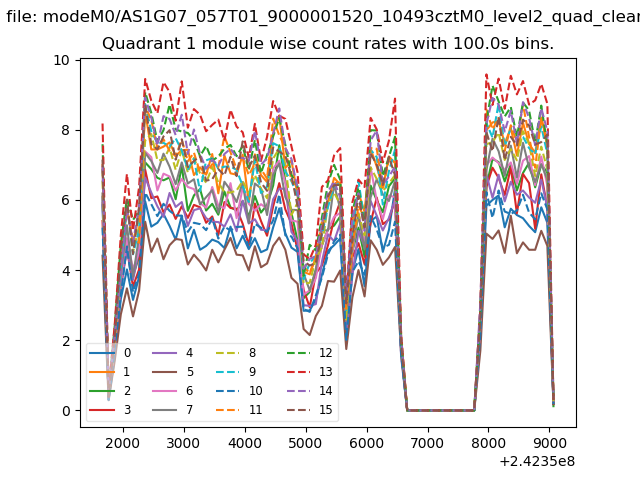
| Module-wise count rates for Quadrant A Data is divided into 100 sec bins |
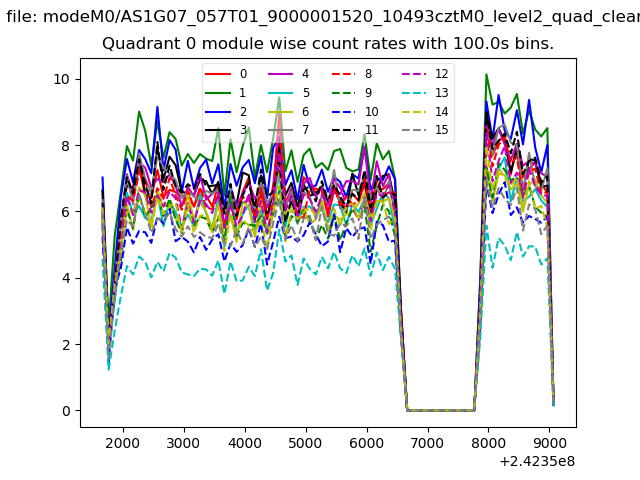 |
 |
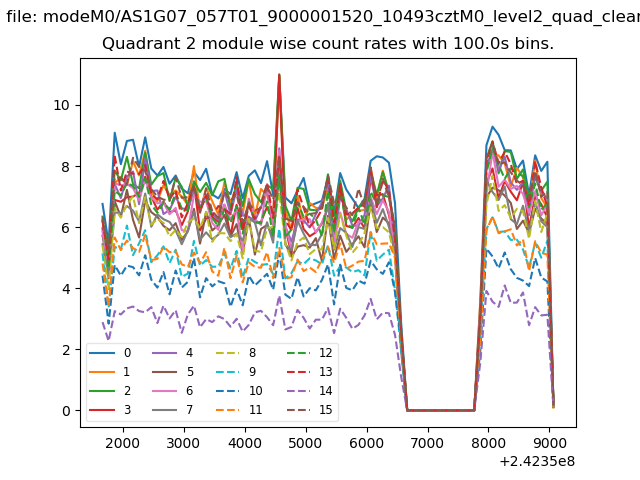
| Module-wise count rates for Quadrant B Data is divided into 100 sec bins |
 |
 |
| Module-wise count rates for Quadrant C Data is divided into 100 sec bins |
 |
 |
| Module-wise count rates for Quadrant D Data is divided into 100 sec bins |
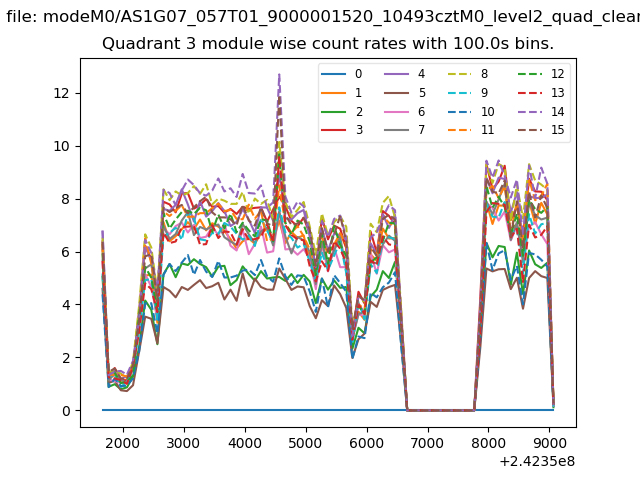 |
 |
| Parameter | Plot |
|---|---|
| CZT HV Monitor | 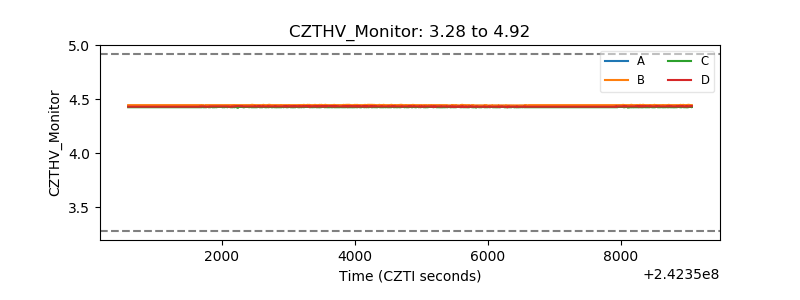 |
| D_VDD | 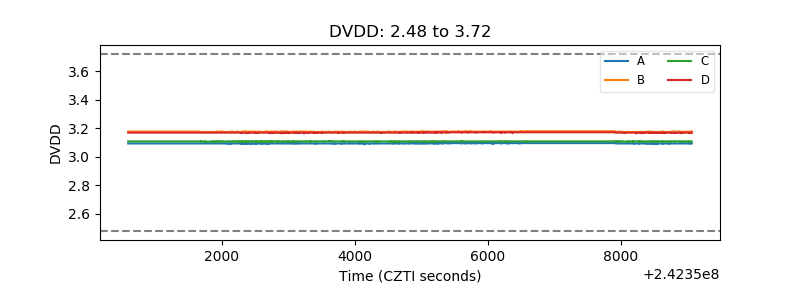 |
| Temperature 1 | 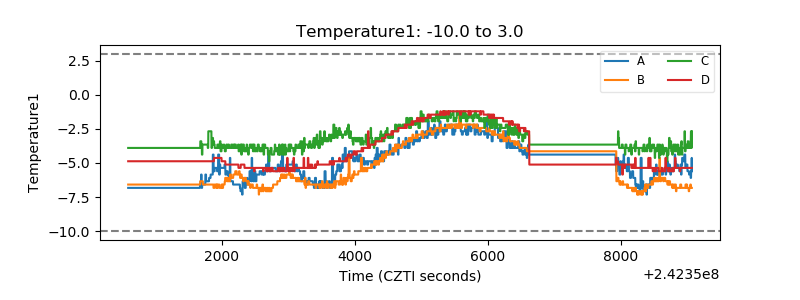 |
| Veto HV Monitor | 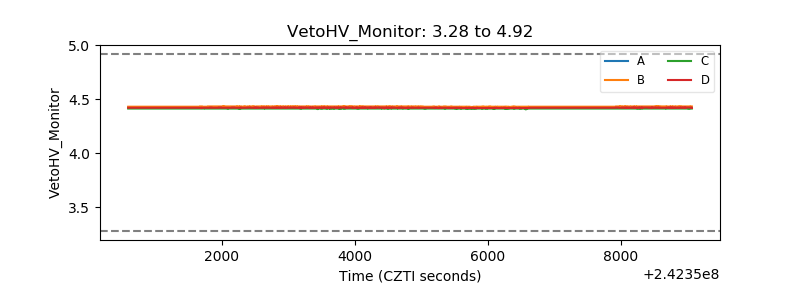 |
| Veto LLD | 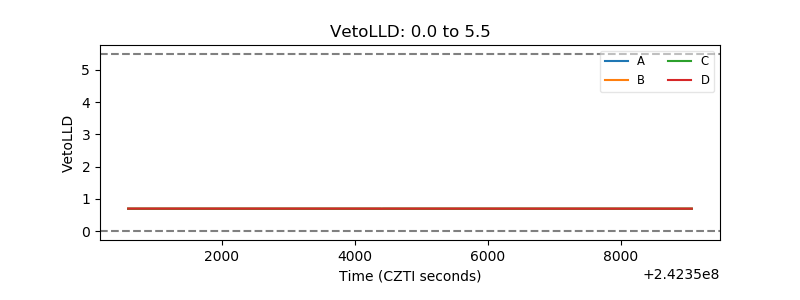 |
| Alpha Counter |  |
| _CPM_Rate | 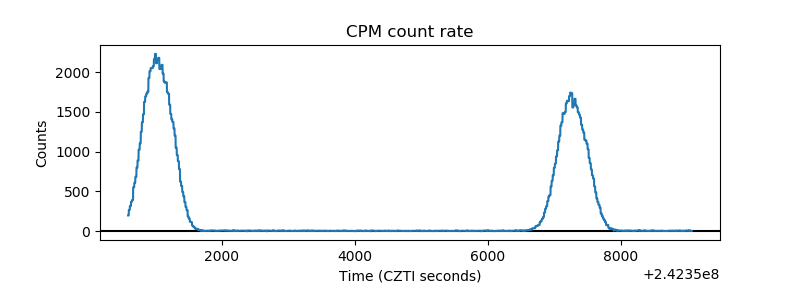 |
| CZT Counter | 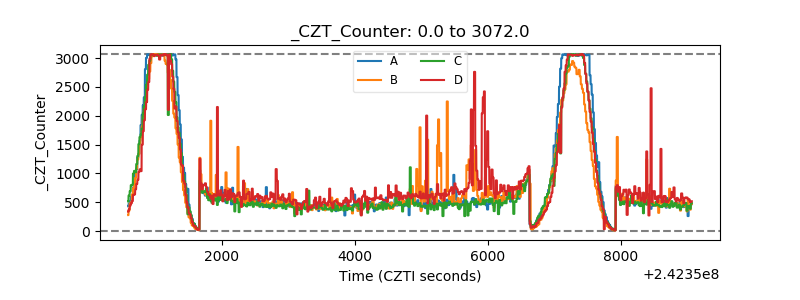 |
| +2.5 Volts monitor |  |
| +5 Volts monitor |  |
| _ROLL_ROT | 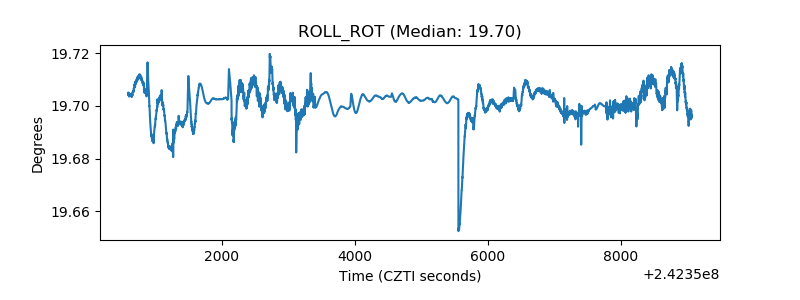 |
| _Roll_DEC | 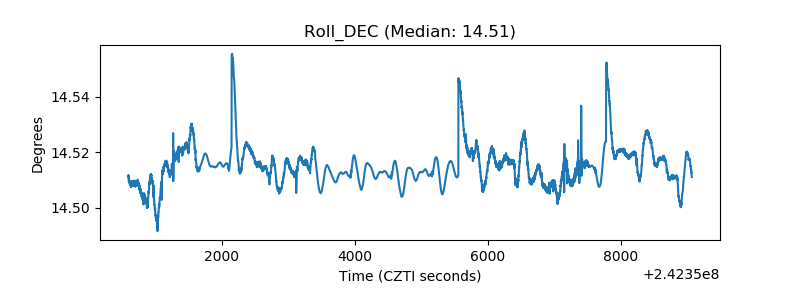 |
| _Roll_RA | 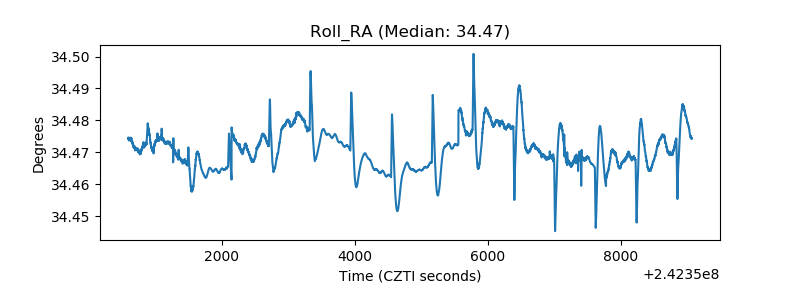 |
| Veto Counter | 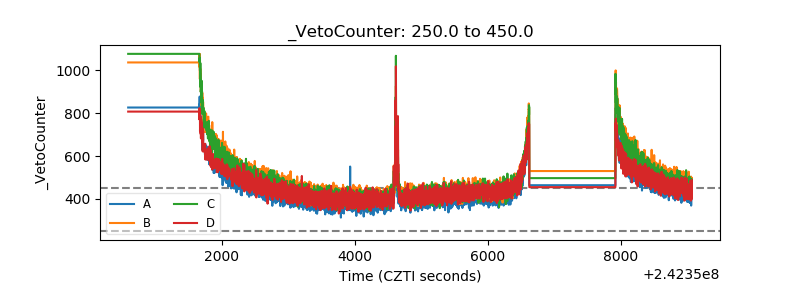 |