| Param | Original file | Final file |
|---|---|---|
| Filename | modeM0/AS1G07_057T01_9000001520_10494cztM0_level2.evt | modeM0/AS1G07_057T01_9000001520_10494cztM0_level2_quad_clean.evt |
| Size (bytes) | 499,029,120 | 91,661,760 |
| Size | 475.9 MB | 87.4 MB |
| Events in quadrant A | 3,349,082 | 584,007 |
| Events in quadrant B | 3,849,653 | 593,888 |
| Events in quadrant C | 3,269,100 | 578,857 |
| Events in quadrant D | 4,186,664 | 548,222 |
| Mode SS | |||
|---|---|---|---|
| Quadrant | BADHDUFLAG | Total packets | Discarded packets |
| A | 0 | 138 | 0 |
| B | 0 | 138 | 0 |
| C | 0 | 138 | 0 |
| D | 0 | 138 | 0 |
| Mode M9 | |||
|---|---|---|---|
| Quadrant | BADHDUFLAG | Total packets | Discarded packets |
| A | 0 | 26 | 0 |
| B | 0 | 26 | 0 |
| C | 0 | 26 | 0 |
| D | 0 | 26 | 0 |
| Mode M0 | |||
|---|---|---|---|
| Quadrant | BADHDUFLAG | Total packets | Discarded packets |
| A | 0 | 14201 | 3 |
| B | 0 | 15826 | 2 |
| C | 0 | 14297 | 2 |
| D | 0 | 16751 | 2 |
| Quadrant | Total seconds | Saturated seconds | Saturation percentage |
|---|---|---|---|
| A | 6761 | 56 | 0.828280% |
| B | 6761 | 244 | 3.608934% |
| C | 6761 | 53 | 0.783908% |
| D | 6761 | 106 | 1.567815% |
Noise dominated data is calculated using 1-second bins in cleaned event files. If a bin has >2000 counts, and if more than 50% of those come from <1% of pixels, then it is considered to be noise-dominated and hence unusable.
| Quadrant | # 1 sec bins | Bins with >0 counts | Bins with >2000 counts | High rate bins dominated by noise | Noise dominated (total time) | Noise dominated (detector-on time) | Marked lightcurve |
|---|---|---|---|---|---|---|---|
| A | 9346 | 6763 | 0 | 0 | 0.00% | 0.00% | 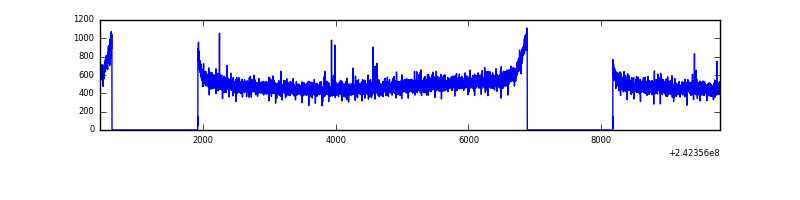 |
| B | 9346 | 6763 | 85 | 85 | 0.91% | 1.26% | 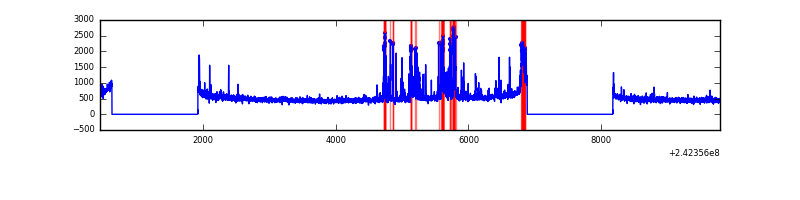 |
| C | 9346 | 6763 | 3 | 3 | 0.03% | 0.04% | 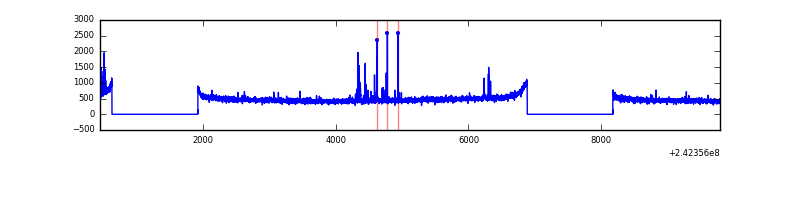 |
| D | 9346 | 6763 | 55 | 55 | 0.59% | 0.81% | 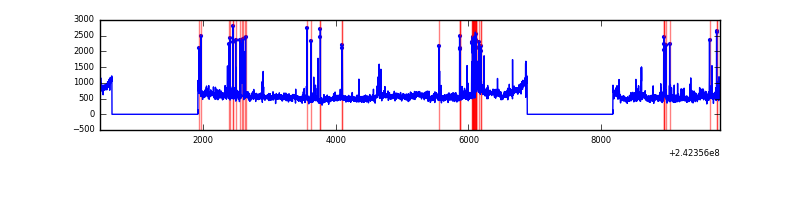 |
Top three noisy pixels from each quadrant. If the there are fewer than three noisy pixels in the level2.evt file, extra rows are filled as -1
| Pixel properties | Quadrant properties | ||||||
|---|---|---|---|---|---|---|---|
| Quadrant | DetID | PixID | Counts | Sigma | Mean | Median | Sigma |
| A | 3 | 80 | 76810 | 442.04 | 847 | 832 | 171.9 |
| A | 0 | 226 | 7745 | 40.22 | 847 | 832 | 171.9 |
| A | 12 | 194 | 6844 | 34.98 | 847 | 832 | 171.9 |
| B | 4 | 239 | 519890 | 3252.28 | 839 | 819 | 159.6 |
| B | 0 | 214 | 30769 | 187.65 | 839 | 819 | 159.6 |
| B | 12 | 111 | 17693 | 105.73 | 839 | 819 | 159.6 |
| C | 14 | 234 | 74519 | 385.71 | 819 | 823 | 191.1 |
| C | 13 | 61 | 6045 | 27.33 | 819 | 823 | 191.1 |
| C | 8 | 222 | 2673 | 9.68 | 819 | 823 | 191.1 |
| D | 8 | 195 | 618089 | 3187.56 | 809 | 787 | 193.7 |
| D | 1 | 52 | 188625 | 969.94 | 809 | 787 | 193.7 |
| D | 12 | 233 | 114937 | 589.44 | 809 | 787 | 193.7 |
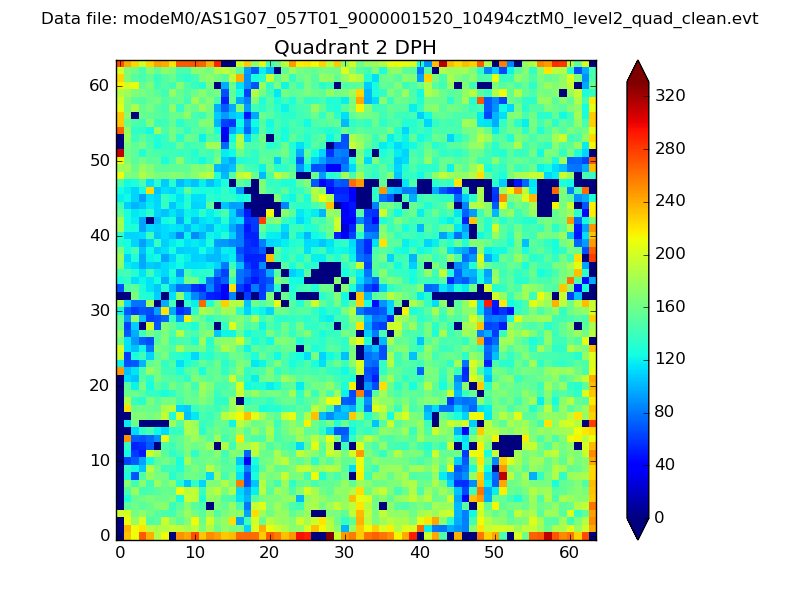
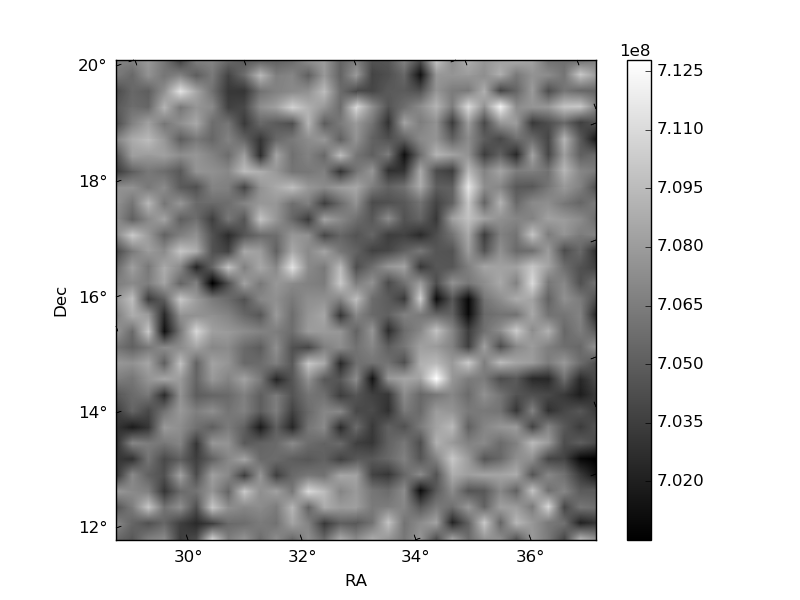
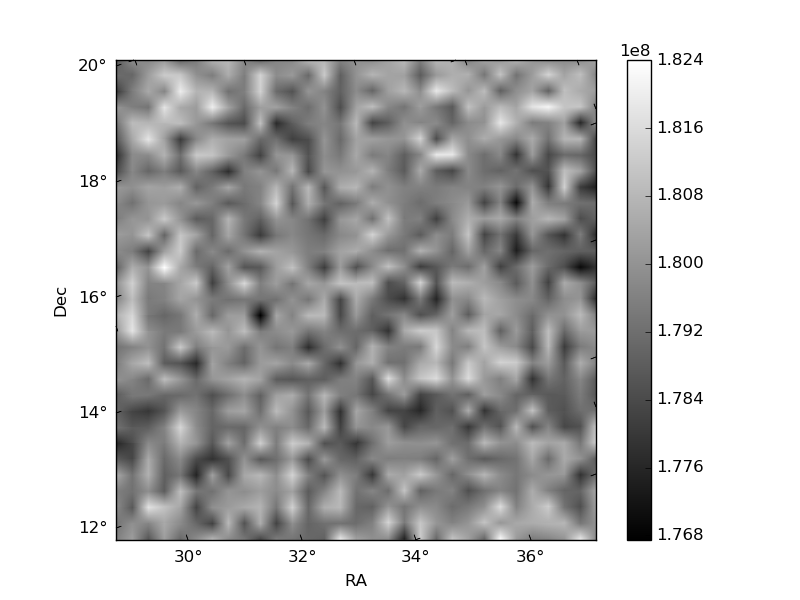
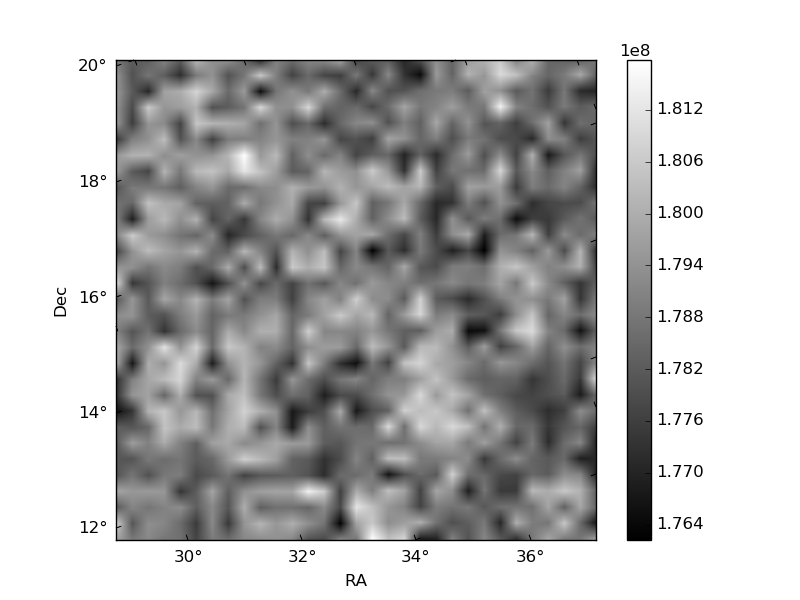
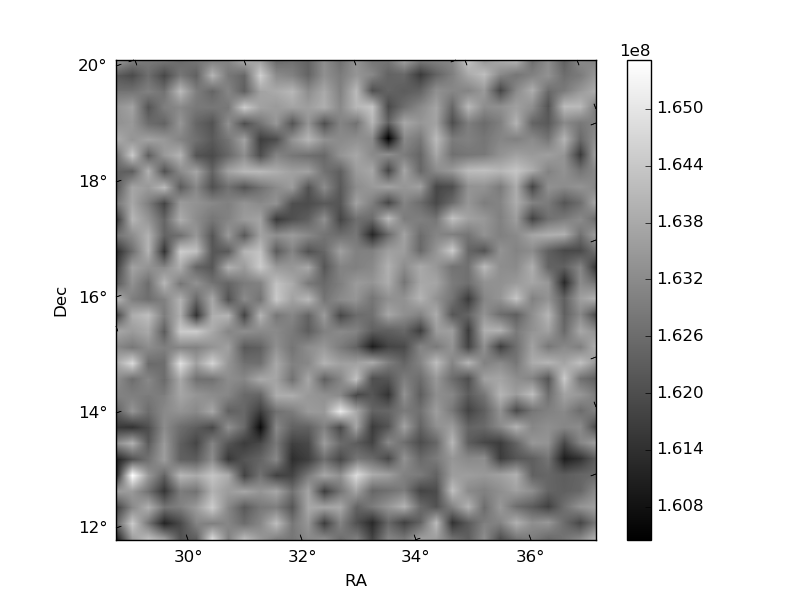
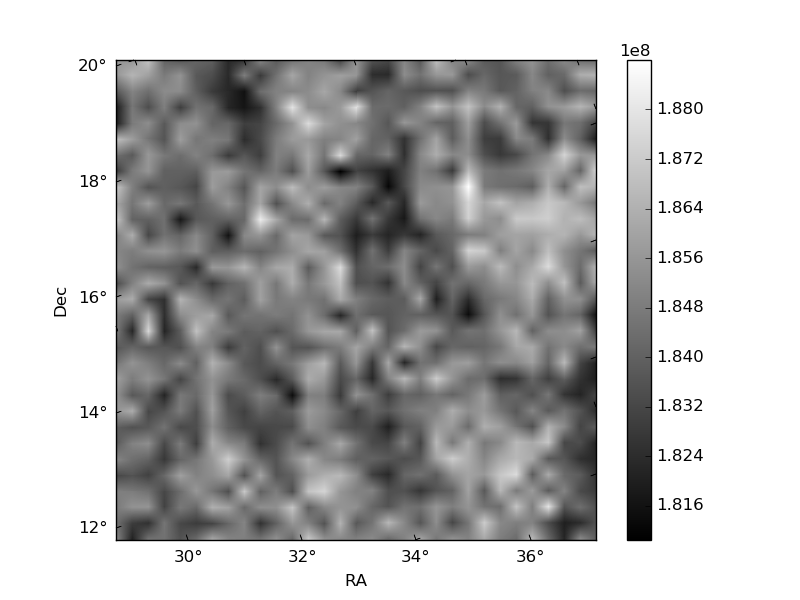
Histogram calculated using DETX and DETY for each event in the final _common_clean file
| Quadrant A | 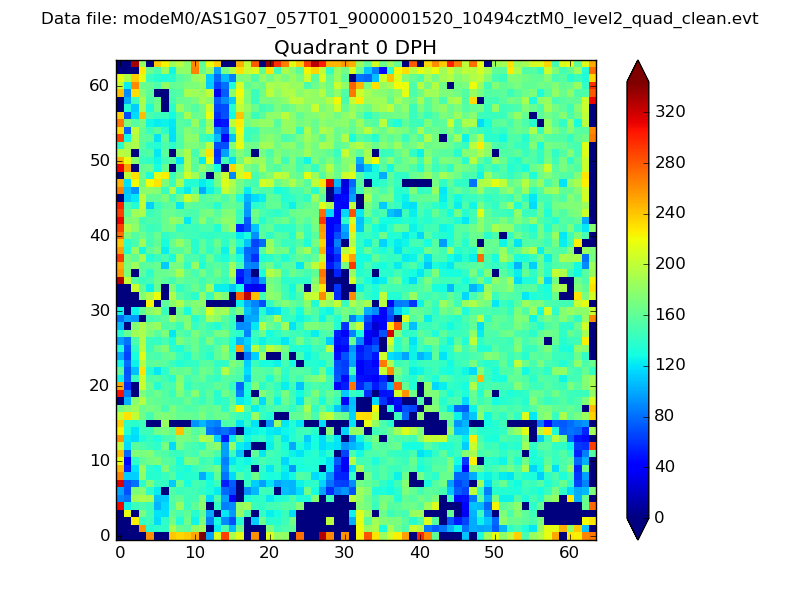 |
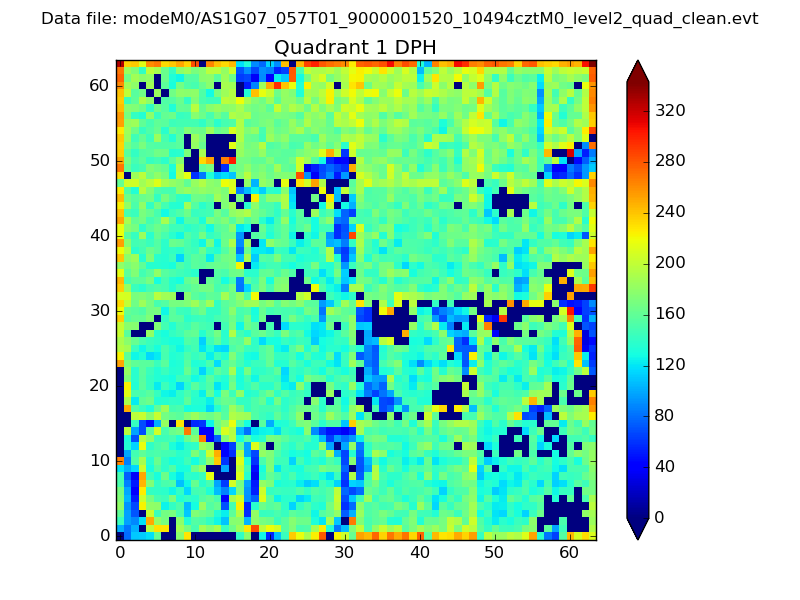 |
Quadrant B |
|---|---|---|---|
| Quadrant D | 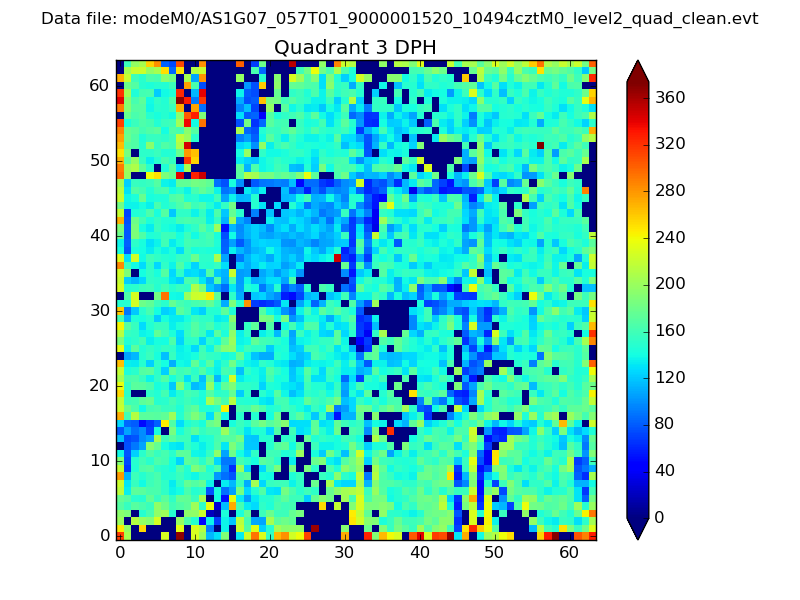 |
 |
Quadrant C |
| Plot type | Count rate plots | Images |
|---|---|---|
| Comparison with Poisson distribution Blue bars denote a histogram of data divided into 1 sec bins. Red curve is a Poisson curve with rate = median count rate of data. |
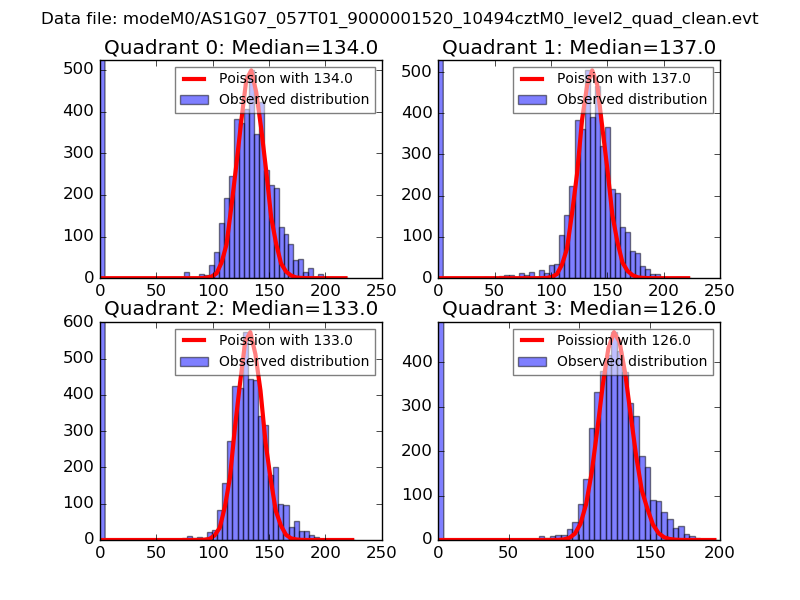 |
 |
| Quadrant-wise count rates Data is divided into 100 sec bins |
 |
|
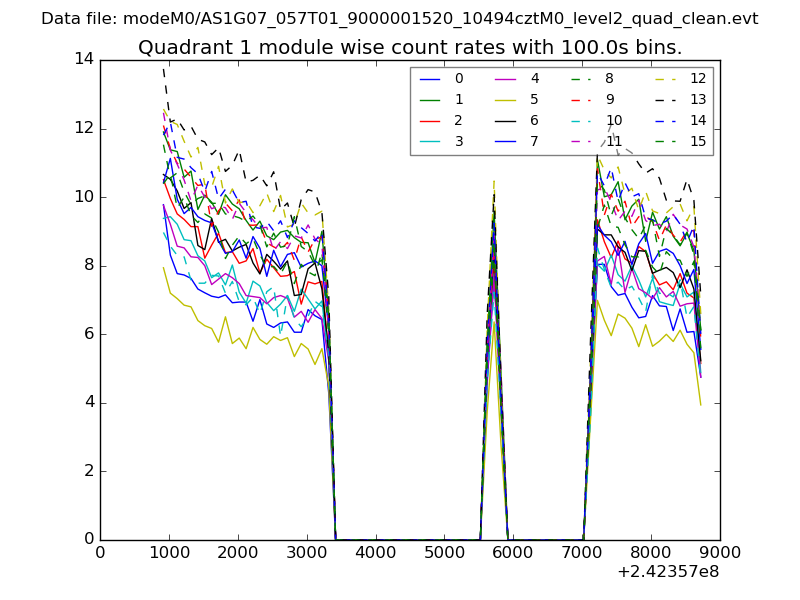
| Module-wise count rates for Quadrant A Data is divided into 100 sec bins |
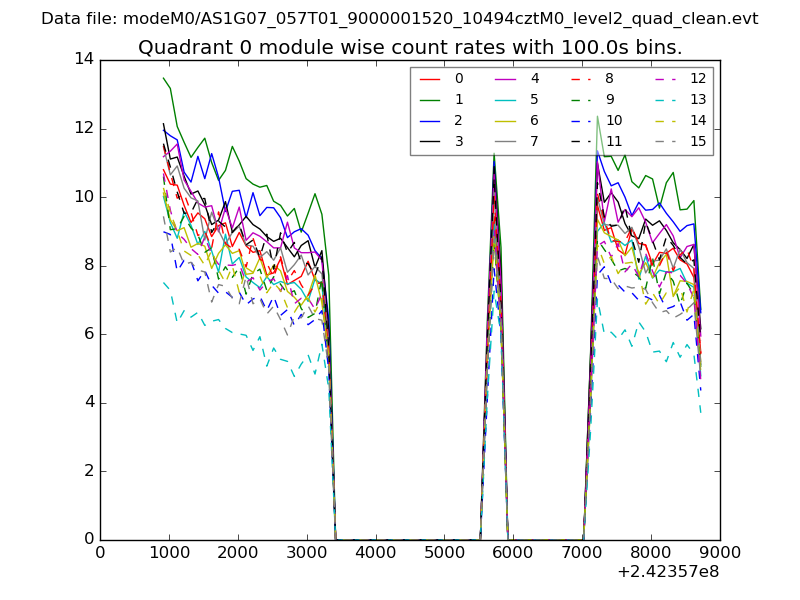 |
 |
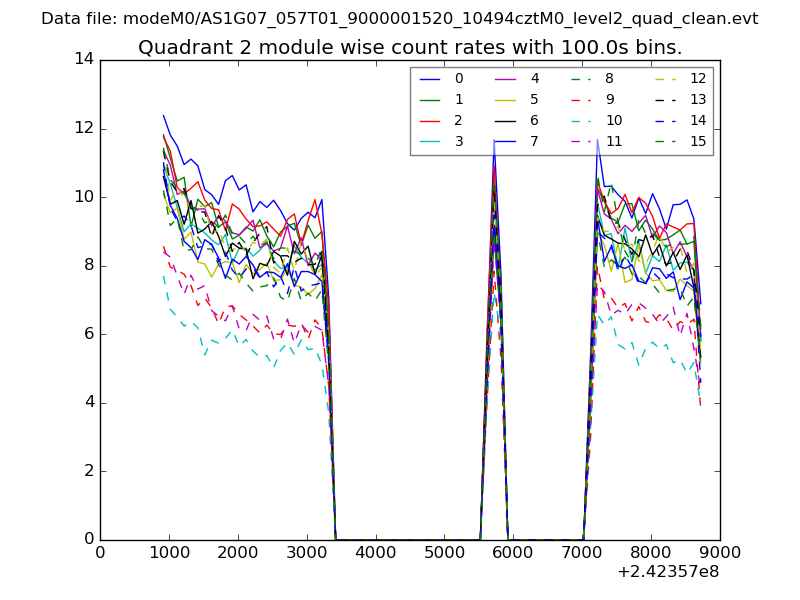
| Module-wise count rates for Quadrant B Data is divided into 100 sec bins |
 |
 |
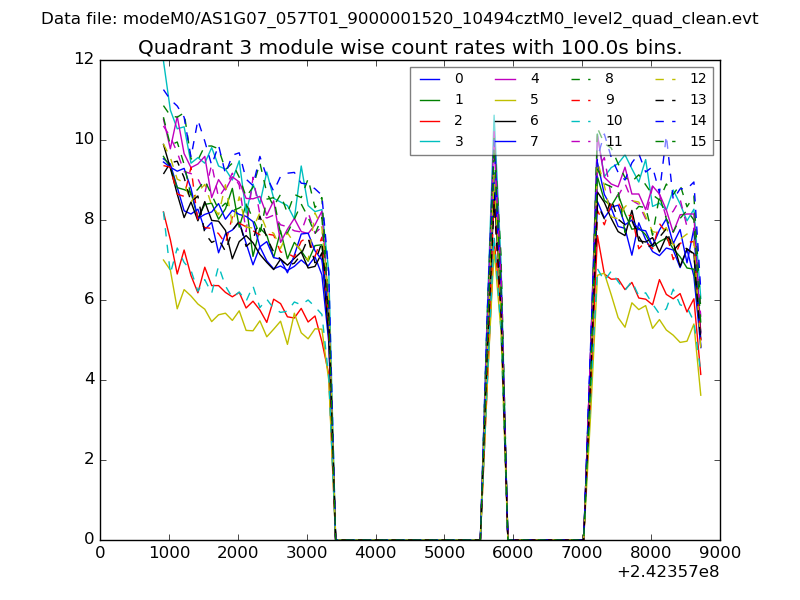
| Module-wise count rates for Quadrant C Data is divided into 100 sec bins |
 |
 |
| Module-wise count rates for Quadrant D Data is divided into 100 sec bins |
 |
 |
| Parameter | Plot |
|---|---|
| CZT HV Monitor | 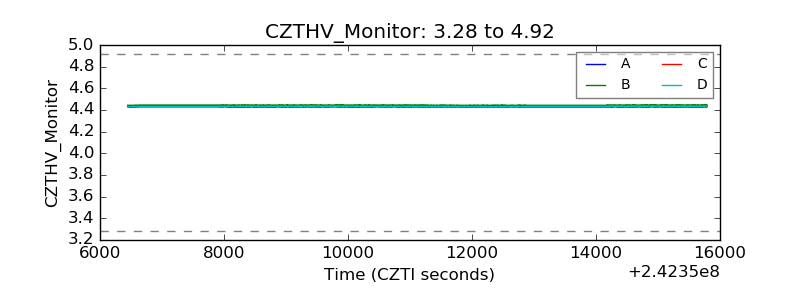 |
| D_VDD | 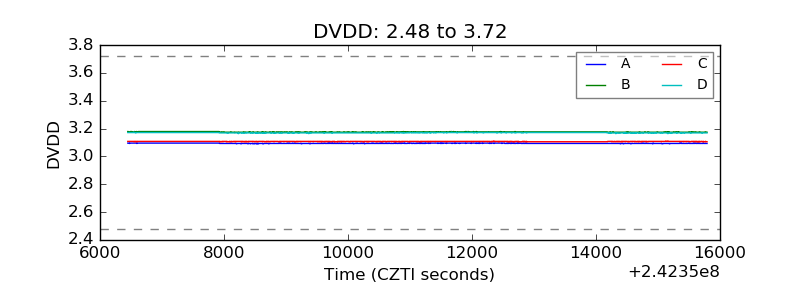 |
| Temperature 1 | 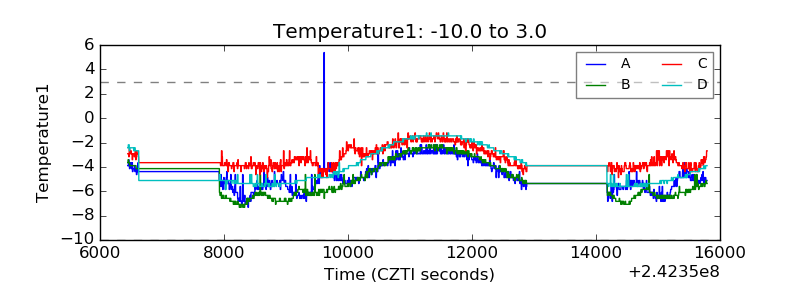 |
| Veto HV Monitor |  |
| Veto LLD | 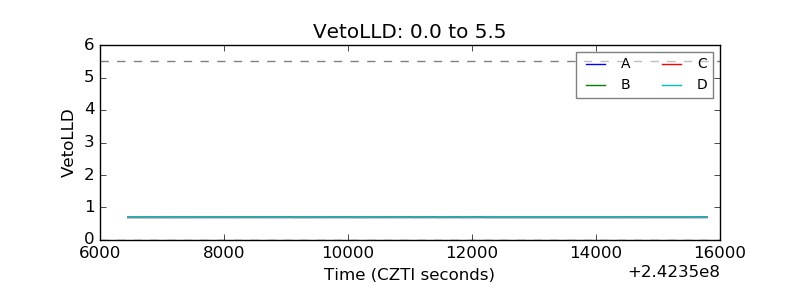 |
| Alpha Counter | 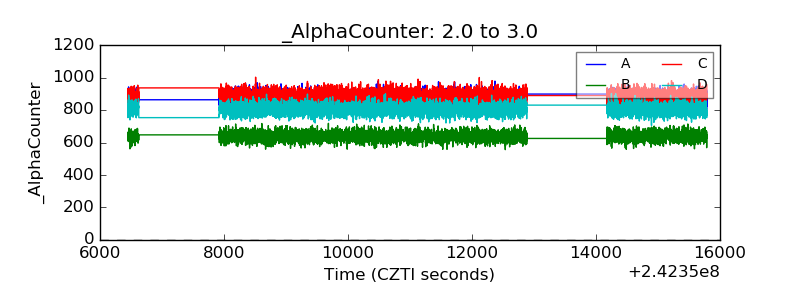 |
| _CPM_Rate | 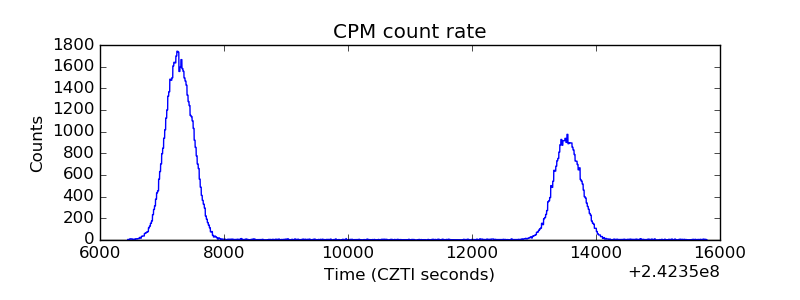 |
| CZT Counter | 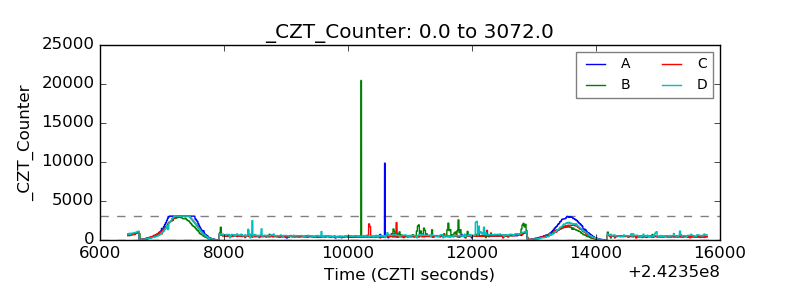 |
| +2.5 Volts monitor |  |
| +5 Volts monitor |  |
| _ROLL_ROT | 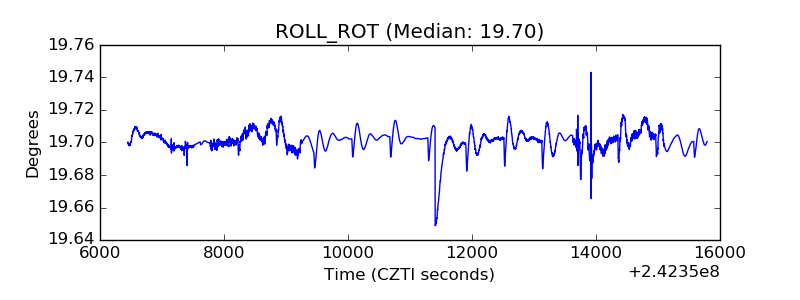 |
| _Roll_DEC | 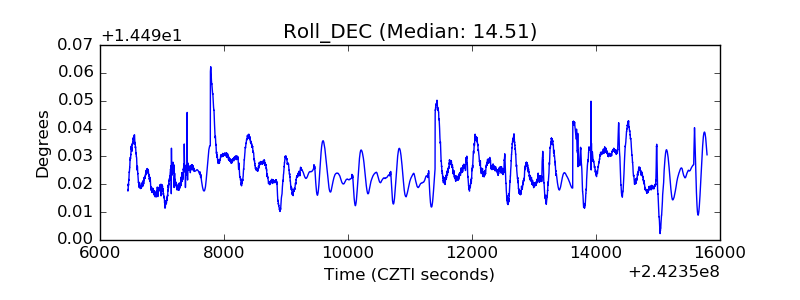 |
| _Roll_RA | 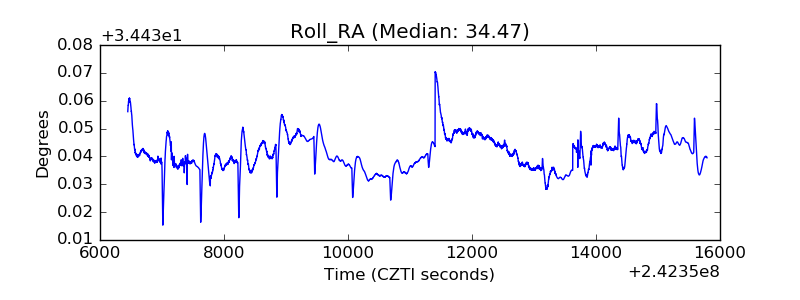 |
| Veto Counter | 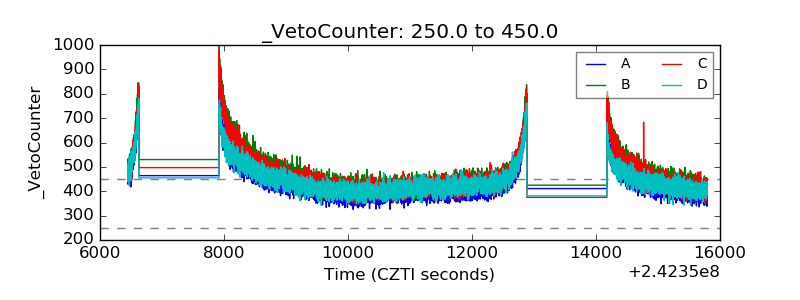 |