| Param | Original file | Final file |
|---|---|---|
| Filename | modeM0/AS1G07_057T01_9000001520_10498cztM0_level2.evt | modeM0/AS1G07_057T01_9000001520_10498cztM0_level2_quad_clean.evt |
| Size (bytes) | 432,351,360 | 66,807,360 |
| Size | 412.3 MB | 63.7 MB |
| Events in quadrant A | 3,042,425 | 387,857 |
| Events in quadrant B | 3,062,439 | 386,780 |
| Events in quadrant C | 2,792,776 | 389,466 |
| Events in quadrant D | 3,778,384 | 431,158 |
| Mode SS | |||
|---|---|---|---|
| Quadrant | BADHDUFLAG | Total packets | Discarded packets |
| A | 0 | 300 | 164 |
| B | 0 | 300 | 157 |
| C | 0 | 300 | 161 |
| D | 0 | 289 | 148 |
| Mode M9 | |||
|---|---|---|---|
| Quadrant | BADHDUFLAG | Total packets | Discarded packets |
| A | 0 | 1 | 0 |
| B | 0 | 2 | 1 |
| C | 0 | 2 | 1 |
| D | 0 | 2 | 1 |
| Mode M0 | |||
|---|---|---|---|
| Quadrant | BADHDUFLAG | Total packets | Discarded packets |
| A | 0 | 30603 | 17793 |
| B | 0 | 35219 | 22496 |
| C | 0 | 30797 | 18276 |
| D | 0 | 38417 | 23064 |
| Quadrant | Total seconds | Saturated seconds | Saturation percentage |
|---|---|---|---|
| A | 6040 | 127 | 2.102649% |
| B | 5759 | 133 | 2.309429% |
| C | 6075 | 90 | 1.481481% |
| D | 6520 | 113 | 1.733129% |
Noise dominated data is calculated using 1-second bins in cleaned event files. If a bin has >2000 counts, and if more than 50% of those come from <1% of pixels, then it is considered to be noise-dominated and hence unusable.
| Quadrant | # 1 sec bins | Bins with >0 counts | Bins with >2000 counts | High rate bins dominated by noise | Noise dominated (total time) | Noise dominated (detector-on time) | Marked lightcurve |
|---|---|---|---|---|---|---|---|
| A | 7558 | 7129 | 0 | 0 | 0.00% | 0.00% | 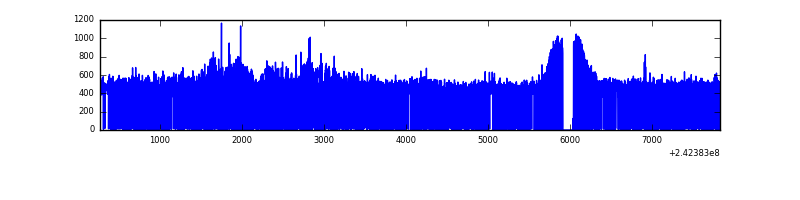 |
| B | 7557 | 6863 | 0 | 0 | 0.00% | 0.00% | 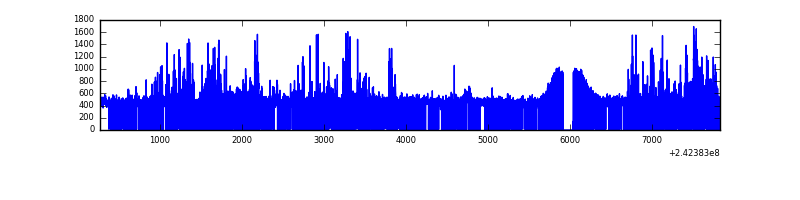 |
| C | 7558 | 7106 | 0 | 0 | 0.00% | 0.00% | 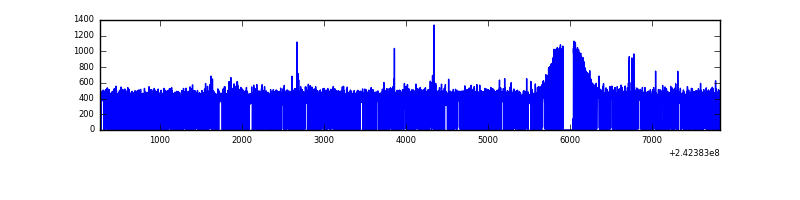 |
| D | 7558 | 6977 | 0 | 0 | 0.00% | 0.00% | 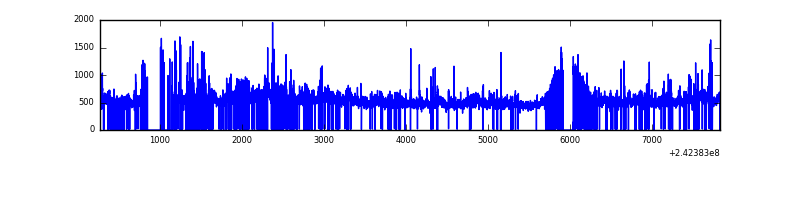 |
Top three noisy pixels from each quadrant. If the there are fewer than three noisy pixels in the level2.evt file, extra rows are filled as -1
| Pixel properties | Quadrant properties | ||||||
|---|---|---|---|---|---|---|---|
| Quadrant | DetID | PixID | Counts | Sigma | Mean | Median | Sigma |
| A | 15 | 239 | 156548 | 1045.05 | 725 | 711 | 149.1 |
| A | 3 | 80 | 70724 | 469.51 | 725 | 711 | 149.1 |
| A | 5 | 16 | 13494 | 85.72 | 725 | 711 | 149.1 |
| B | 4 | 239 | 250385 | 1843.07 | 694 | 678 | 135.5 |
| B | 0 | 214 | 55105 | 401.72 | 694 | 678 | 135.5 |
| B | 11 | 51 | 20671 | 147.57 | 694 | 678 | 135.5 |
| C | 14 | 234 | 14160 | 80.15 | 708 | 712 | 167.8 |
| C | 8 | 128 | 9285 | 51.1 | 708 | 712 | 167.8 |
| C | 8 | 112 | 5400 | 27.94 | 708 | 712 | 167.8 |
| D | 1 | 20 | 365723 | 1954.53 | 762 | 742 | 186.7 |
| D | 2 | 16 | 161257 | 859.58 | 762 | 742 | 186.7 |
| D | 8 | 195 | 160876 | 857.54 | 762 | 742 | 186.7 |
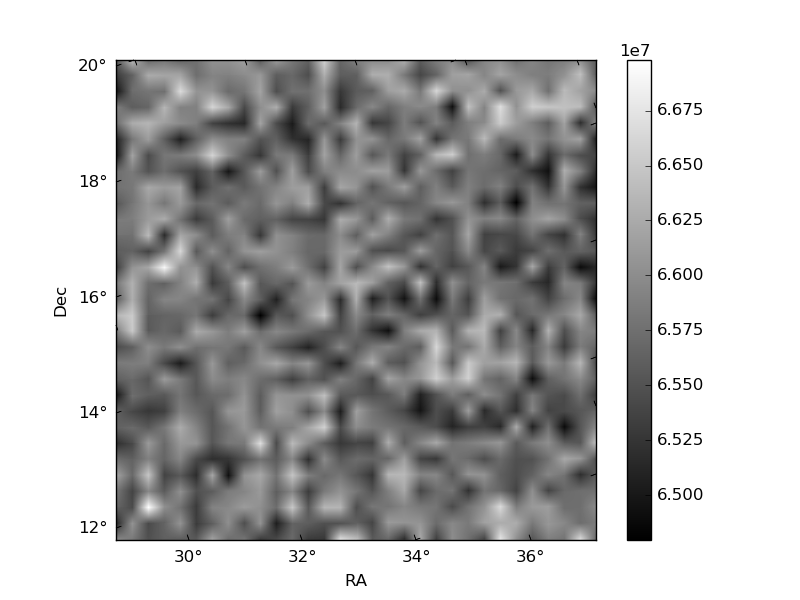
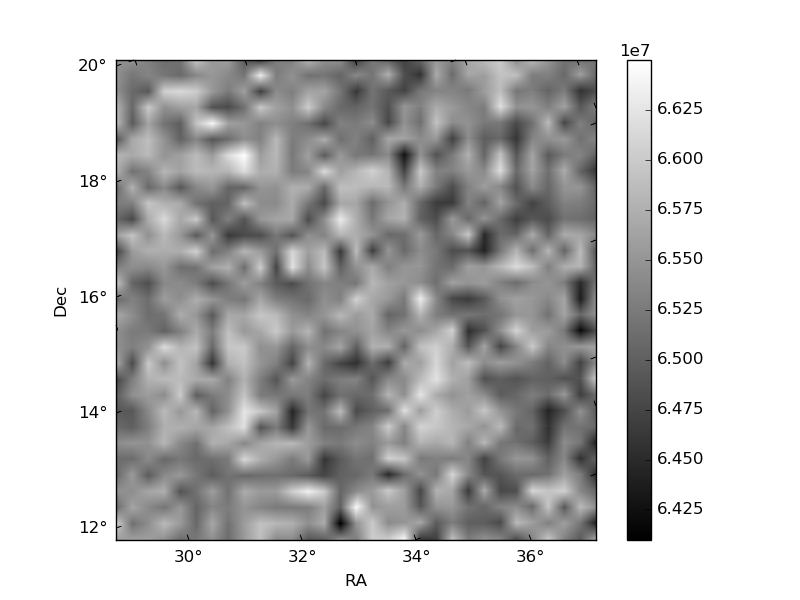
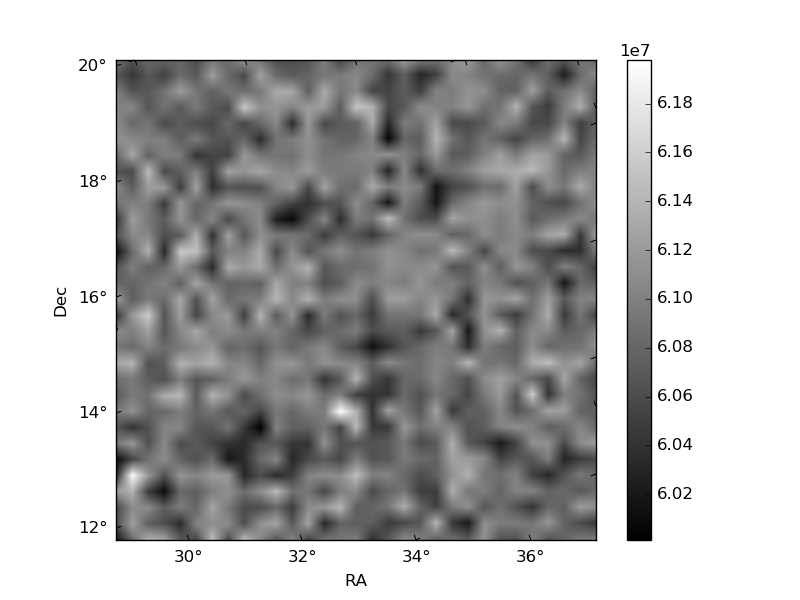
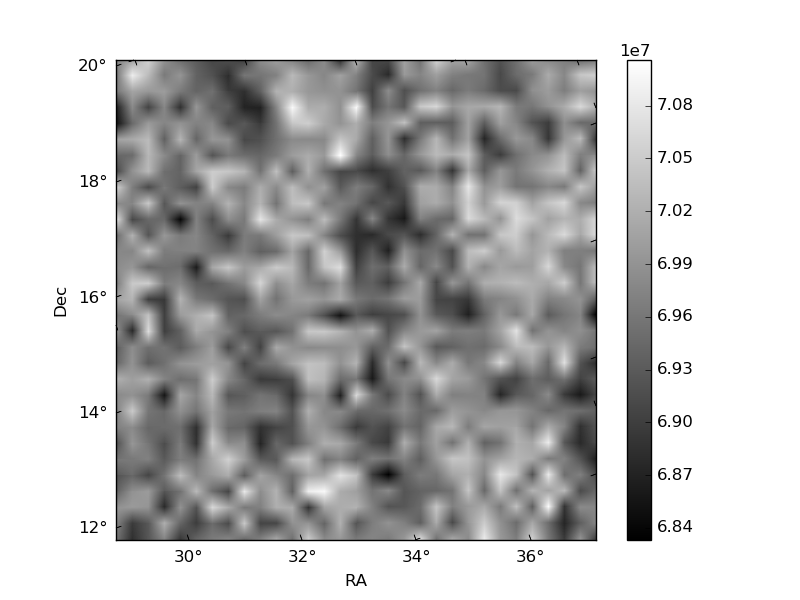
Histogram calculated using DETX and DETY for each event in the final _common_clean file
| Quadrant A | 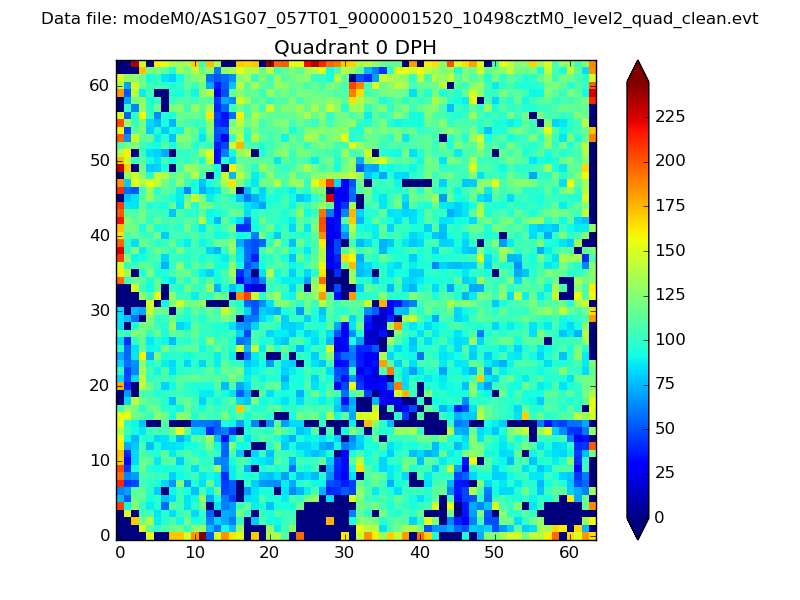 |
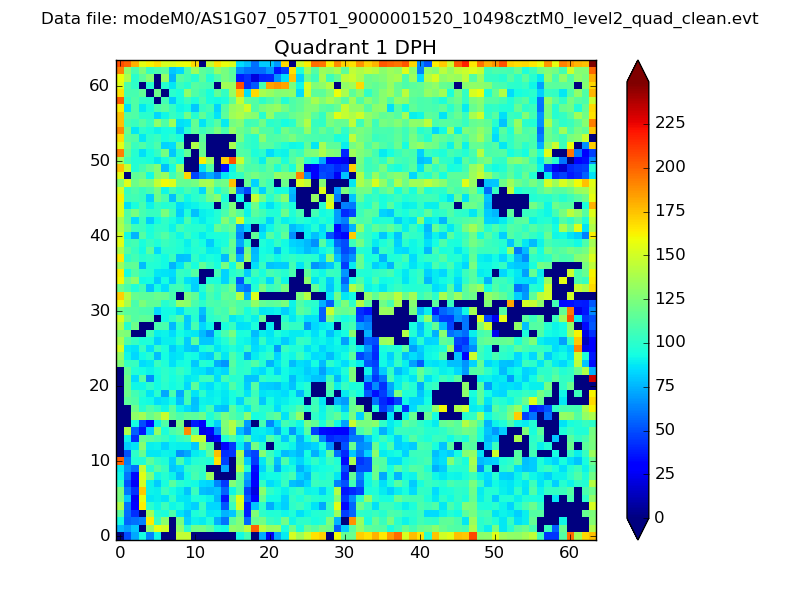 |
Quadrant B |
|---|---|---|---|
| Quadrant D | 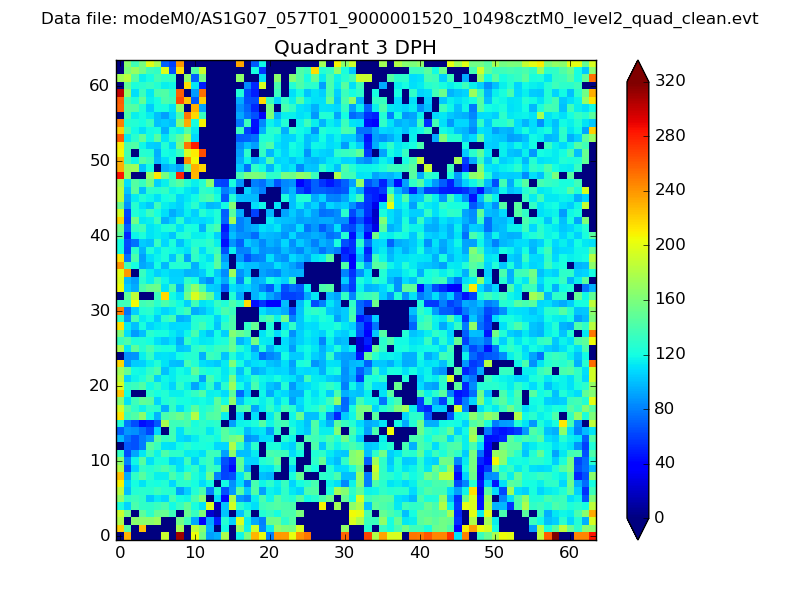 |
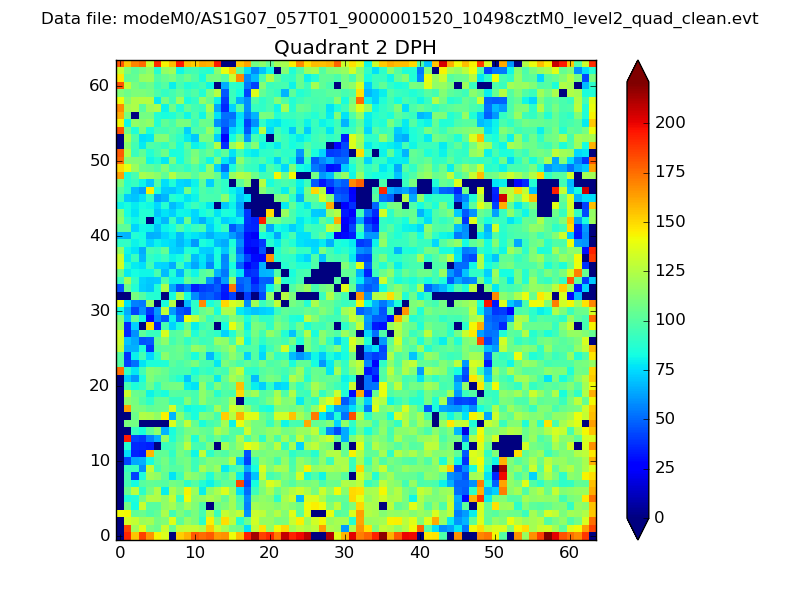 |
Quadrant C |
| Plot type | Count rate plots | Images |
|---|---|---|
| Comparison with Poisson distribution Blue bars denote a histogram of data divided into 1 sec bins. Red curve is a Poisson curve with rate = median count rate of data. |
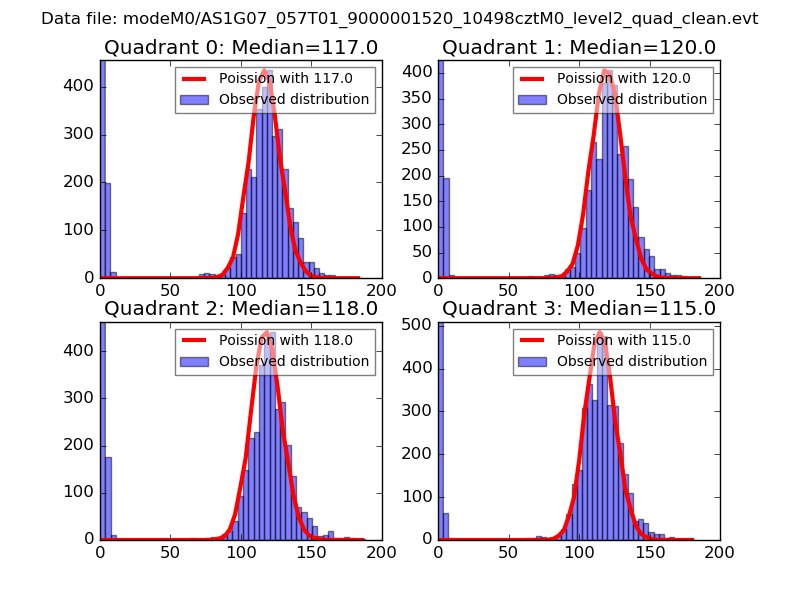 |
 |
| Quadrant-wise count rates Data is divided into 100 sec bins |
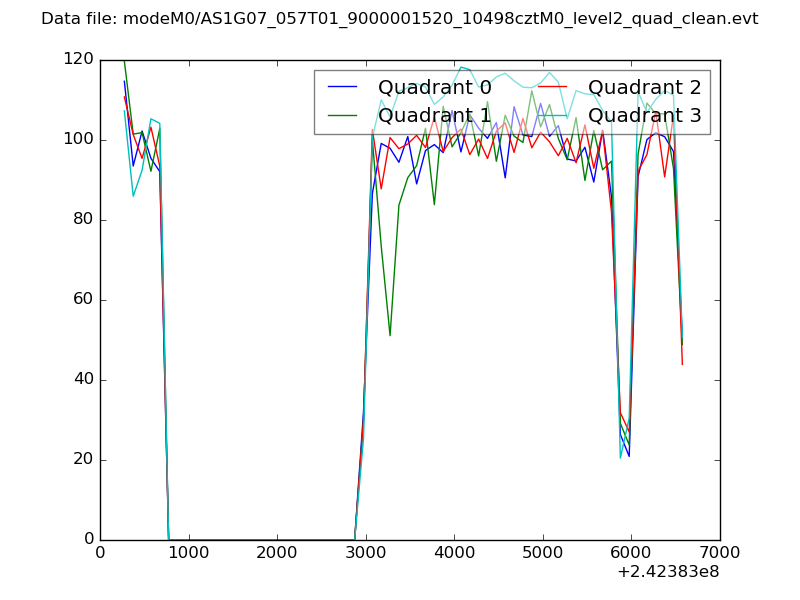 |
|
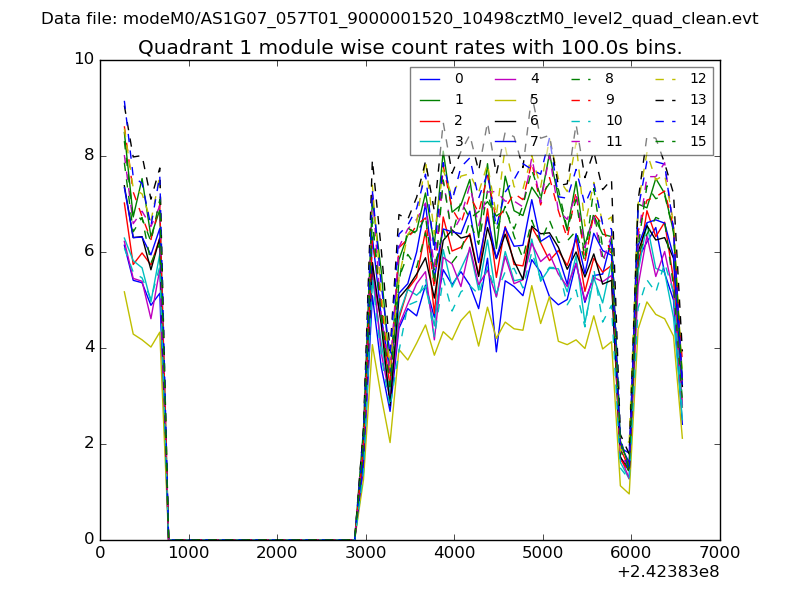
| Module-wise count rates for Quadrant A Data is divided into 100 sec bins |
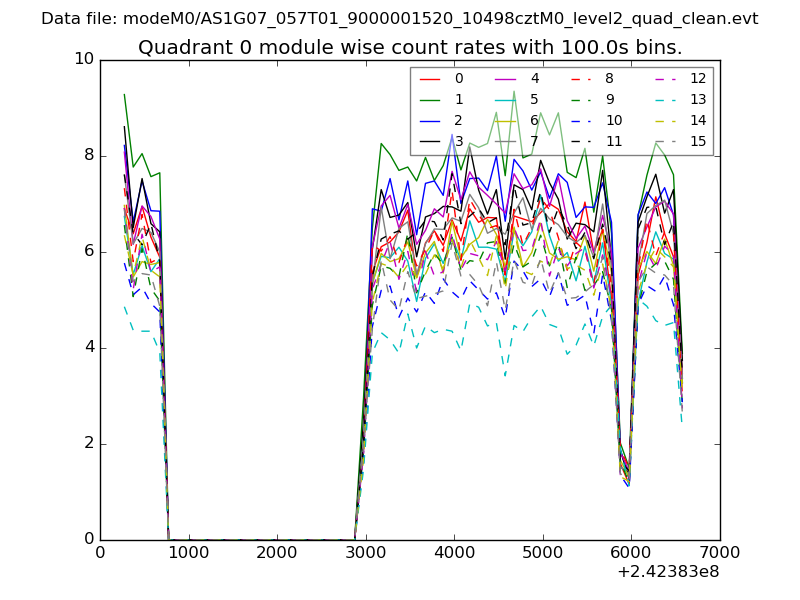 |
 |
| Module-wise count rates for Quadrant B Data is divided into 100 sec bins |
 |
 |
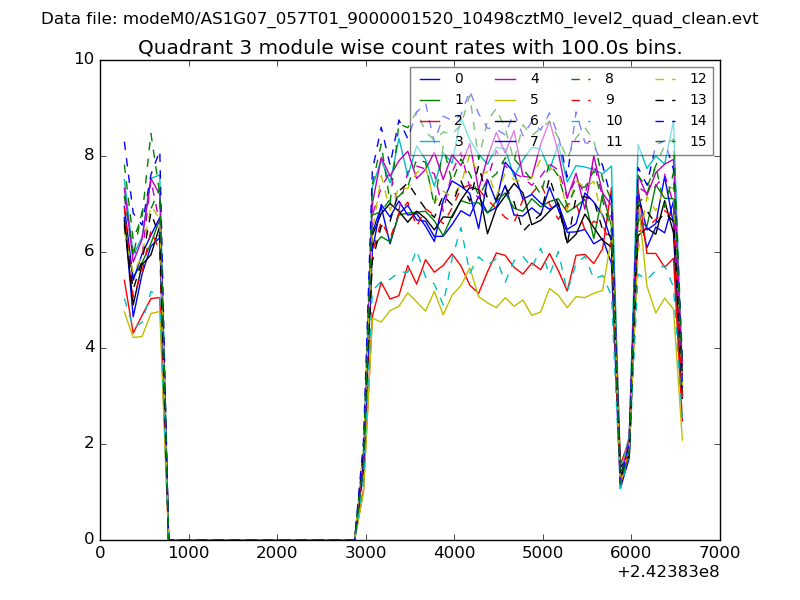
| Module-wise count rates for Quadrant C Data is divided into 100 sec bins |
 |
 |
| Module-wise count rates for Quadrant D Data is divided into 100 sec bins |
 |
 |
| Parameter | Plot |
|---|---|
| CZT HV Monitor |  |
| D_VDD | 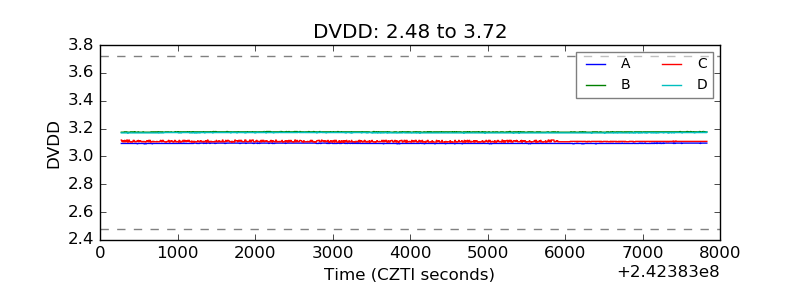 |
| Temperature 1 | 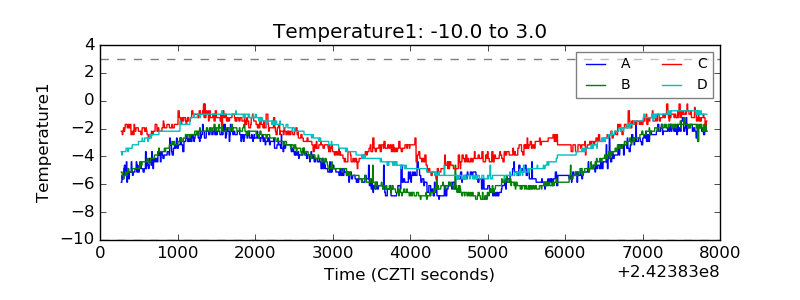 |
| Veto HV Monitor | 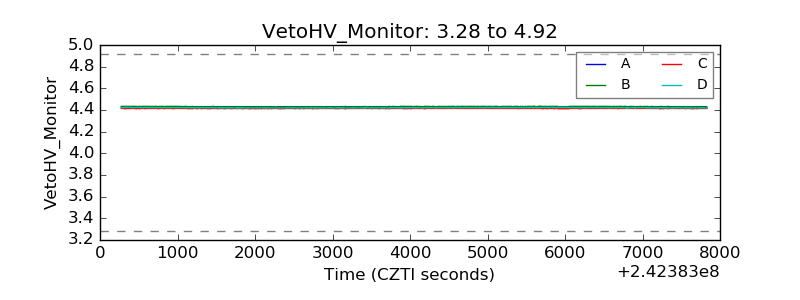 |
| Veto LLD |  |
| Alpha Counter | 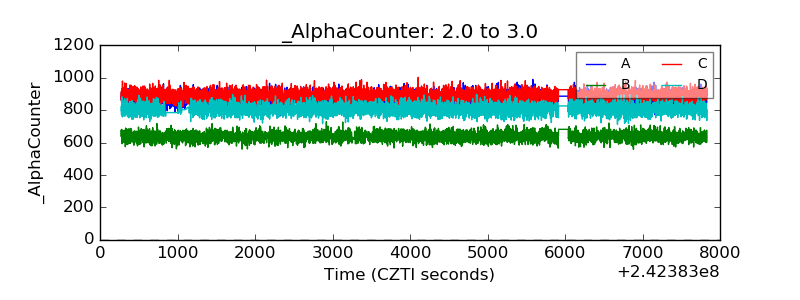 |
| _CPM_Rate | 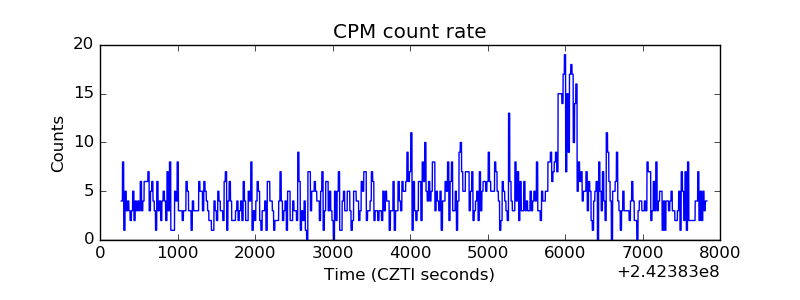 |
| CZT Counter |  |
| +2.5 Volts monitor |  |
| +5 Volts monitor | 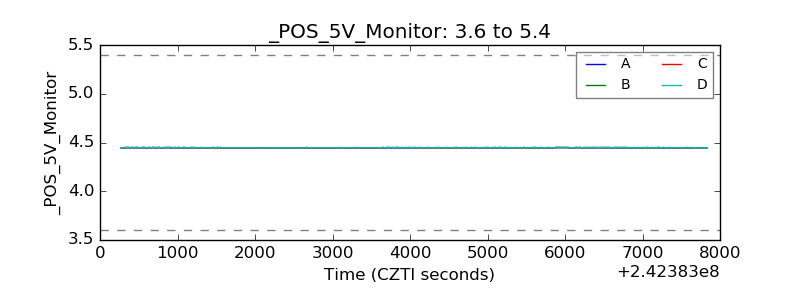 |
| _ROLL_ROT |  |
| _Roll_DEC | 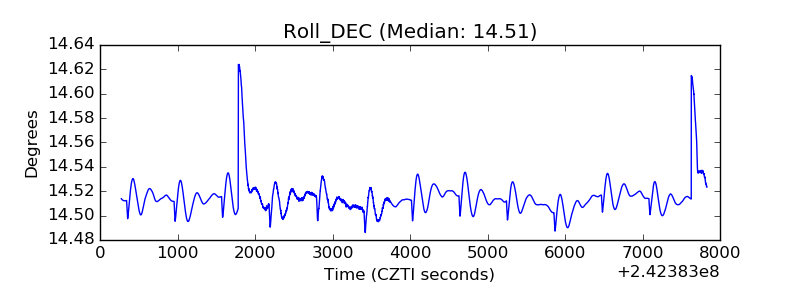 |
| _Roll_RA |  |
| Veto Counter | 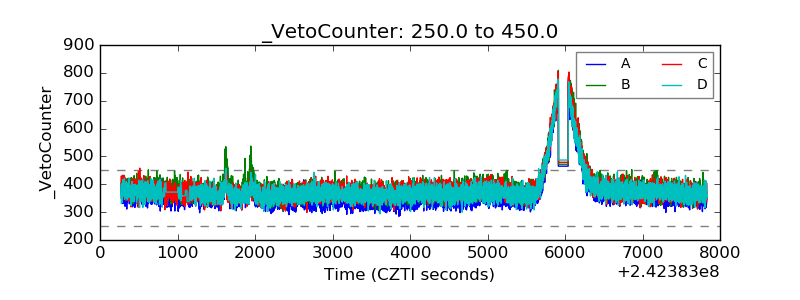 |