| Param | Original file | Final file |
|---|---|---|
| Filename | modeM0/AS1G07_057T01_9000001520_10499cztM0_level2.evt | modeM0/AS1G07_057T01_9000001520_10499cztM0_level2_quad_clean.evt |
| Size (bytes) | 380,283,840 | 46,494,720 |
| Size | 362.7 MB | 44.3 MB |
| Events in quadrant A | 2,616,053 | 253,273 |
| Events in quadrant B | 2,711,853 | 261,021 |
| Events in quadrant C | 2,477,359 | 261,090 |
| Events in quadrant D | 3,347,344 | 258,855 |
| Mode SS | |||
|---|---|---|---|
| Quadrant | BADHDUFLAG | Total packets | Discarded packets |
| A | 0 | 310 | 182 |
| B | 0 | 310 | 199 |
| C | 0 | 307 | 187 |
| D | 0 | 305 | 183 |
| Mode M9 | |||
|---|---|---|---|
| Quadrant | BADHDUFLAG | Total packets | Discarded packets |
| A | 0 | 7 | 3 |
| B | 0 | 7 | 3 |
| C | 0 | 7 | 3 |
| D | 0 | 6 | 2 |
| Mode M0 | |||
|---|---|---|---|
| Quadrant | BADHDUFLAG | Total packets | Discarded packets |
| A | 0 | 30415 | 19398 |
| B | 0 | 36686 | 25527 |
| C | 0 | 31356 | 20400 |
| D | 0 | 37490 | 24013 |
| Quadrant | Total seconds | Saturated seconds | Saturation percentage |
|---|---|---|---|
| A | 5299 | 137 | 2.585393% |
| B | 4998 | 151 | 3.021208% |
| C | 5279 | 111 | 2.102671% |
| D | 5634 | 156 | 2.768903% |
Noise dominated data is calculated using 1-second bins in cleaned event files. If a bin has >2000 counts, and if more than 50% of those come from <1% of pixels, then it is considered to be noise-dominated and hence unusable.
| Quadrant | # 1 sec bins | Bins with >0 counts | Bins with >2000 counts | High rate bins dominated by noise | Noise dominated (total time) | Noise dominated (detector-on time) | Marked lightcurve |
|---|---|---|---|---|---|---|---|
| A | 8263 | 6447 | 0 | 0 | 0.00% | 0.00% |  |
| B | 8263 | 6198 | 1 | 1 | 0.01% | 0.02% | 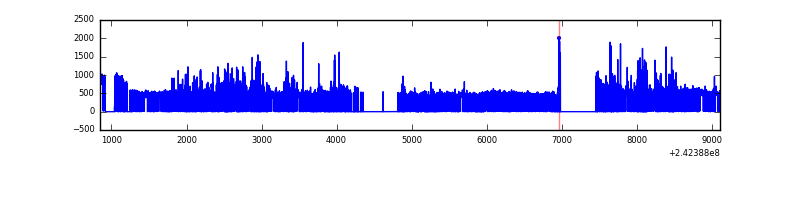 |
| C | 8263 | 6442 | 0 | 0 | 0.00% | 0.00% | 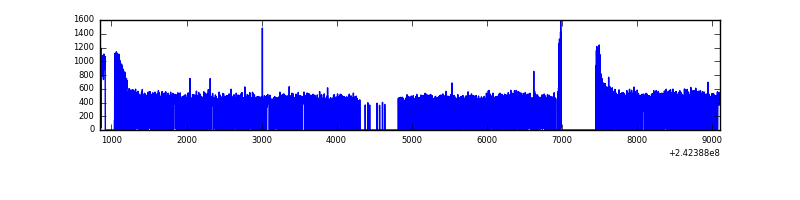 |
| D | 8263 | 6434 | 3 | 3 | 0.04% | 0.05% | 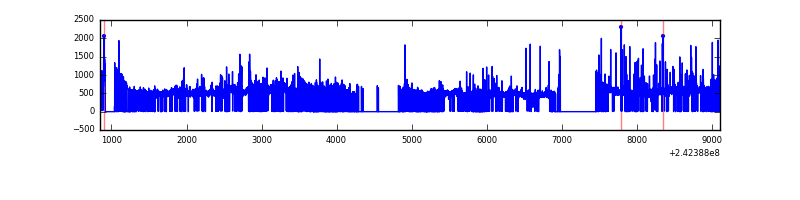 |
Top three noisy pixels from each quadrant. If the there are fewer than three noisy pixels in the level2.evt file, extra rows are filled as -1
| Pixel properties | Quadrant properties | ||||||
|---|---|---|---|---|---|---|---|
| Quadrant | DetID | PixID | Counts | Sigma | Mean | Median | Sigma |
| A | 3 | 80 | 72132 | 521.47 | 655 | 640 | 137.1 |
| A | 5 | 16 | 9775 | 66.63 | 655 | 640 | 137.1 |
| A | 0 | 226 | 6014 | 39.2 | 655 | 640 | 137.1 |
| B | 4 | 239 | 199231 | 1639.37 | 617 | 602 | 121.2 |
| B | 0 | 214 | 45845 | 373.41 | 617 | 602 | 121.2 |
| B | 11 | 51 | 36680 | 297.77 | 617 | 602 | 121.2 |
| C | 14 | 234 | 7964 | 48.72 | 632 | 636 | 150.4 |
| C | 13 | 61 | 4772 | 27.5 | 632 | 636 | 150.4 |
| C | 1 | 3 | 2915 | 15.15 | 632 | 636 | 150.4 |
| D | 1 | 20 | 296447 | 1813.01 | 670 | 653 | 163.2 |
| D | 2 | 16 | 187745 | 1146.74 | 670 | 653 | 163.2 |
| D | 1 | 52 | 147620 | 900.81 | 670 | 653 | 163.2 |
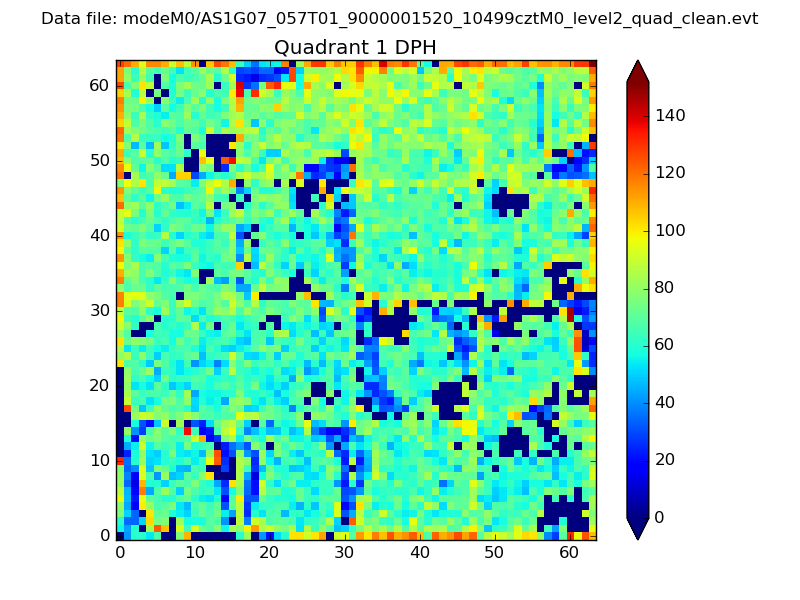
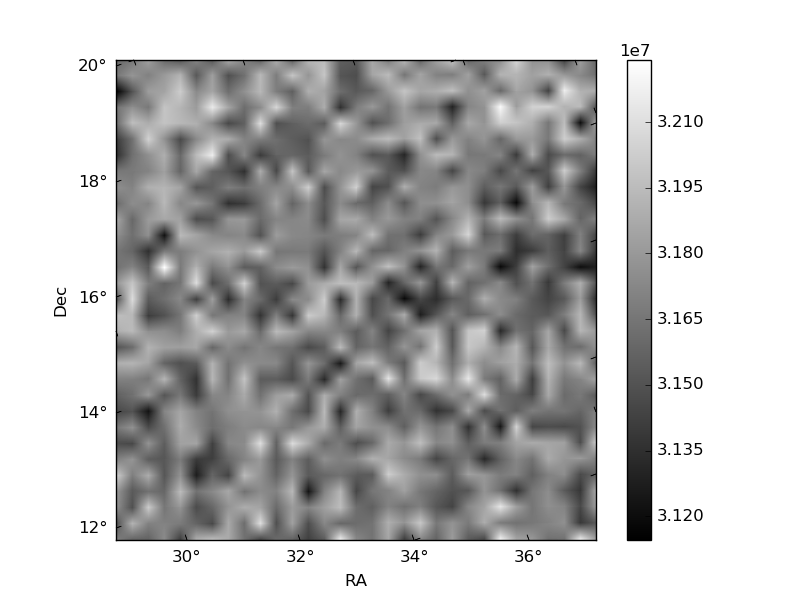
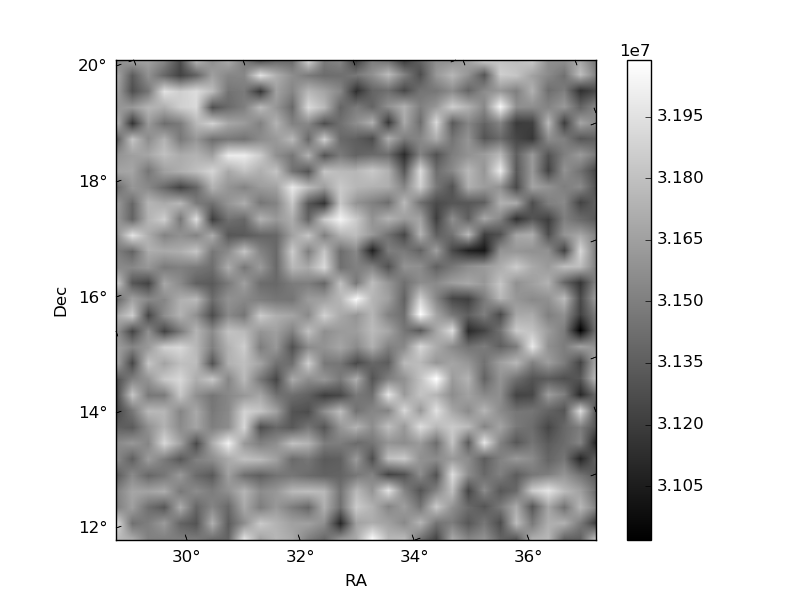
Histogram calculated using DETX and DETY for each event in the final _common_clean file
| Quadrant A | 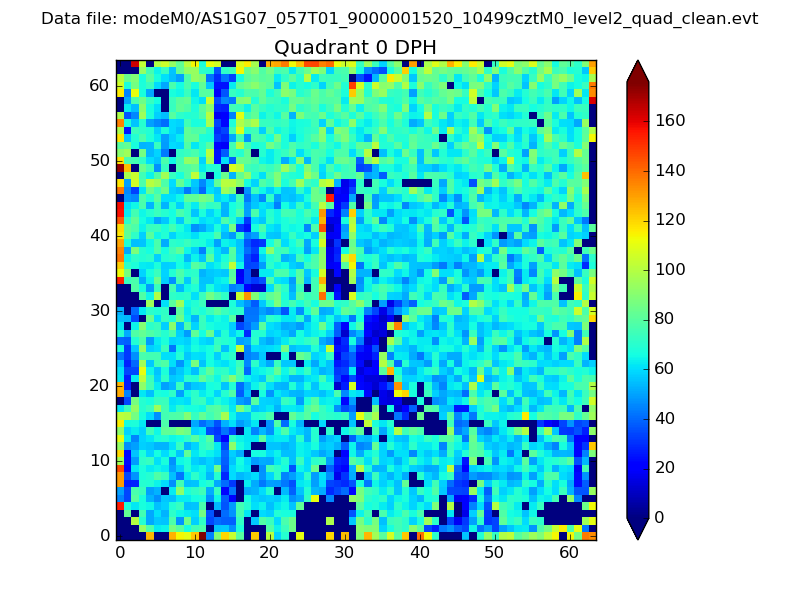 |
 |
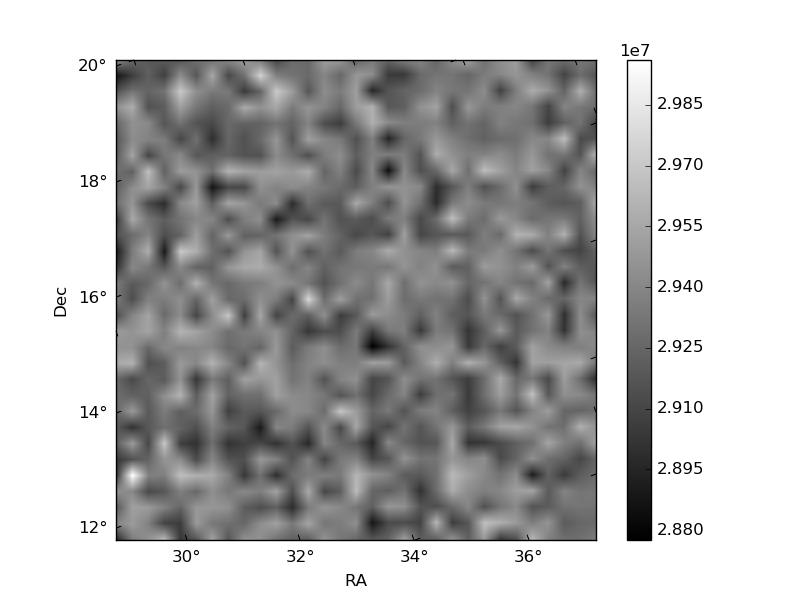
Quadrant B |
|---|---|---|---|
| Quadrant D | 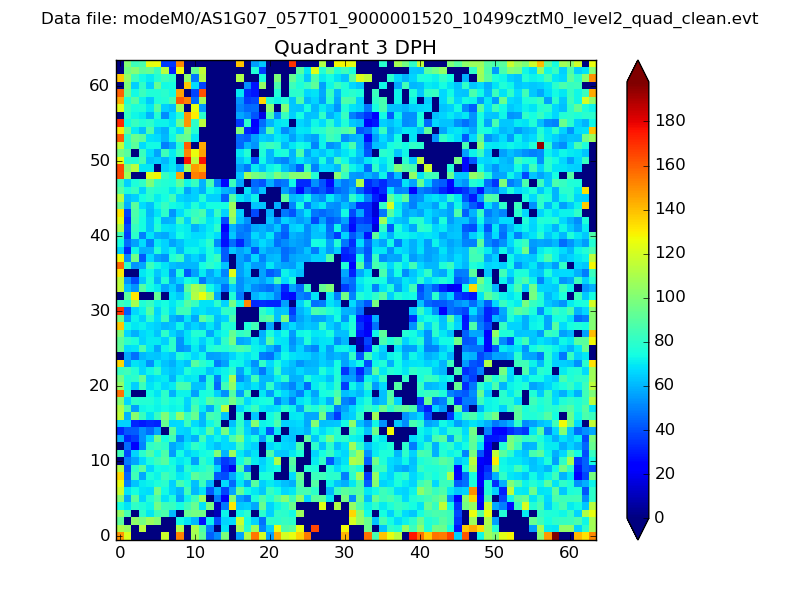 |
 |
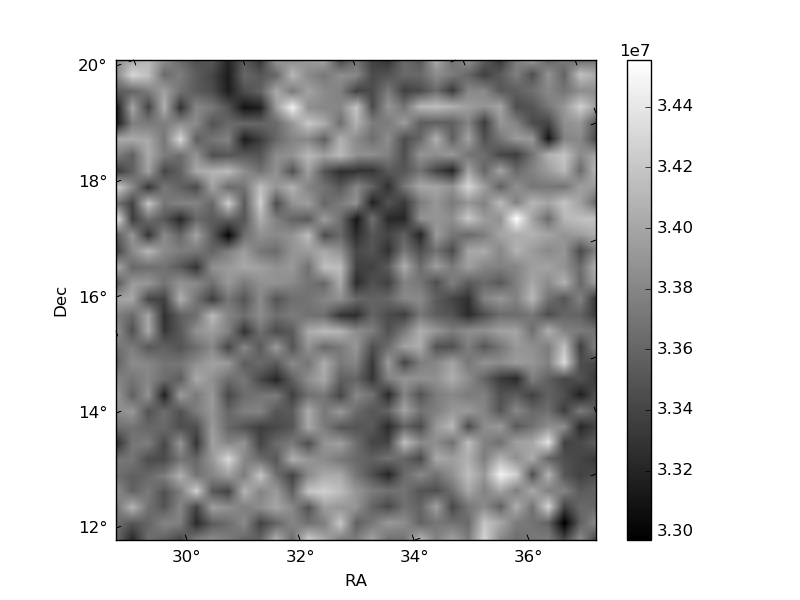
Quadrant C |
| Plot type | Count rate plots | Images |
|---|---|---|
| Comparison with Poisson distribution Blue bars denote a histogram of data divided into 1 sec bins. Red curve is a Poisson curve with rate = median count rate of data. |
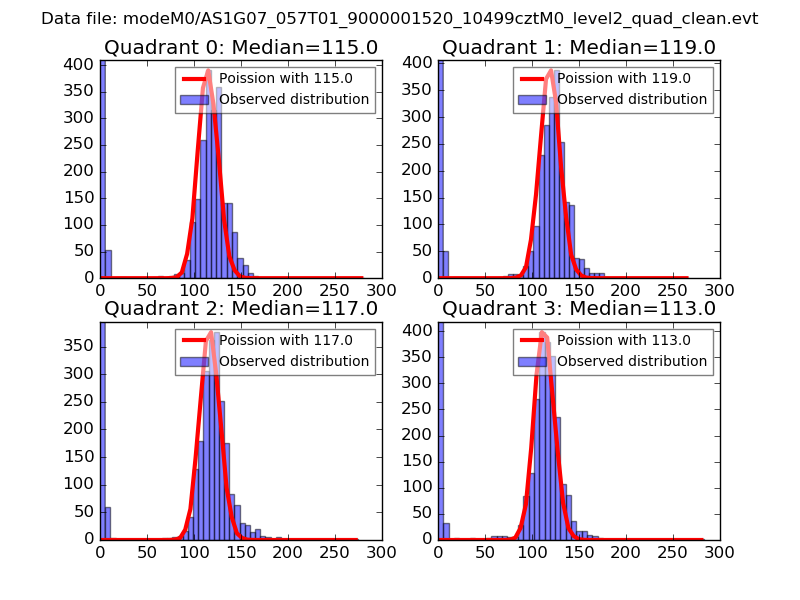 |
 |
| Quadrant-wise count rates Data is divided into 100 sec bins |
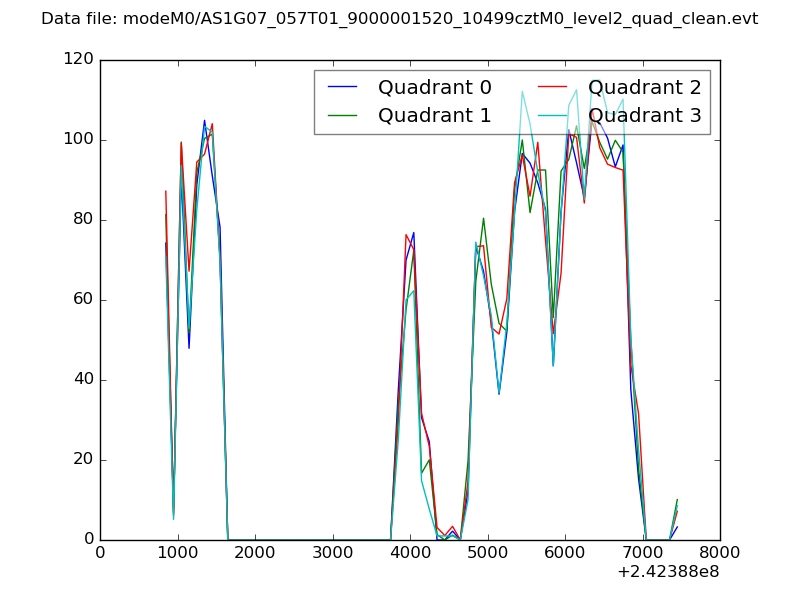 |
|
| Module-wise count rates for Quadrant A Data is divided into 100 sec bins |
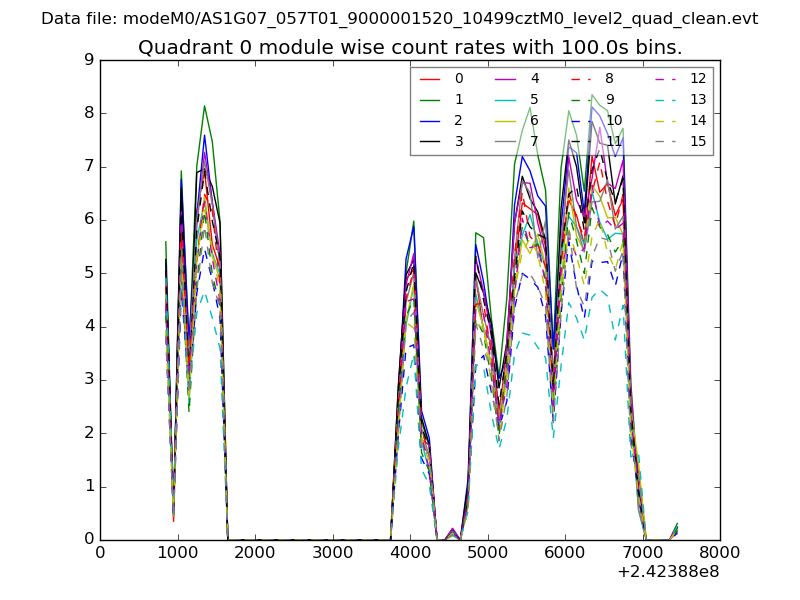 |
 |
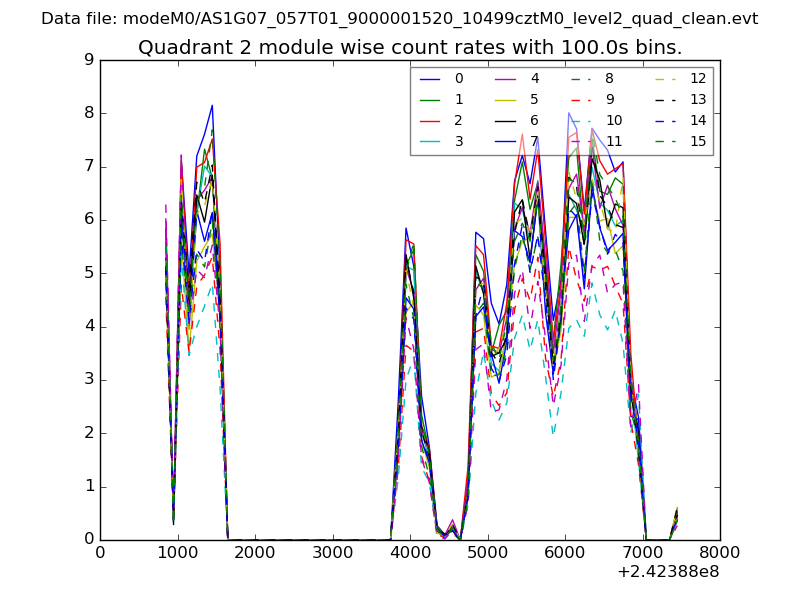
| Module-wise count rates for Quadrant B Data is divided into 100 sec bins |
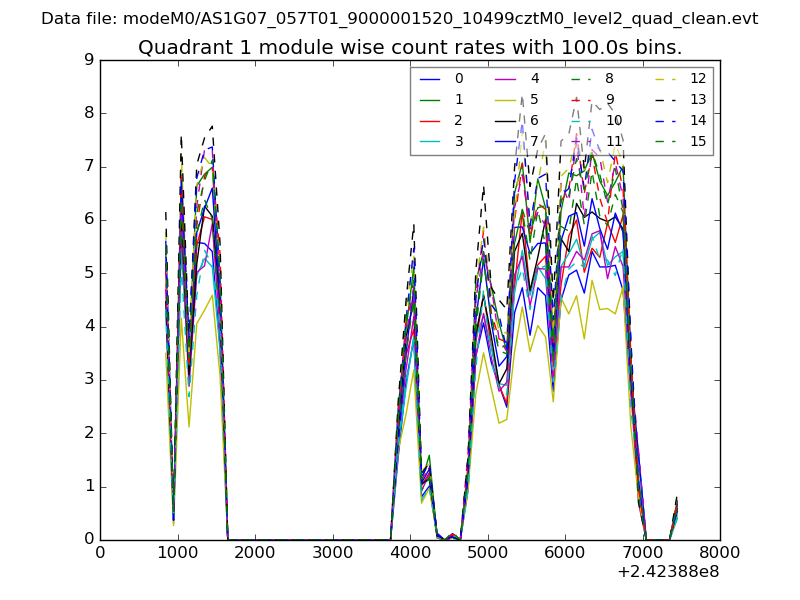 |
 |
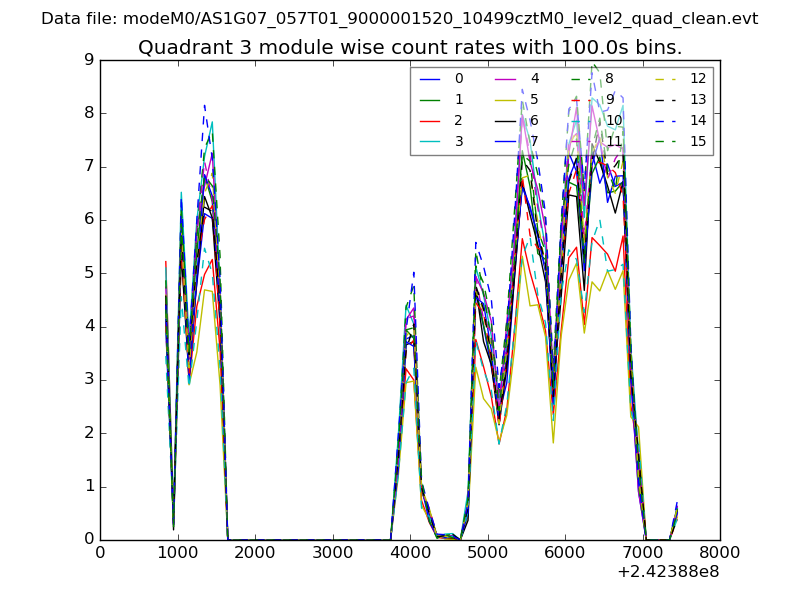
| Module-wise count rates for Quadrant C Data is divided into 100 sec bins |
 |
 |
| Module-wise count rates for Quadrant D Data is divided into 100 sec bins |
 |
 |
| Parameter | Plot |
|---|---|
| CZT HV Monitor | 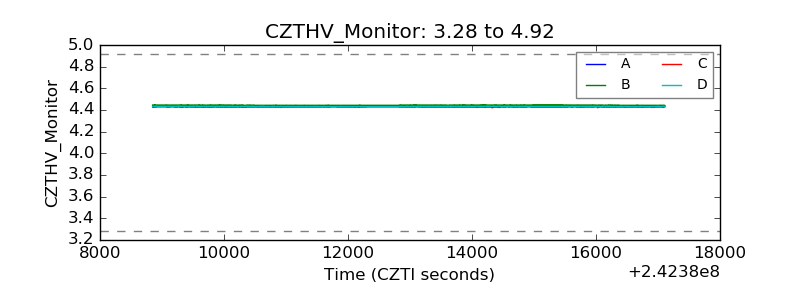 |
| D_VDD | 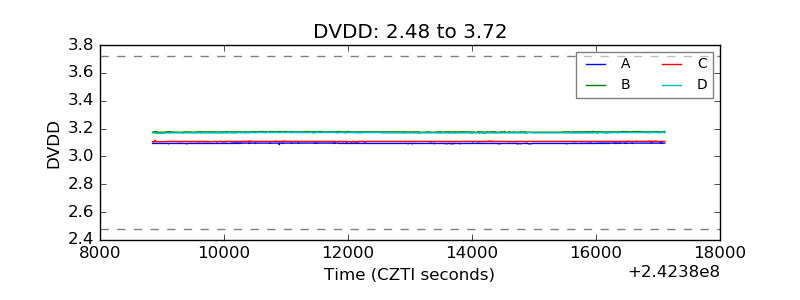 |
| Temperature 1 | 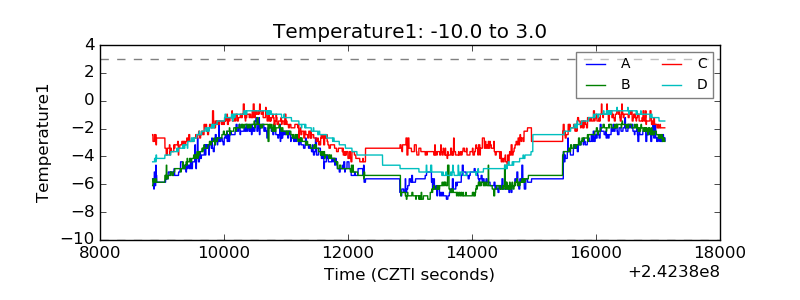 |
| Veto HV Monitor | 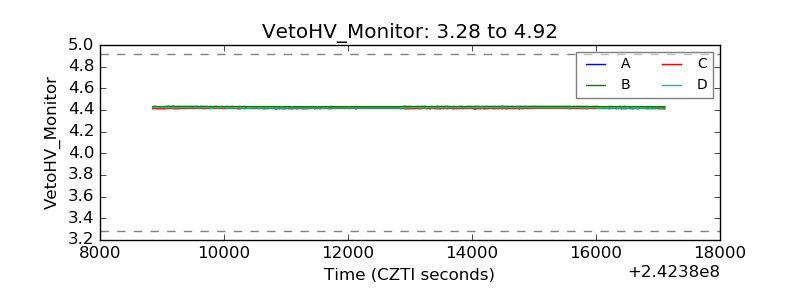 |
| Veto LLD | 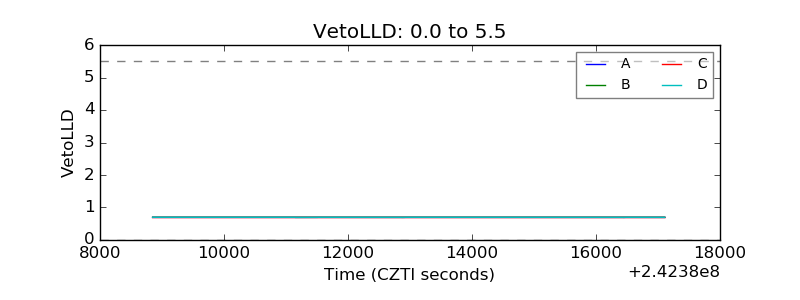 |
| Alpha Counter | 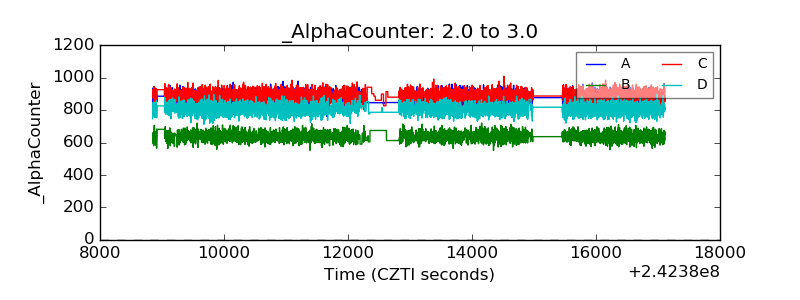 |
| _CPM_Rate | 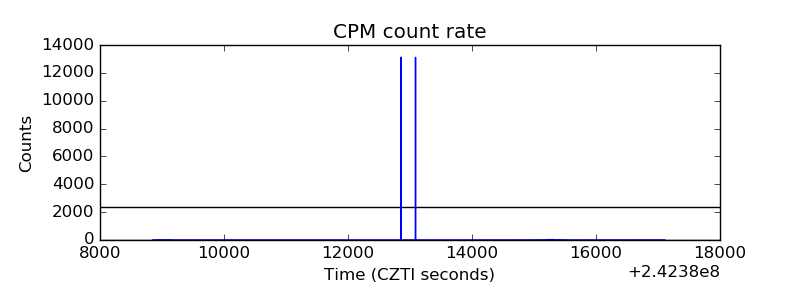 |
| CZT Counter |  |
| +2.5 Volts monitor |  |
| +5 Volts monitor | 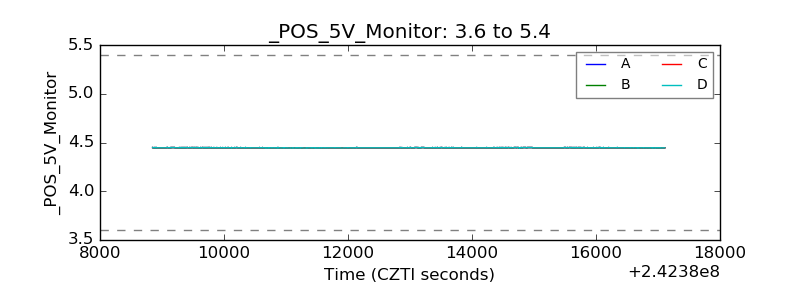 |
| _ROLL_ROT | 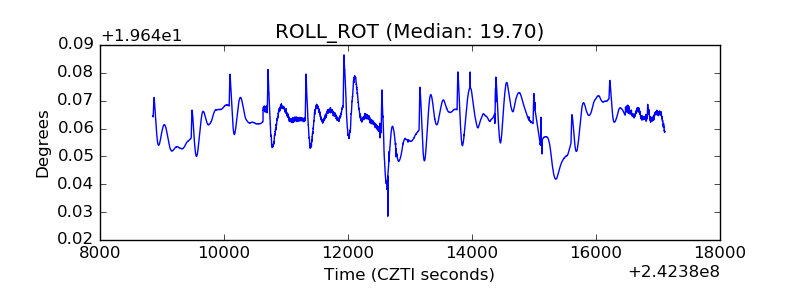 |
| _Roll_DEC | 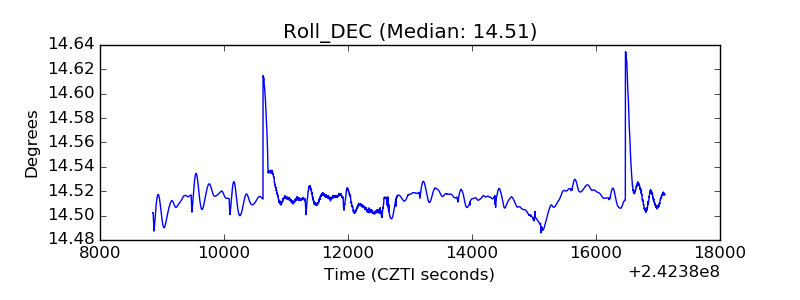 |
| _Roll_RA | 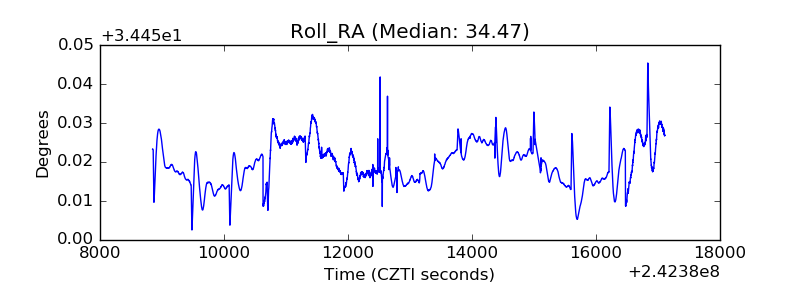 |
| Veto Counter | 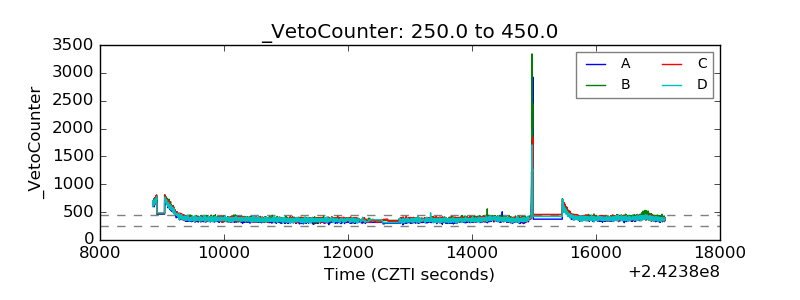 |