| Param | Original file | Final file |
|---|---|---|
| Filename | modeM0/AS1G07_057T01_9000001520_10502cztM0_level2.evt | modeM0/AS1G07_057T01_9000001520_10502cztM0_level2_quad_clean.evt |
| Size (bytes) | 179,412,480 | 12,401,280 |
| Size | 171.1 MB | 11.8 MB |
| Events in quadrant A | 1,107,068 | 53,927 |
| Events in quadrant B | 1,477,091 | 52,856 |
| Events in quadrant C | 1,026,458 | 53,261 |
| Events in quadrant D | 1,666,747 | 51,200 |
| Mode SS | |||
|---|---|---|---|
| Quadrant | BADHDUFLAG | Total packets | Discarded packets |
| A | 0 | 46 | 0 |
| B | 0 | 46 | 0 |
| C | 0 | 46 | 0 |
| D | 0 | 46 | 0 |
| Mode M0 | |||
|---|---|---|---|
| Quadrant | BADHDUFLAG | Total packets | Discarded packets |
| A | 0 | 4641 | 0 |
| B | 0 | 5826 | 0 |
| C | 0 | 4541 | 2 |
| D | 0 | 6420 | 0 |
| Quadrant | Total seconds | Saturated seconds | Saturation percentage |
|---|---|---|---|
| A | 2261 | 11 | 0.486510% |
| B | 2261 | 61 | 2.697921% |
| C | 2260 | 3 | 0.132743% |
| D | 2261 | 97 | 4.290137% |
Noise dominated data is calculated using 1-second bins in cleaned event files. If a bin has >2000 counts, and if more than 50% of those come from <1% of pixels, then it is considered to be noise-dominated and hence unusable.
| Quadrant | # 1 sec bins | Bins with >0 counts | Bins with >2000 counts | High rate bins dominated by noise | Noise dominated (total time) | Noise dominated (detector-on time) | Marked lightcurve |
|---|---|---|---|---|---|---|---|
| A | 2261 | 2261 | 5 | 5 | 0.22% | 0.22% |  |
| B | 2261 | 2261 | 36 | 36 | 1.59% | 1.59% |  |
| C | 2261 | 2261 | 0 | 0 | 0.00% | 0.00% |  |
| D | 2261 | 2261 | 60 | 60 | 2.65% | 2.65% |  |
Top three noisy pixels from each quadrant. If the there are fewer than three noisy pixels in the level2.evt file, extra rows are filled as -1
| Pixel properties | Quadrant properties | ||||||
|---|---|---|---|---|---|---|---|
| Quadrant | DetID | PixID | Counts | Sigma | Mean | Median | Sigma |
| A | 3 | 80 | 33172 | 572.02 | 271 | 265 | 57.5 |
| A | 5 | 16 | 23427 | 402.63 | 271 | 265 | 57.5 |
| A | 3 | 1 | 2818 | 44.38 | 271 | 265 | 57.5 |
| B | 4 | 239 | 348912 | 6478.43 | 270 | 264 | 53.8 |
| B | 11 | 51 | 33326 | 614.34 | 270 | 264 | 53.8 |
| B | 0 | 214 | 25505 | 469.02 | 270 | 264 | 53.8 |
| C | 14 | 234 | 2639 | 37.5 | 262 | 264 | 63.3 |
| C | 13 | 61 | 2049 | 28.18 | 262 | 264 | 63.3 |
| C | 8 | 222 | 1090 | 13.04 | 262 | 264 | 63.3 |
| D | 1 | 52 | 357895 | 5511.18 | 259 | 252 | 64.9 |
| D | 2 | 16 | 121212 | 1863.96 | 259 | 252 | 64.9 |
| D | 1 | 20 | 72846 | 1118.65 | 259 | 252 | 64.9 |
Histogram calculated using DETX and DETY for each event in the final _common_clean file
| Quadrant A | 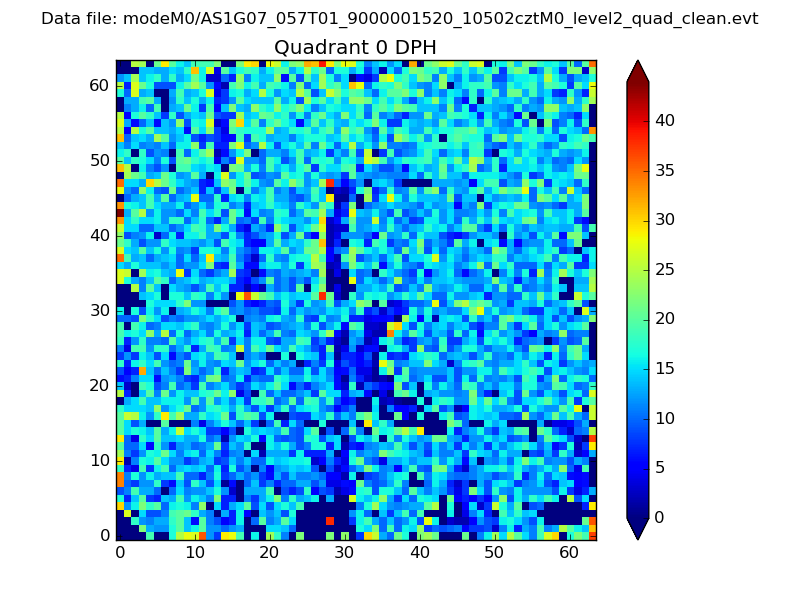 |
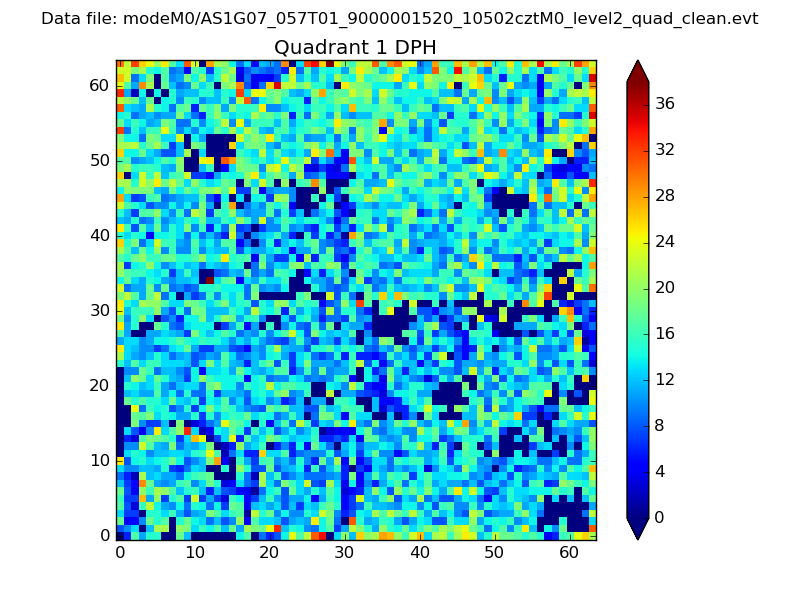 |
Quadrant B |
|---|---|---|---|
| Quadrant D | 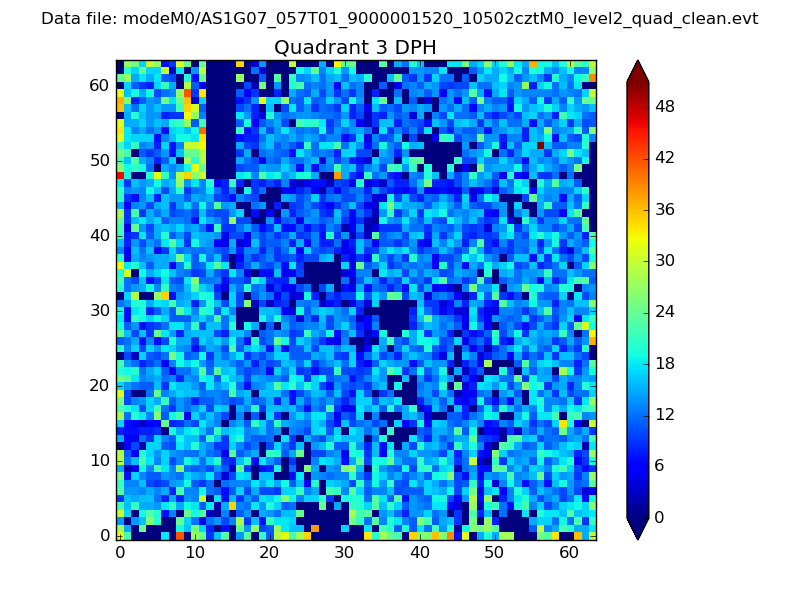 |
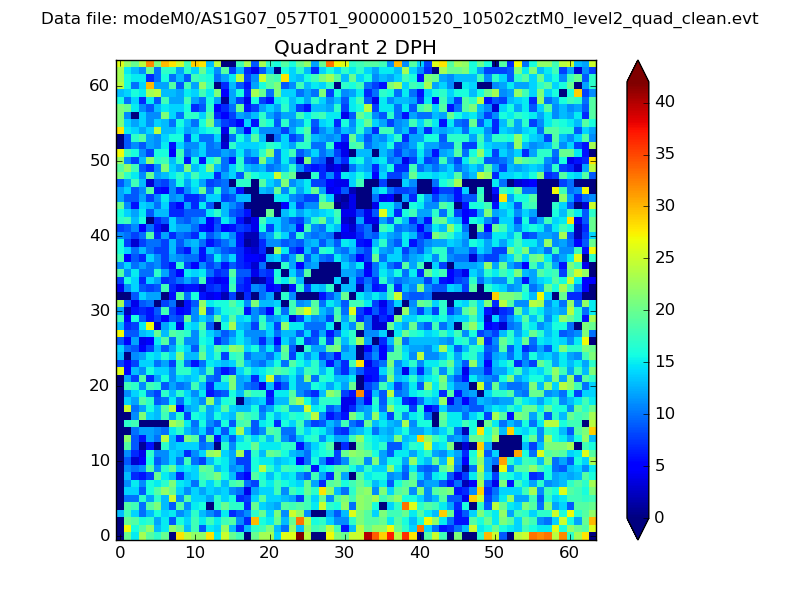 |
Quadrant C |
| Plot type | Count rate plots | Images |
|---|---|---|
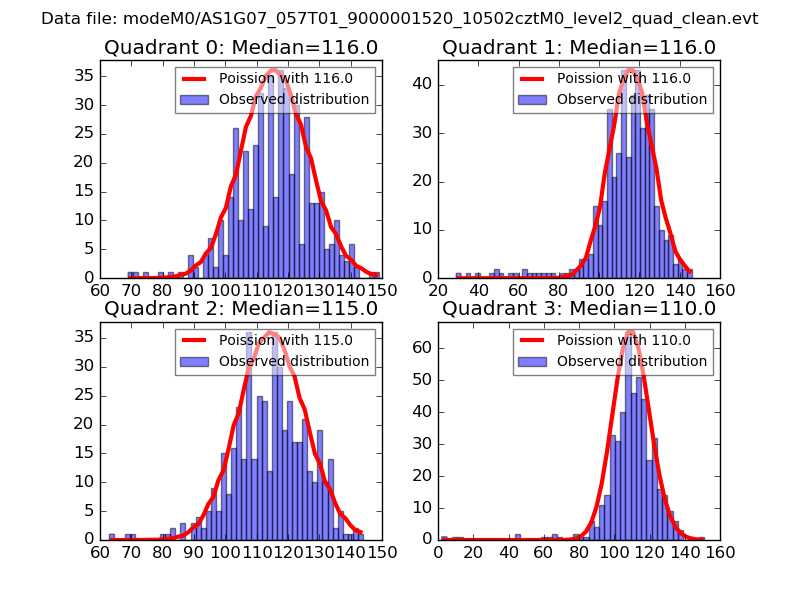
| Comparison with Poisson distribution Blue bars denote a histogram of data divided into 1 sec bins. Red curve is a Poisson curve with rate = median count rate of data. |
 |
 |
| Quadrant-wise count rates Data is divided into 100 sec bins |
 |
|
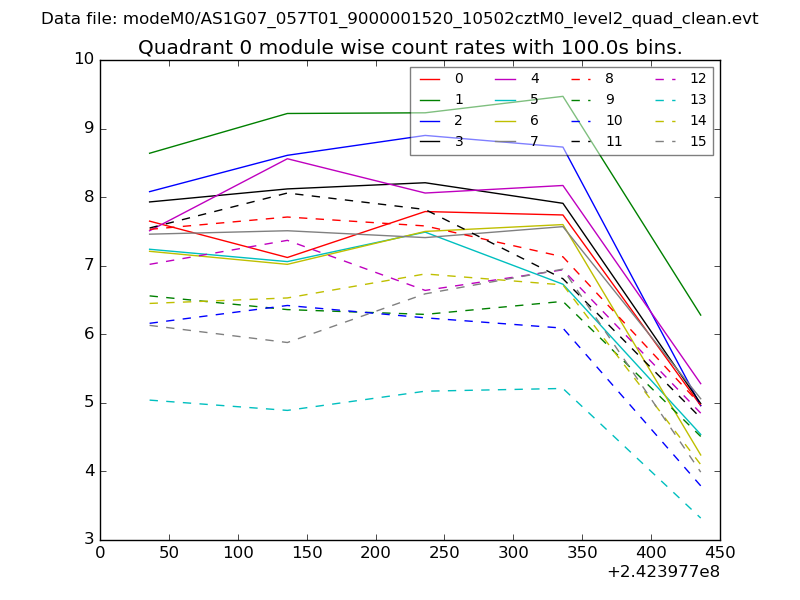
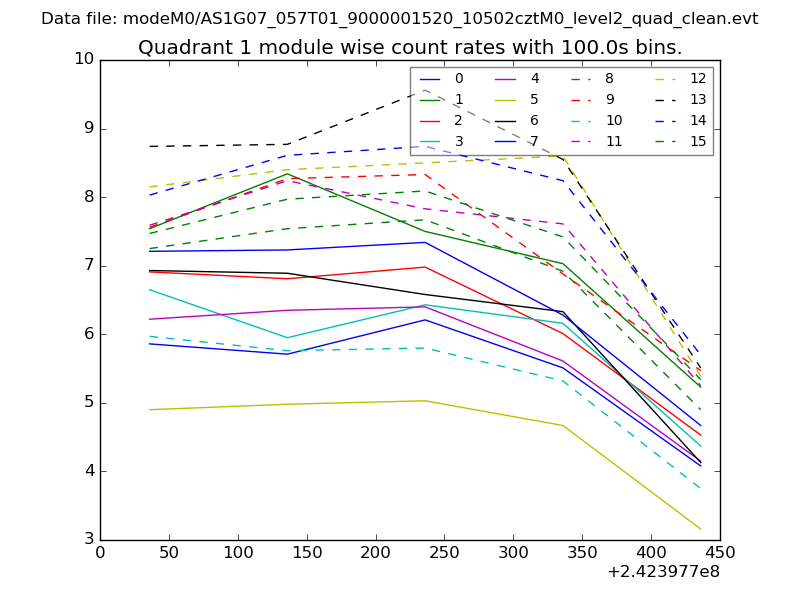
| Module-wise count rates for Quadrant A Data is divided into 100 sec bins |
 |
 |
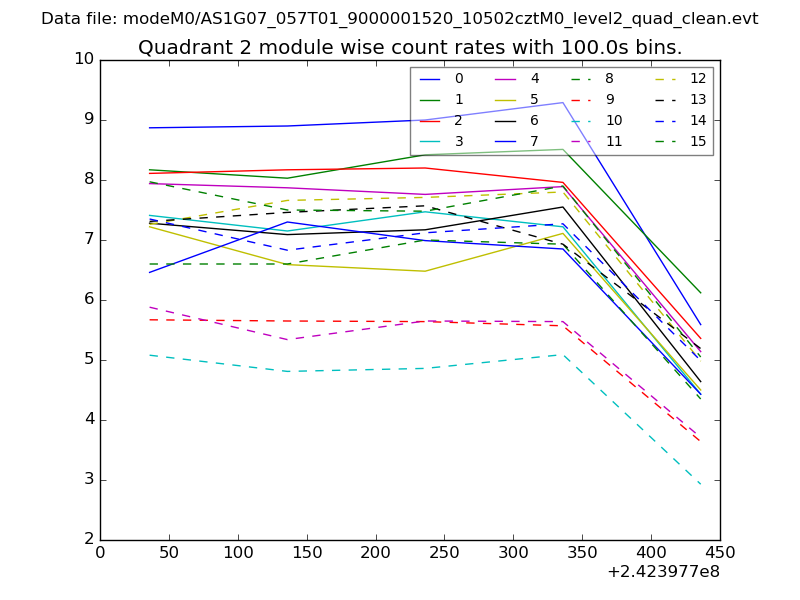
| Module-wise count rates for Quadrant B Data is divided into 100 sec bins |
 |
 |
| Module-wise count rates for Quadrant C Data is divided into 100 sec bins |
 |
 |
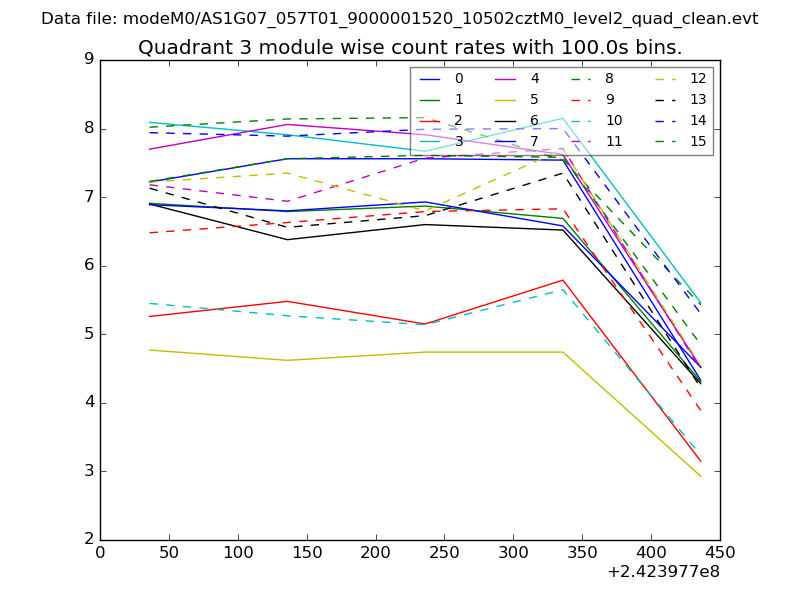
| Module-wise count rates for Quadrant D Data is divided into 100 sec bins |
 |
 |
| Parameter | Plot |
|---|---|
| CZT HV Monitor | 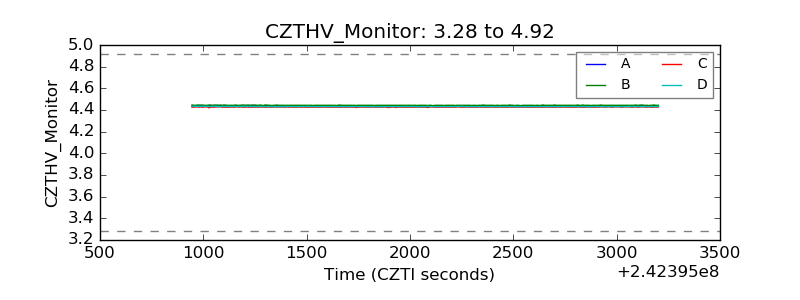 |
| D_VDD | 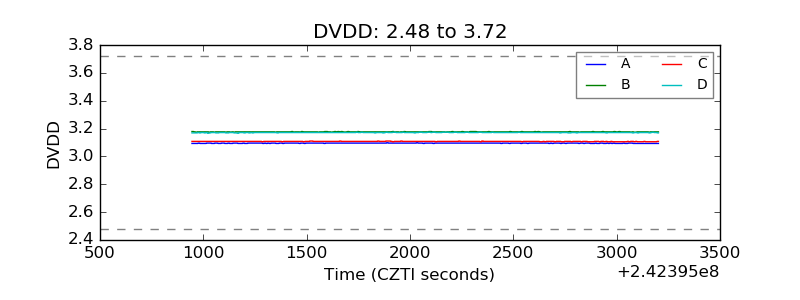 |
| Temperature 1 | 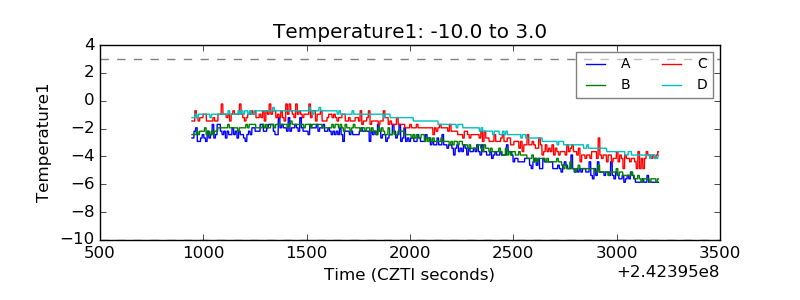 |
| Veto HV Monitor | 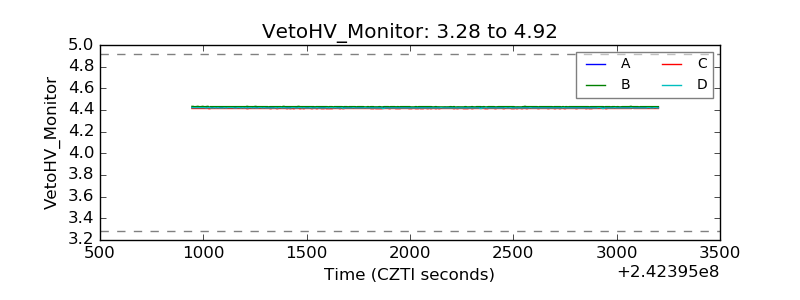 |
| Veto LLD | 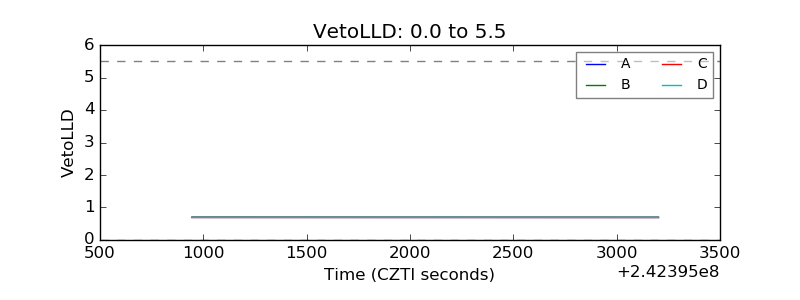 |
| Alpha Counter |  |
| _CPM_Rate | 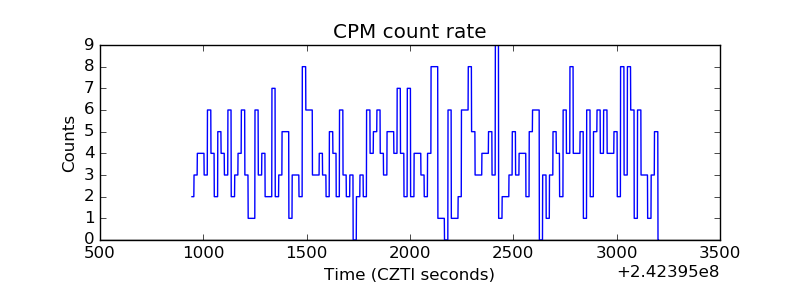 |
| CZT Counter |  |
| +2.5 Volts monitor |  |
| +5 Volts monitor |  |
| _ROLL_ROT | 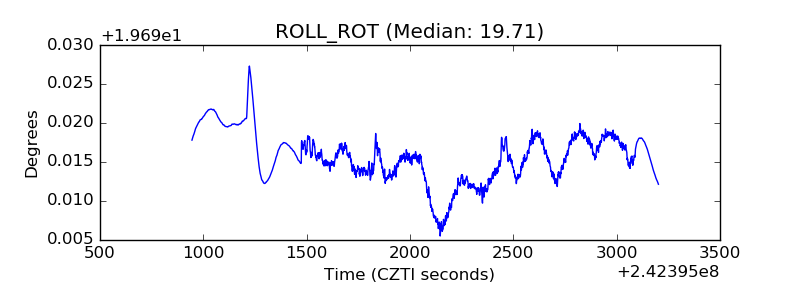 |
| _Roll_DEC | 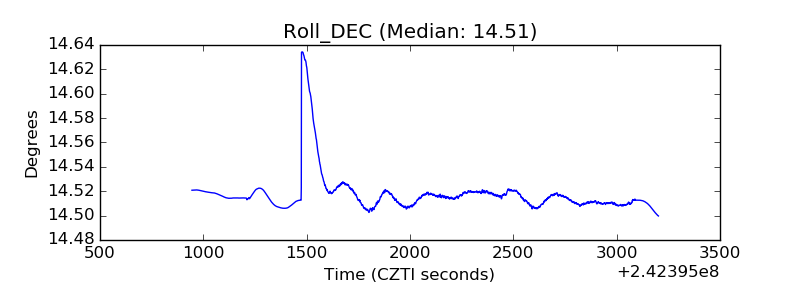 |
| _Roll_RA | 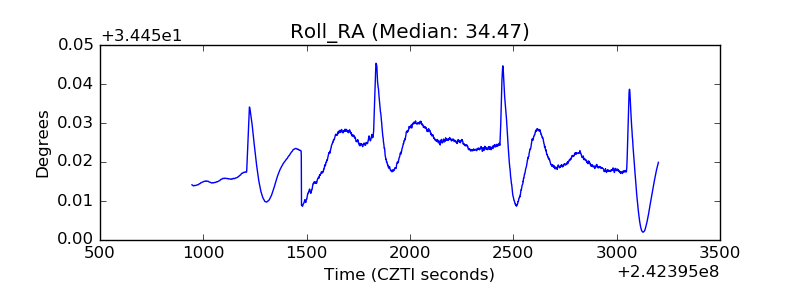 |
| Veto Counter | 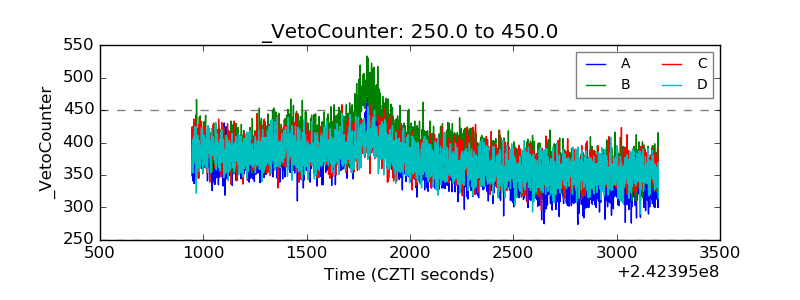 |