| Param | Original file | Final file |
|---|---|---|
| Filename | modeM0/AS1G07_057T01_9000001520_10503cztM0_level2.evt | modeM0/AS1G07_057T01_9000001520_10503cztM0_level2_quad_clean.evt |
| Size (bytes) | 458,265,600 | 78,917,760 |
| Size | 437.0 MB | 75.3 MB |
| Events in quadrant A | 3,672,580 | 507,013 |
| Events in quadrant B | 3,002,989 | 440,641 |
| Events in quadrant C | 3,491,578 | 513,016 |
| Events in quadrant D | 3,221,586 | 429,210 |
| Mode SS | |||
|---|---|---|---|
| Quadrant | BADHDUFLAG | Total packets | Discarded packets |
| A | 0 | 376 | 194 |
| B | 0 | 376 | 202 |
| C | 0 | 376 | 194 |
| D | 0 | 360 | 182 |
| Mode M9 | |||
|---|---|---|---|
| Quadrant | BADHDUFLAG | Total packets | Discarded packets |
| A | 0 | 17 | 8 |
| B | 0 | 18 | 9 |
| C | 0 | 18 | 9 |
| D | 0 | 16 | 7 |
| Mode M0 | |||
|---|---|---|---|
| Quadrant | BADHDUFLAG | Total packets | Discarded packets |
| A | 0 | 36711 | 21030 |
| B | 0 | 46971 | 34358 |
| C | 0 | 38076 | 22286 |
| D | 0 | 50718 | 37585 |
| Quadrant | Total seconds | Saturated seconds | Saturation percentage |
|---|---|---|---|
| A | 7839 | 8 | 0.102054% |
| B | 6293 | 11 | 0.174797% |
| C | 7866 | 10 | 0.127129% |
| D | 6401 | 6 | 0.093735% |
Noise dominated data is calculated using 1-second bins in cleaned event files. If a bin has >2000 counts, and if more than 50% of those come from <1% of pixels, then it is considered to be noise-dominated and hence unusable.
| Quadrant | # 1 sec bins | Bins with >0 counts | Bins with >2000 counts | High rate bins dominated by noise | Noise dominated (total time) | Noise dominated (detector-on time) | Marked lightcurve |
|---|---|---|---|---|---|---|---|
| A | 10446 | 9122 | 0 | 0 | 0.00% | 0.00% | 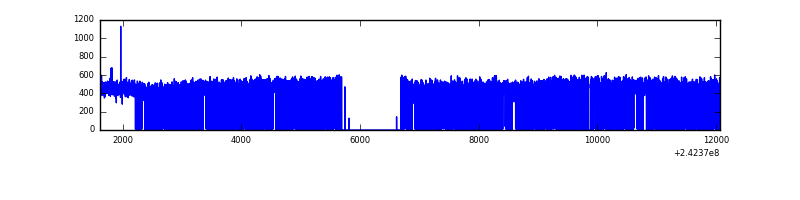 |
| B | 10446 | 7634 | 2 | 2 | 0.02% | 0.03% | 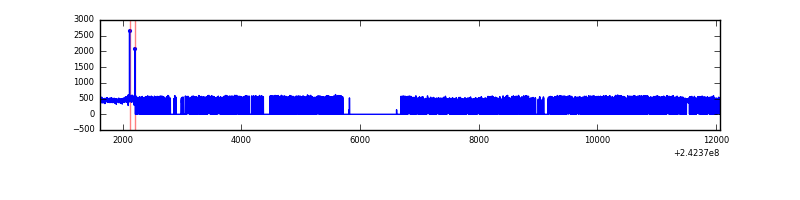 |
| C | 10446 | 9127 | 5 | 5 | 0.05% | 0.05% | 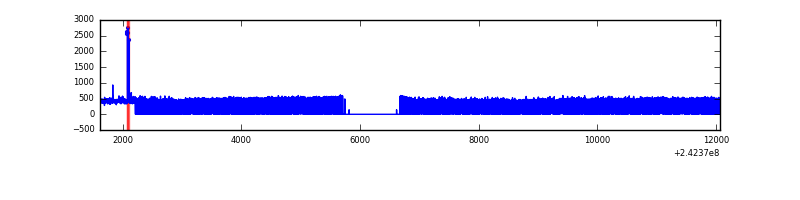 |
| D | 10446 | 7254 | 0 | 0 | 0.00% | 0.00% | 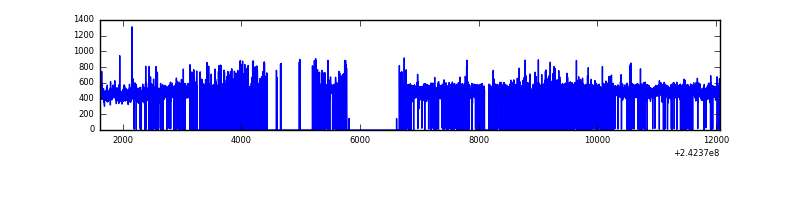 |
Top three noisy pixels from each quadrant. If the there are fewer than three noisy pixels in the level2.evt file, extra rows are filled as -1
| Pixel properties | Quadrant properties | ||||||
|---|---|---|---|---|---|---|---|
| Quadrant | DetID | PixID | Counts | Sigma | Mean | Median | Sigma |
| A | 3 | 80 | 84385 | 453.81 | 909 | 889 | 184.0 |
| A | 15 | 239 | 67768 | 363.5 | 909 | 889 | 184.0 |
| A | 5 | 16 | 12231 | 61.65 | 909 | 889 | 184.0 |
| B | 4 | 239 | 64456 | 454.78 | 727 | 708 | 140.2 |
| B | 0 | 214 | 50152 | 352.74 | 727 | 708 | 140.2 |
| B | 11 | 51 | 27384 | 190.31 | 727 | 708 | 140.2 |
| C | 14 | 234 | 37455 | 177.25 | 885 | 889 | 206.3 |
| C | 13 | 61 | 6541 | 27.4 | 885 | 889 | 206.3 |
| C | 14 | 67 | 2504 | 7.83 | 885 | 889 | 206.3 |
| D | 1 | 20 | 249981 | 1390.12 | 704 | 687 | 179.3 |
| D | 2 | 16 | 172233 | 956.58 | 704 | 687 | 179.3 |
| D | 12 | 233 | 44636 | 245.07 | 704 | 687 | 179.3 |
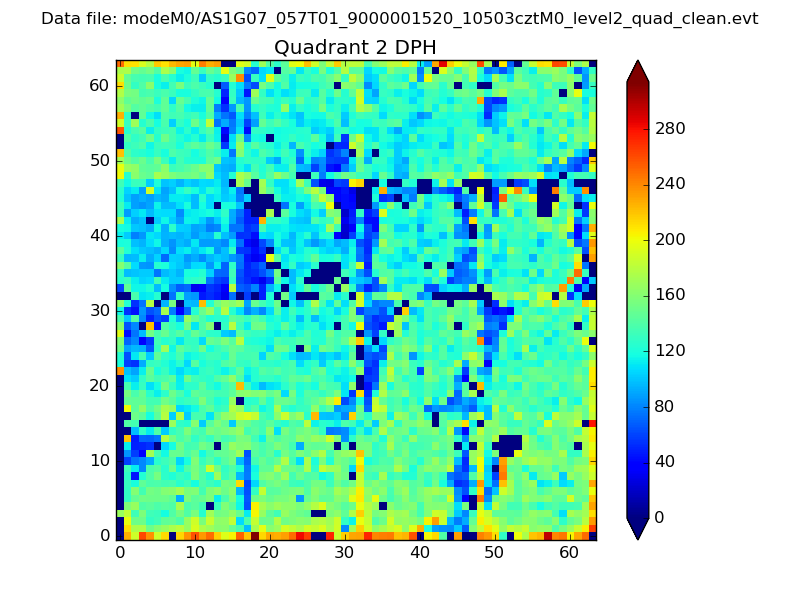
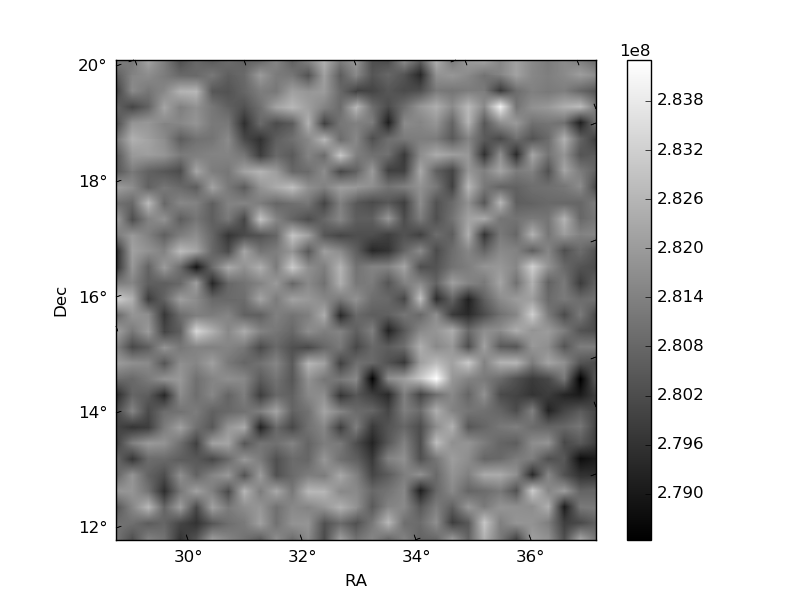
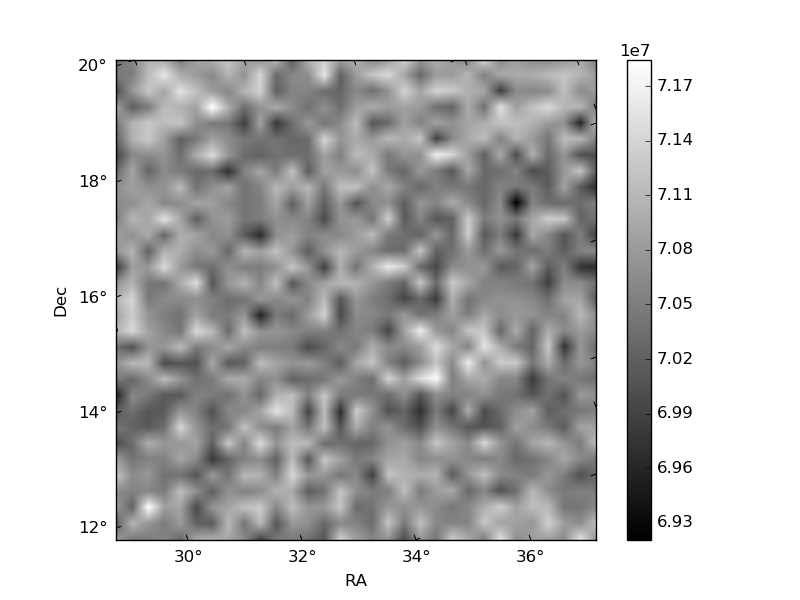
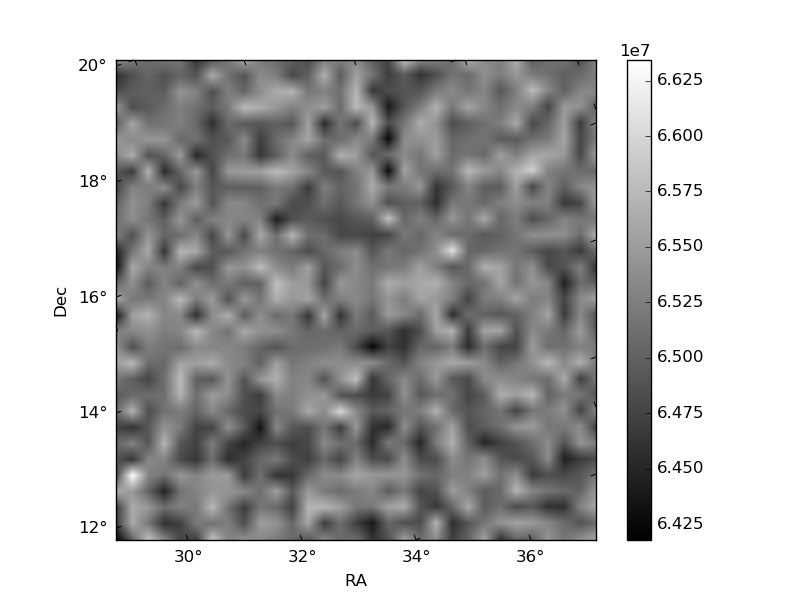
Histogram calculated using DETX and DETY for each event in the final _common_clean file
| Quadrant A | 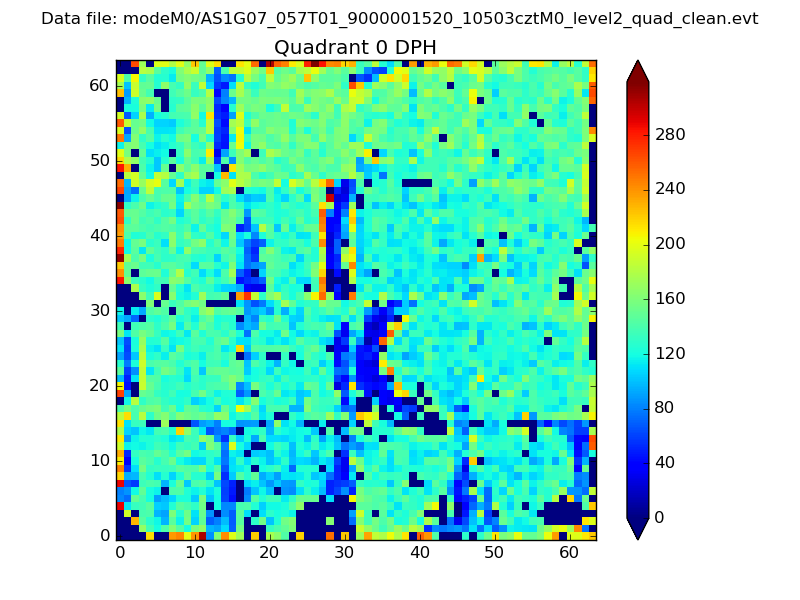 |
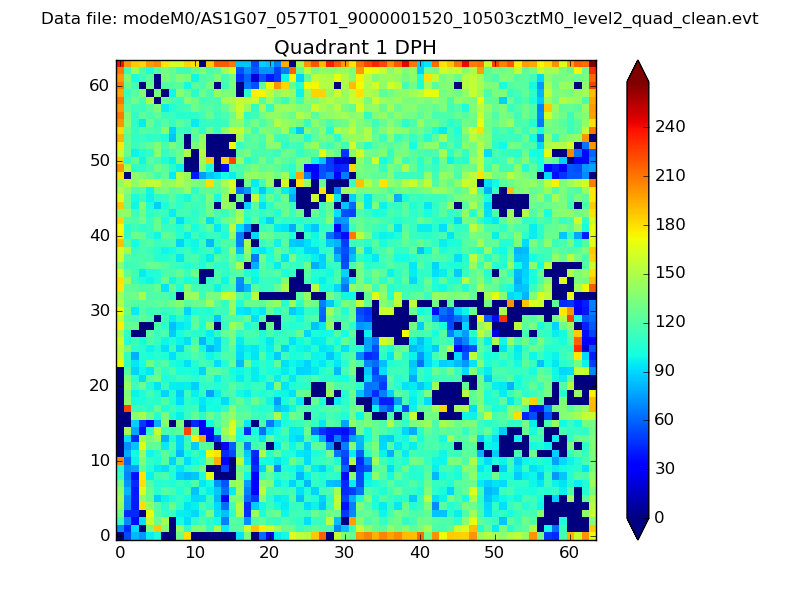 |
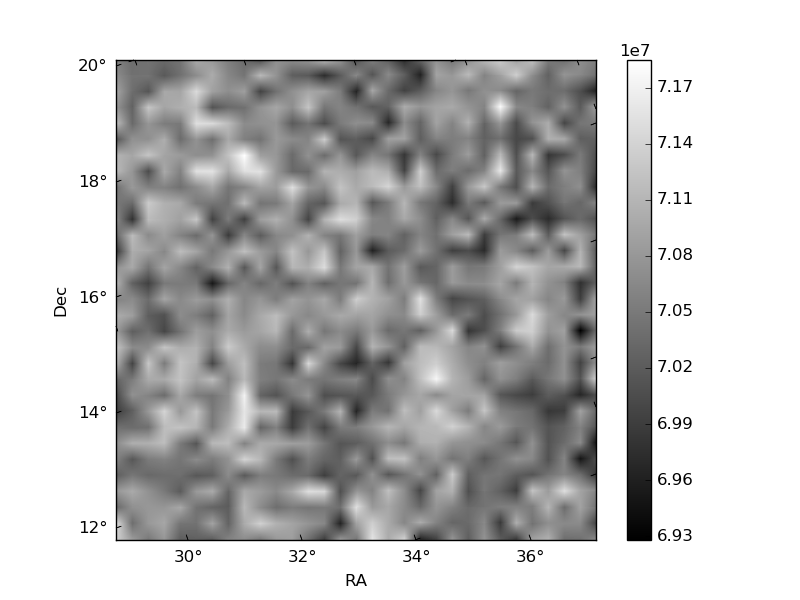
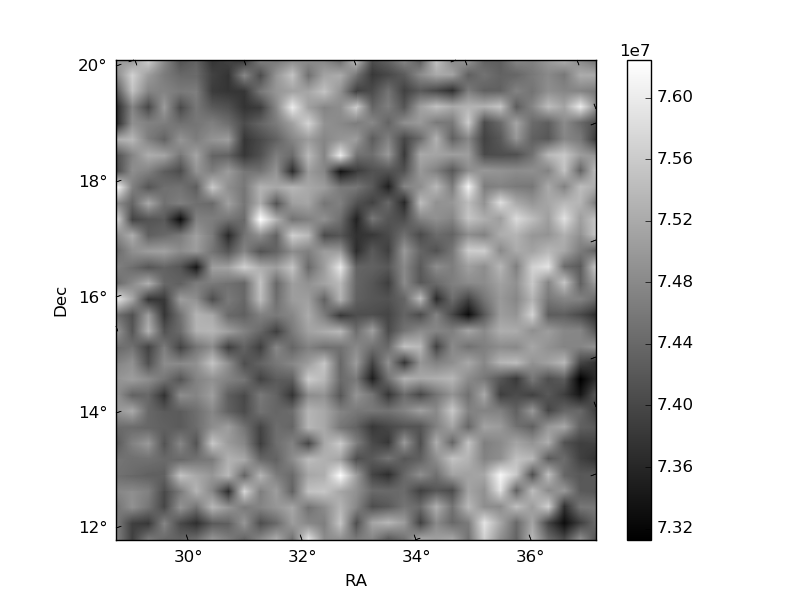
Quadrant B |
|---|---|---|---|
| Quadrant D | 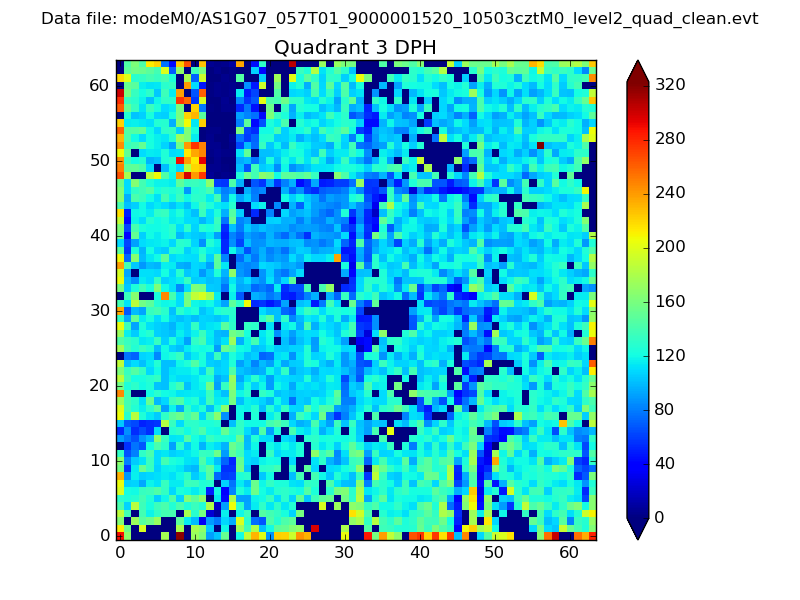 |
 |
Quadrant C |
| Plot type | Count rate plots | Images |
|---|---|---|
| Comparison with Poisson distribution Blue bars denote a histogram of data divided into 1 sec bins. Red curve is a Poisson curve with rate = median count rate of data. |
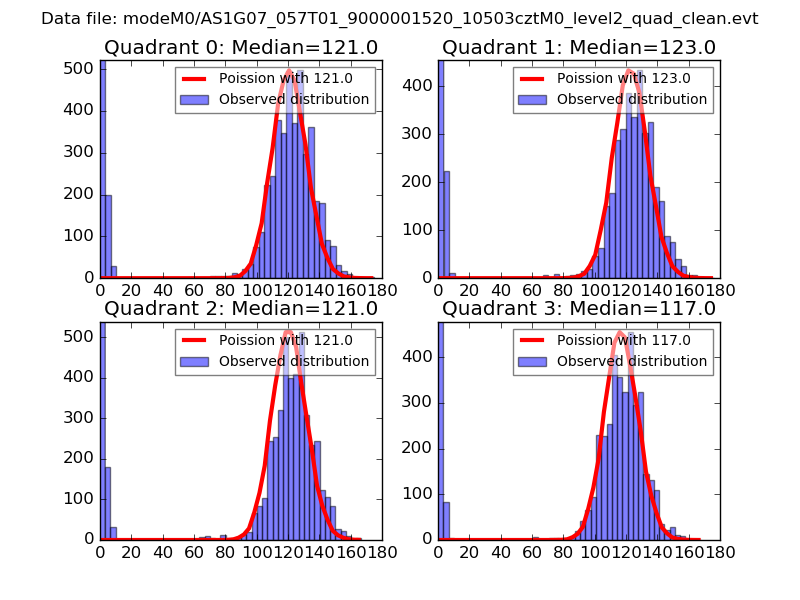 |
 |
| Quadrant-wise count rates Data is divided into 100 sec bins |
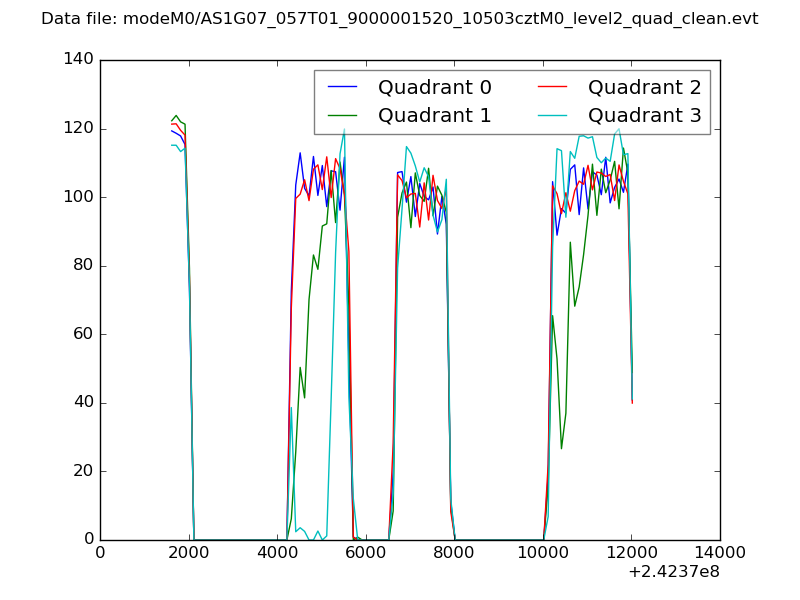 |
|
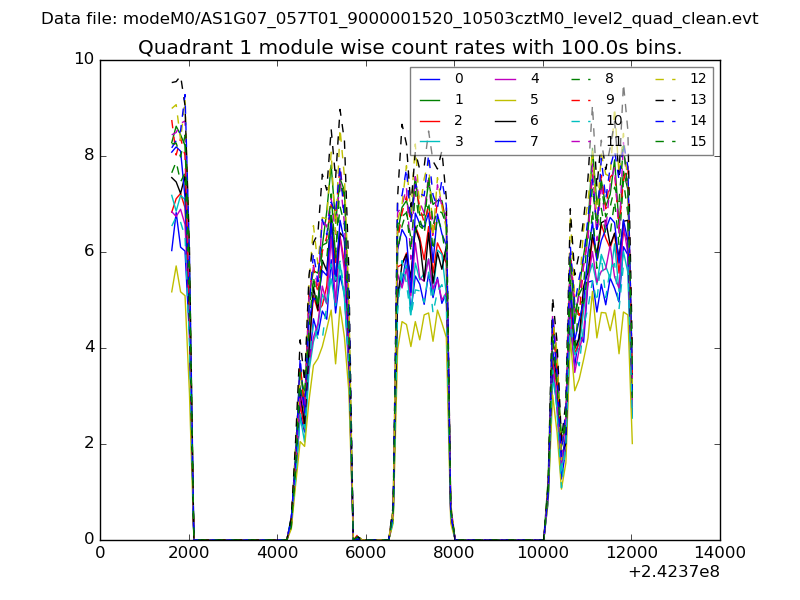
| Module-wise count rates for Quadrant A Data is divided into 100 sec bins |
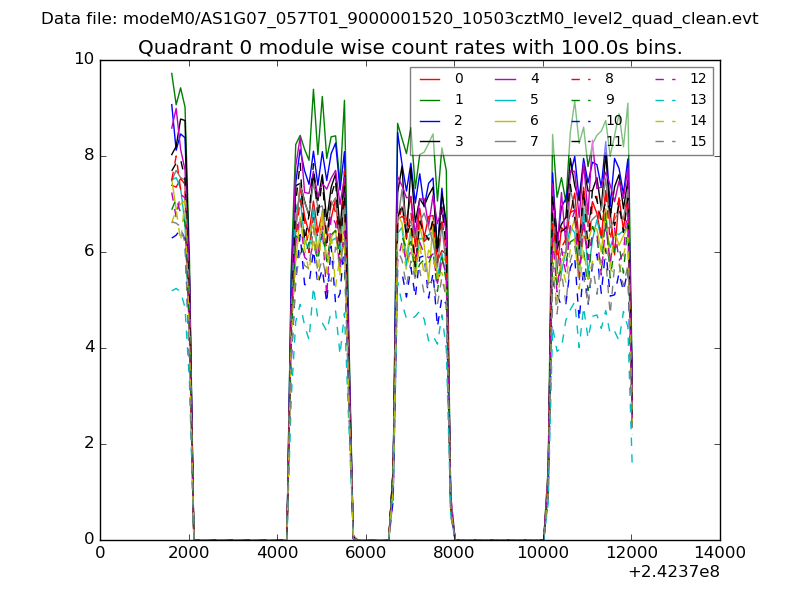 |
 |
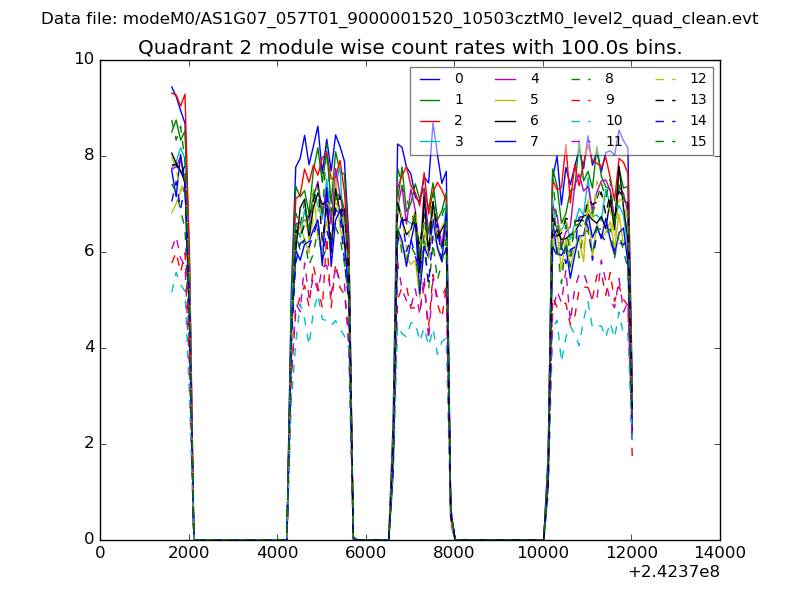
| Module-wise count rates for Quadrant B Data is divided into 100 sec bins |
 |
 |
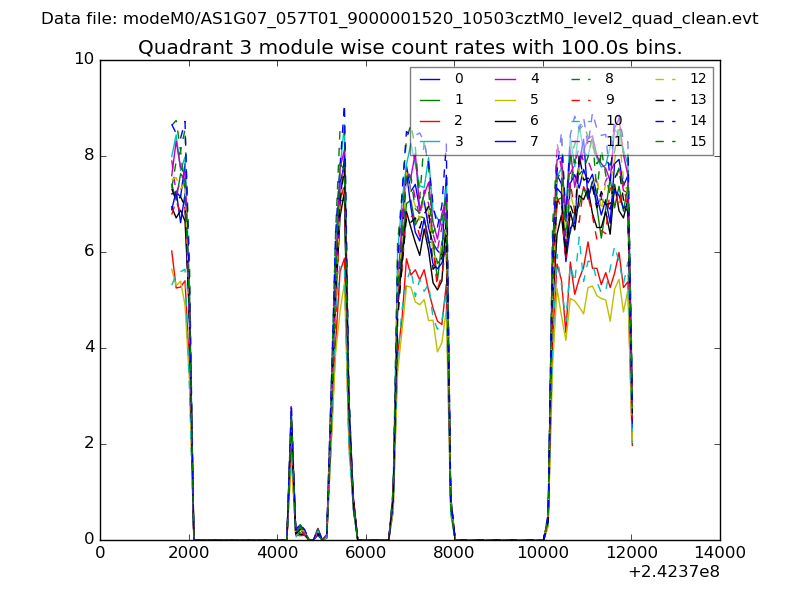
| Module-wise count rates for Quadrant C Data is divided into 100 sec bins |
 |
 |
| Module-wise count rates for Quadrant D Data is divided into 100 sec bins |
 |
 |
| Parameter | Plot |
|---|---|
| CZT HV Monitor | 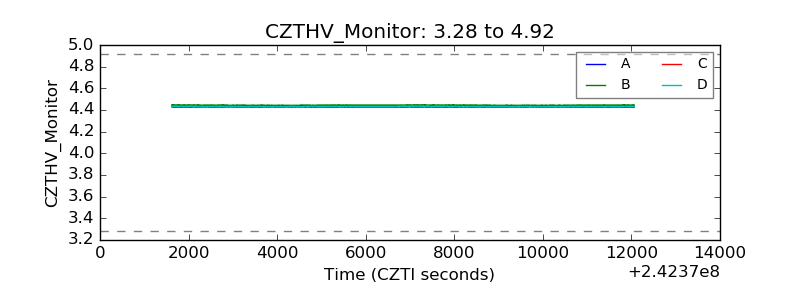 |
| D_VDD | 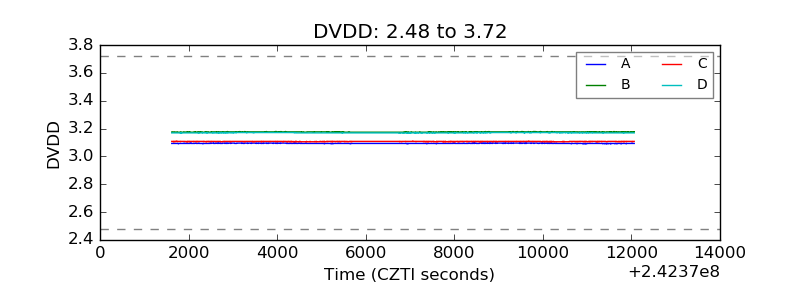 |
| Temperature 1 | 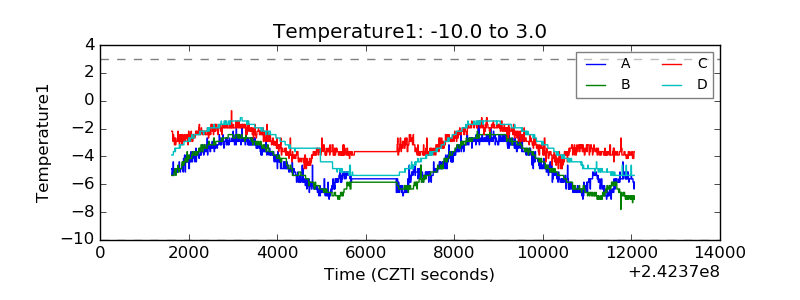 |
| Veto HV Monitor | 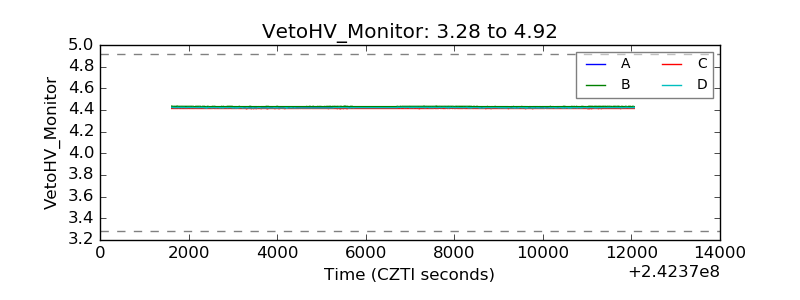 |
| Veto LLD | 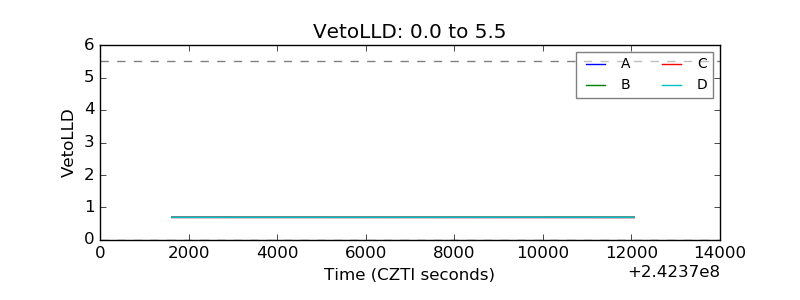 |
| Alpha Counter | 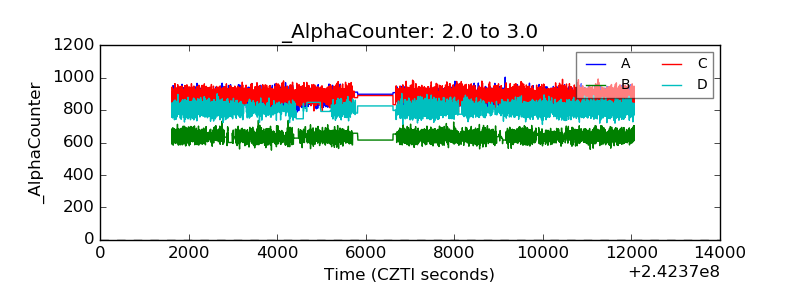 |
| _CPM_Rate | 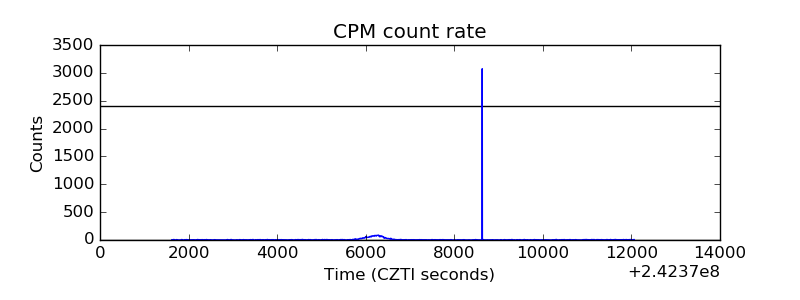 |
| CZT Counter | 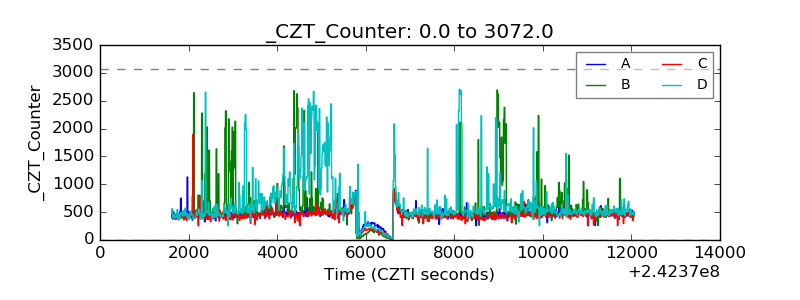 |
| +2.5 Volts monitor |  |
| +5 Volts monitor | 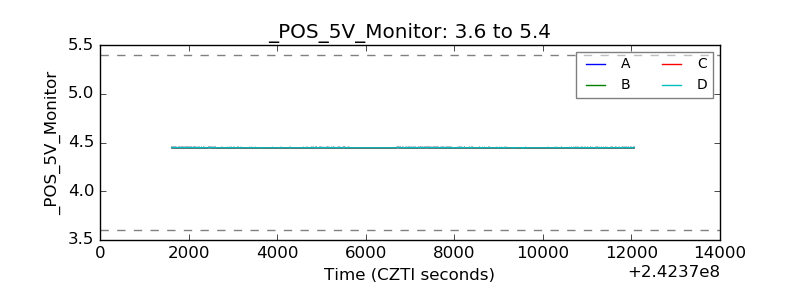 |
| _ROLL_ROT | 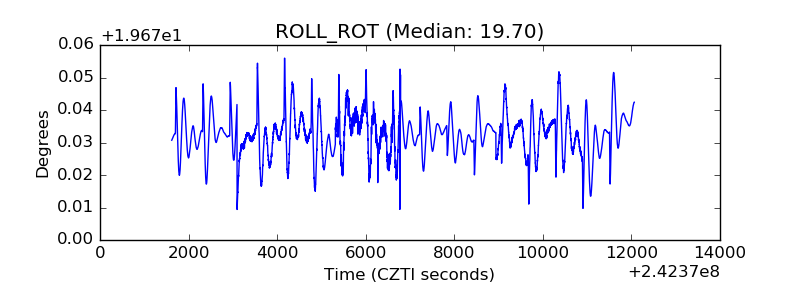 |
| _Roll_DEC | 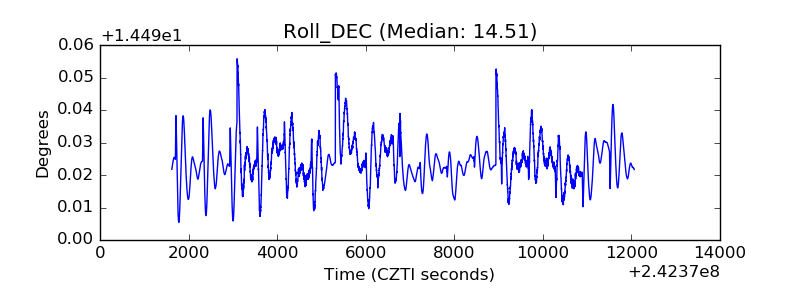 |
| _Roll_RA | 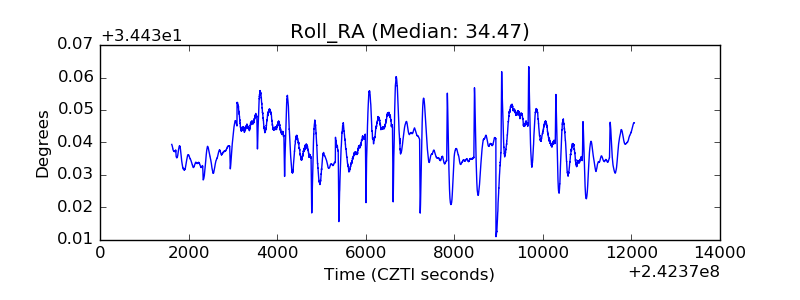 |
| Veto Counter | 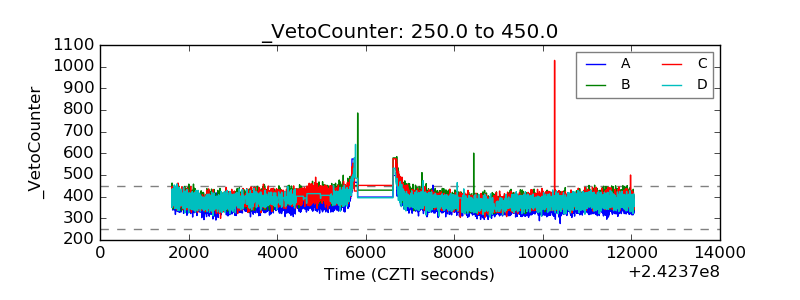 |