| Param | Original file | Final file |
|---|---|---|
| Filename | modeM0/AS1A03_127T02_9000001522_10502cztM0_level2.evt | modeM0/AS1A03_127T02_9000001522_10502cztM0_level2_quad_clean.evt |
| Size (bytes) | 876,994,560 | 232,202,880 |
| Size | 836.4 MB | 221.4 MB |
| Events in quadrant A | 6,148,220 | 1,543,882 |
| Events in quadrant B | 6,577,710 | 1,430,935 |
| Events in quadrant C | 5,889,447 | 1,626,198 |
| Events in quadrant D | 7,068,852 | 1,539,531 |
| Mode M9 | |||
|---|---|---|---|
| Quadrant | BADHDUFLAG | Total packets | Discarded packets |
| A | 0 | 33 | 13 |
| B | 0 | 35 | 15 |
| C | 0 | 35 | 15 |
| D | 0 | 32 | 12 |
| Mode M0 | |||
|---|---|---|---|
| Quadrant | BADHDUFLAG | Total packets | Discarded packets |
| A | 0 | 44171 | 17273 |
| B | 0 | 55006 | 27755 |
| C | 0 | 44012 | 17187 |
| D | 0 | 50176 | 20779 |
| Mode SS | |||
|---|---|---|---|
| Quadrant | BADHDUFLAG | Total packets | Discarded packets |
| A | 0 | 444 | 160 |
| B | 0 | 444 | 159 |
| C | 0 | 444 | 159 |
| D | 0 | 425 | 148 |
| Quadrant | Total seconds | Saturated seconds | Saturation percentage |
|---|---|---|---|
| A | 13082 | 89 | 0.680324% |
| B | 11999 | 326 | 2.716893% |
| C | 13232 | 63 | 0.476119% |
| D | 13172 | 106 | 0.804737% |
Noise dominated data is calculated using 1-second bins in cleaned event files. If a bin has >2000 counts, and if more than 50% of those come from <1% of pixels, then it is considered to be noise-dominated and hence unusable.
| Quadrant | # 1 sec bins | Bins with >0 counts | Bins with >2000 counts | High rate bins dominated by noise | Noise dominated (total time) | Noise dominated (detector-on time) | Marked lightcurve |
|---|---|---|---|---|---|---|---|
| A | 16620 | 14135 | 4 | 4 | 0.02% | 0.03% | 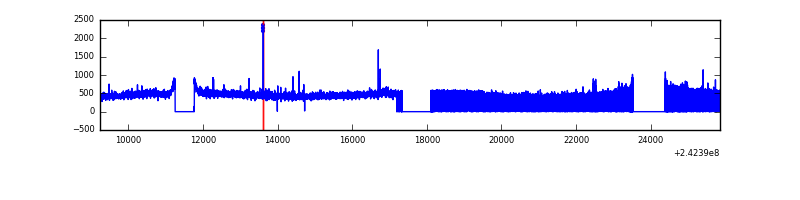 |
| B | 16619 | 13025 | 158 | 158 | 0.95% | 1.21% | 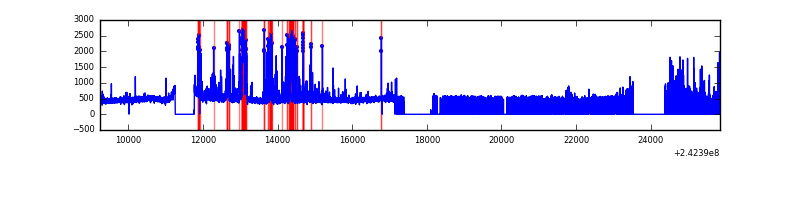 |
| C | 16620 | 14192 | 10 | 10 | 0.06% | 0.07% | 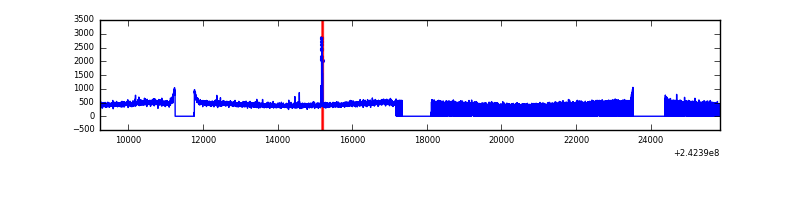 |
| D | 16620 | 13792 | 35 | 35 | 0.21% | 0.25% | 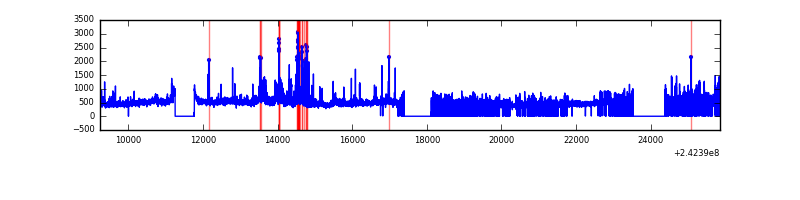 |
Top three noisy pixels from each quadrant. If the there are fewer than three noisy pixels in the level2.evt file, extra rows are filled as -1
| Pixel properties | Quadrant properties | ||||||
|---|---|---|---|---|---|---|---|
| Quadrant | DetID | PixID | Counts | Sigma | Mean | Median | Sigma |
| A | 3 | 80 | 185637 | 606.51 | 1495 | 1460 | 303.7 |
| A | 15 | 239 | 136258 | 443.9 | 1495 | 1460 | 303.7 |
| A | 5 | 16 | 43194 | 137.43 | 1495 | 1460 | 303.7 |
| B | 4 | 239 | 930490 | 3583.82 | 1374 | 1341 | 259.3 |
| B | 11 | 51 | 110774 | 422.09 | 1374 | 1341 | 259.3 |
| B | 0 | 214 | 84526 | 320.85 | 1374 | 1341 | 259.3 |
| C | 14 | 234 | 45444 | 127.89 | 1497 | 1500 | 343.6 |
| C | 13 | 61 | 11179 | 28.17 | 1497 | 1500 | 343.6 |
| C | 14 | 67 | 5291 | 11.03 | 1497 | 1500 | 343.6 |
| D | 2 | 16 | 440536 | 1252.42 | 1475 | 1433 | 350.6 |
| D | 1 | 20 | 413355 | 1174.9 | 1475 | 1433 | 350.6 |
| D | 1 | 52 | 184913 | 523.33 | 1475 | 1433 | 350.6 |
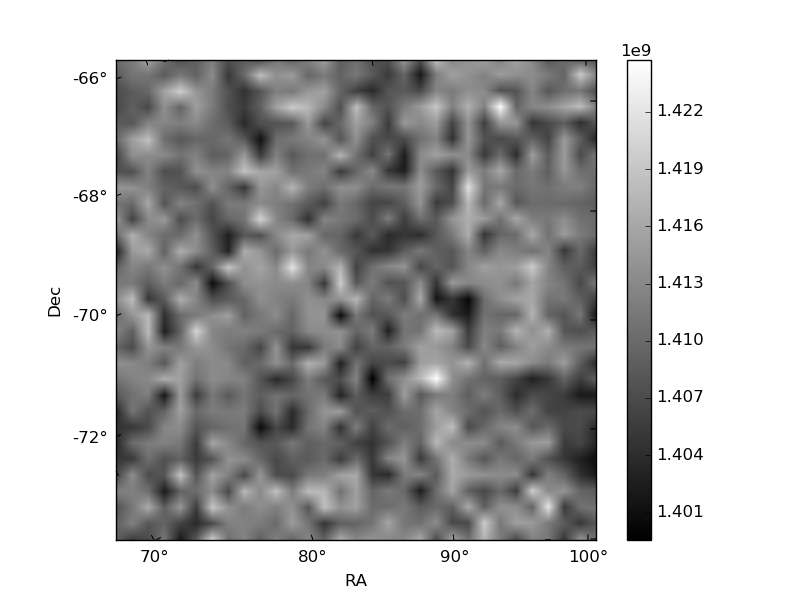
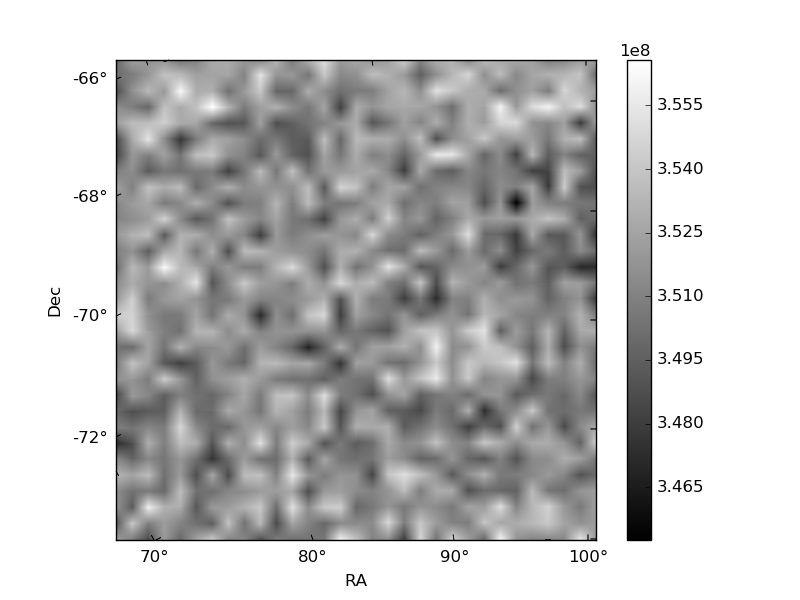
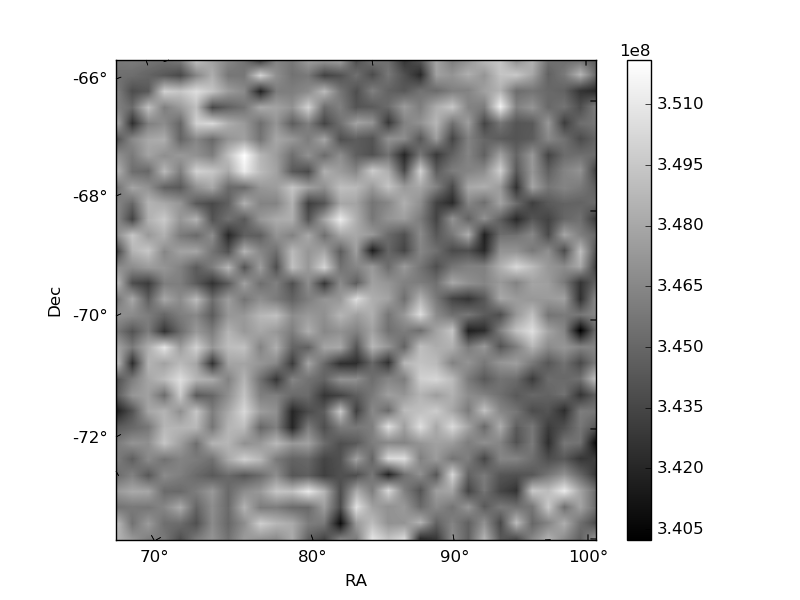
Histogram calculated using DETX and DETY for each event in the final _common_clean file
| Quadrant A | 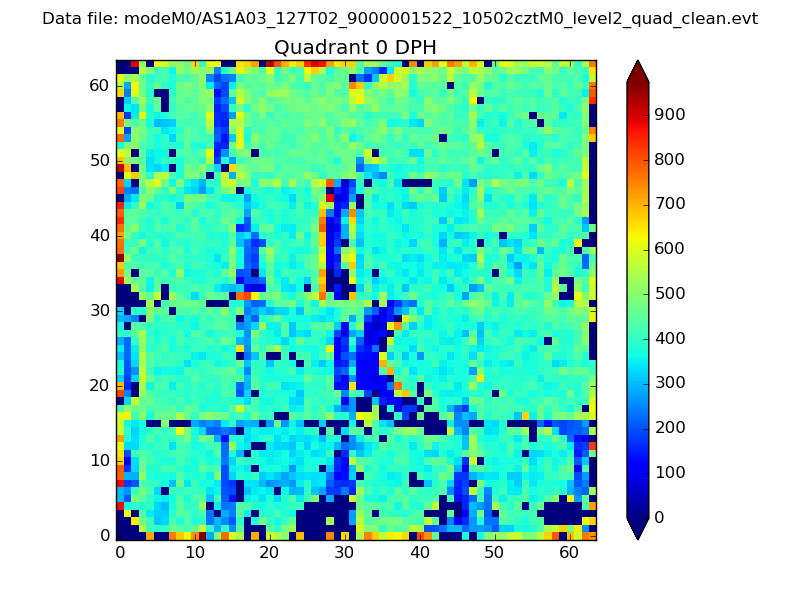 |
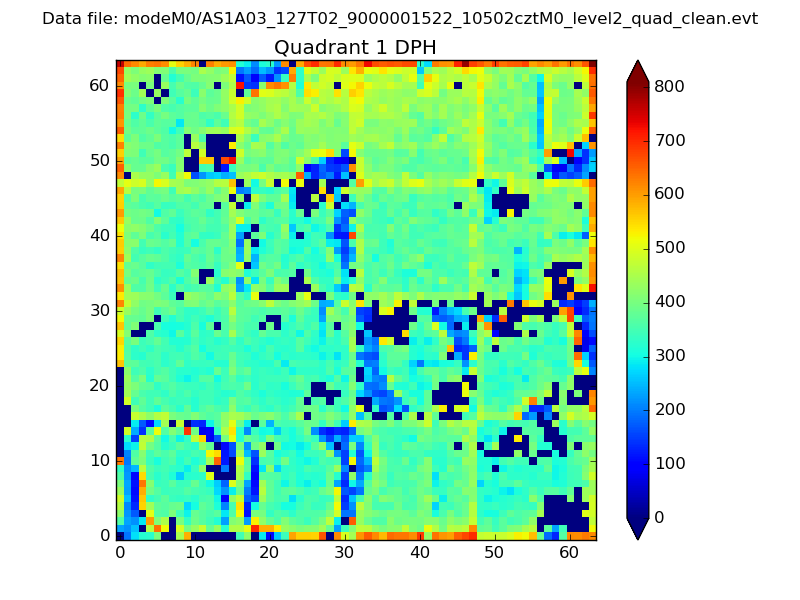 |
Quadrant B |
|---|---|---|---|
| Quadrant D | 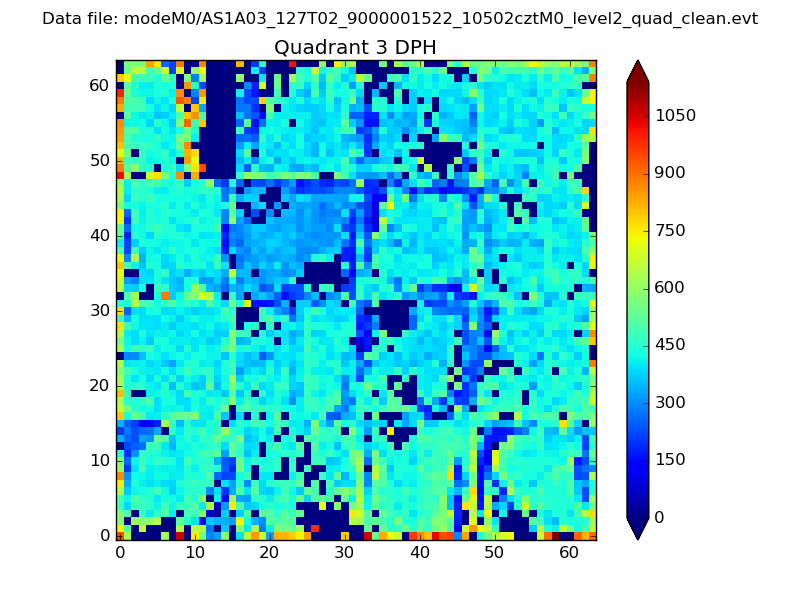 |
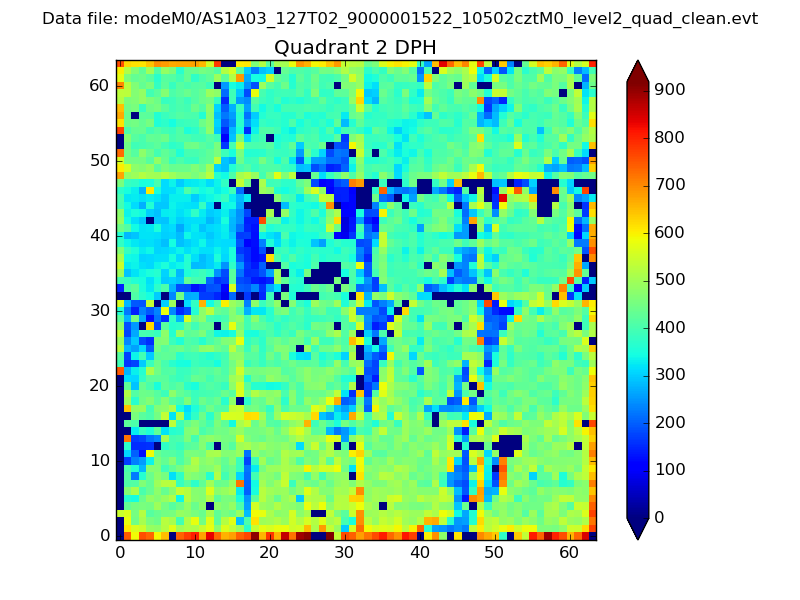 |
Quadrant C |
| Plot type | Count rate plots | Images |
|---|---|---|
| Comparison with Poisson distribution Blue bars denote a histogram of data divided into 1 sec bins. Red curve is a Poisson curve with rate = median count rate of data. |
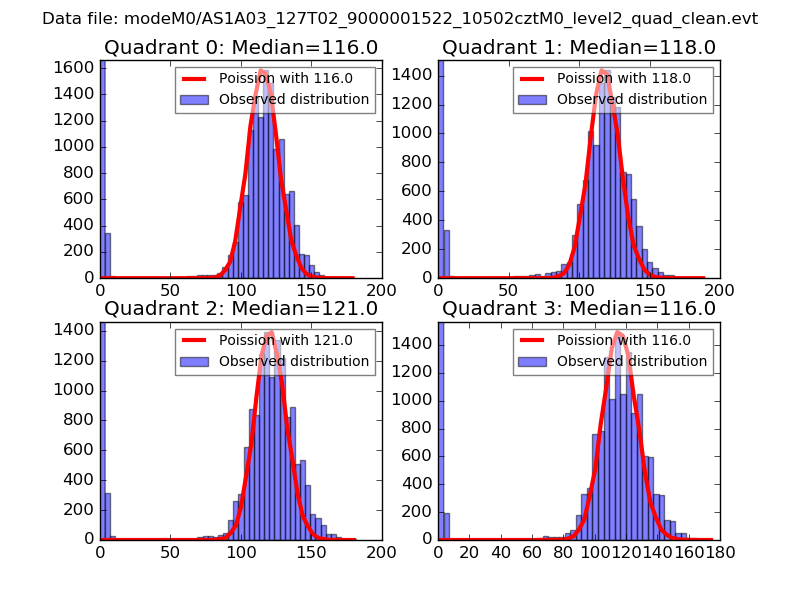 |
 |
| Quadrant-wise count rates Data is divided into 100 sec bins |
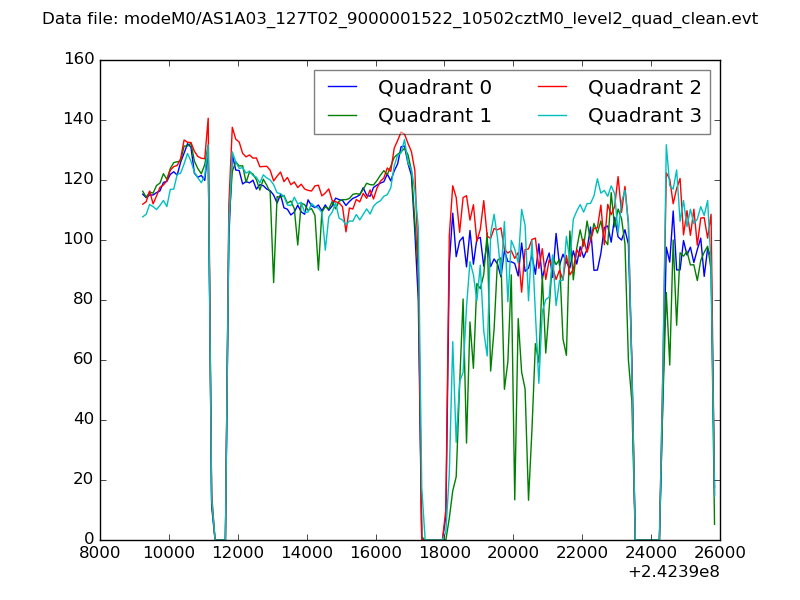 |
|
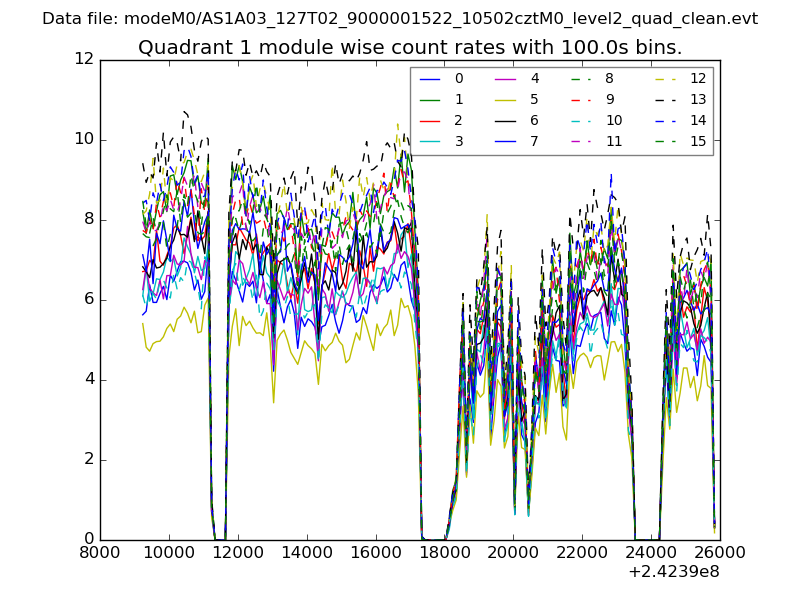
| Module-wise count rates for Quadrant A Data is divided into 100 sec bins |
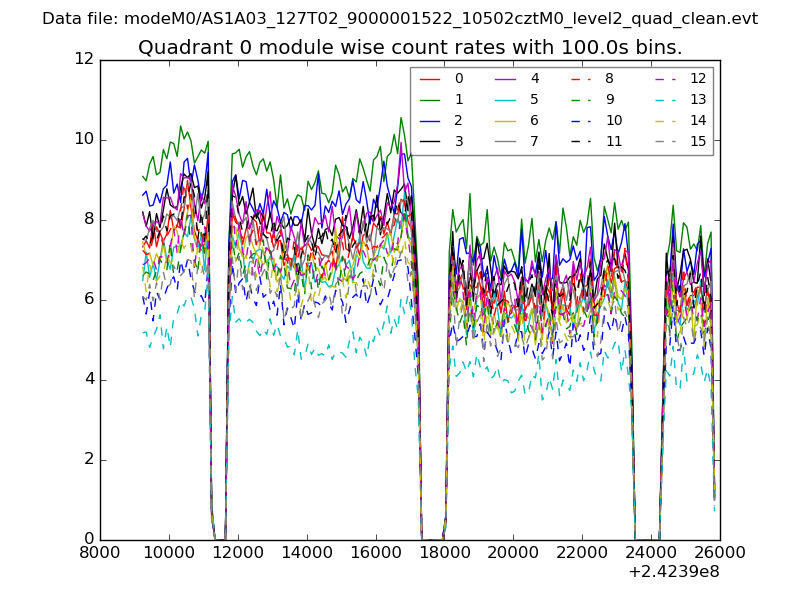 |
 |
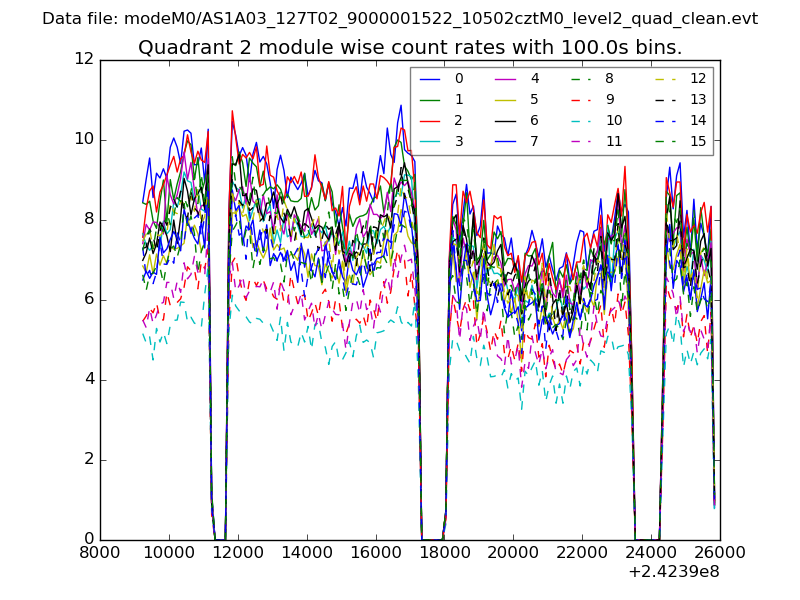
| Module-wise count rates for Quadrant B Data is divided into 100 sec bins |
 |
 |
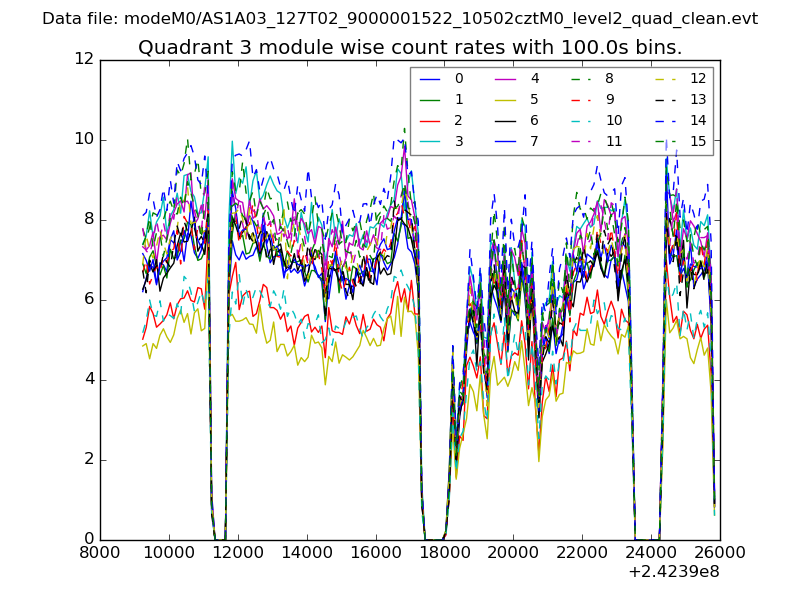
| Module-wise count rates for Quadrant C Data is divided into 100 sec bins |
 |
 |
| Module-wise count rates for Quadrant D Data is divided into 100 sec bins |
 |
 |
| Parameter | Plot |
|---|---|
| CZT HV Monitor | 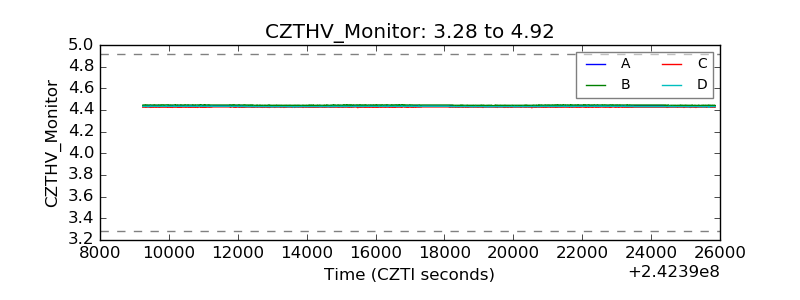 |
| D_VDD | 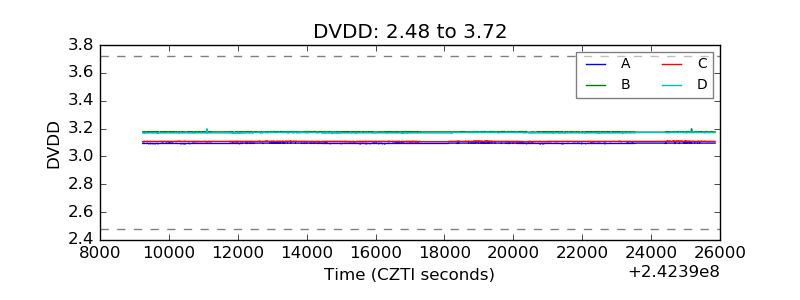 |
| Temperature 1 | 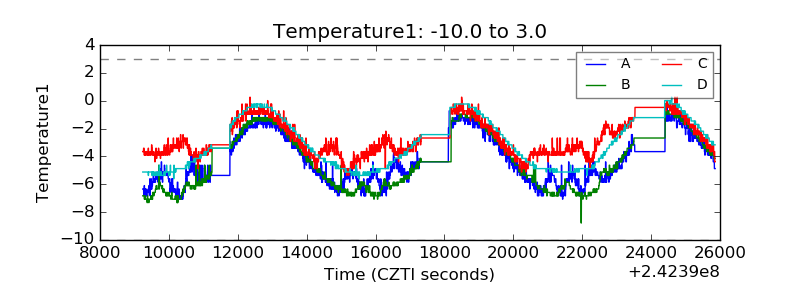 |
| Veto HV Monitor |  |
| Veto LLD | 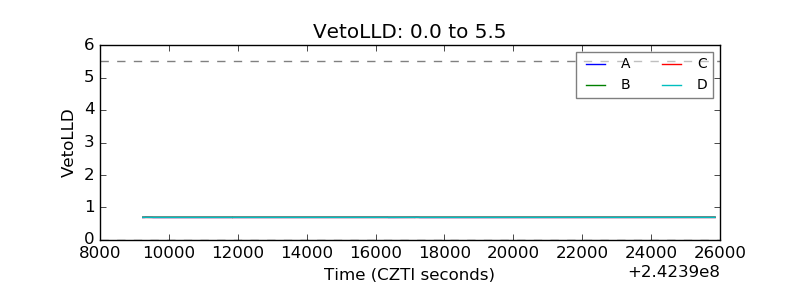 |
| Alpha Counter |  |
| _CPM_Rate | 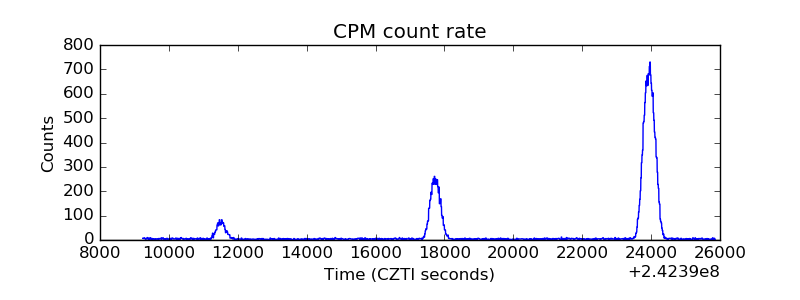 |
| CZT Counter | 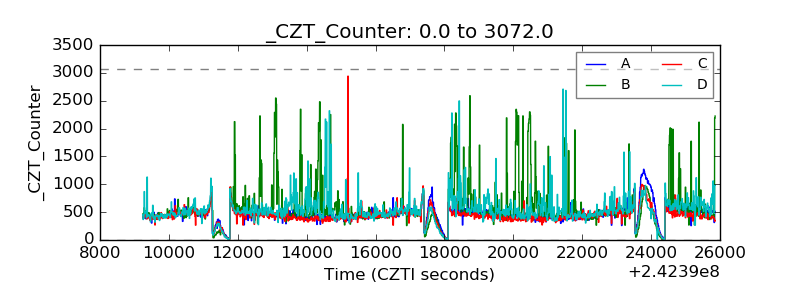 |
| +2.5 Volts monitor |  |
| +5 Volts monitor |  |
| _ROLL_ROT | 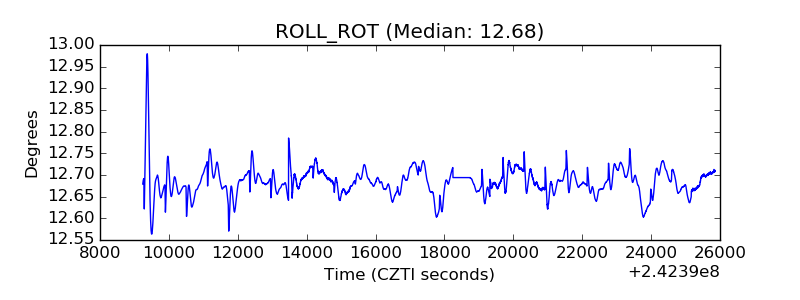 |
| _Roll_DEC | 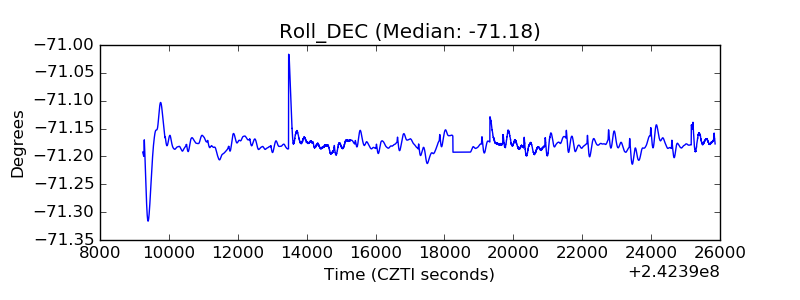 |
| _Roll_RA |  |
| Veto Counter | 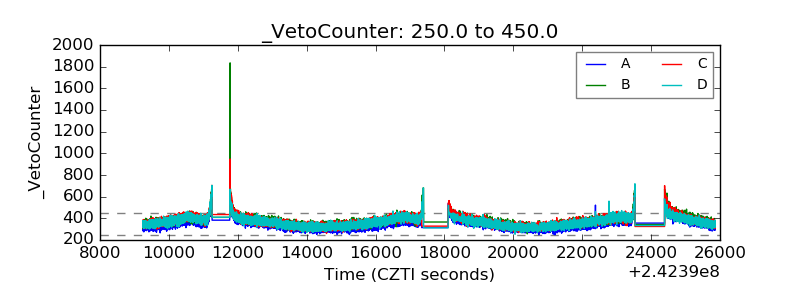 |