| Param | Original file | Final file |
|---|---|---|
| Filename | modeM0/AS1A03_127T02_9000001522_10503cztM0_level2.evt | modeM0/AS1A03_127T02_9000001522_10503cztM0_level2_quad_clean.evt |
| Size (bytes) | 490,354,560 | 116,190,720 |
| Size | 467.6 MB | 110.8 MB |
| Events in quadrant A | 3,829,130 | 726,614 |
| Events in quadrant B | 3,983,890 | 761,164 |
| Events in quadrant C | 2,822,047 | 805,683 |
| Events in quadrant D | 3,786,078 | 784,372 |
| Mode M9 | |||
|---|---|---|---|
| Quadrant | BADHDUFLAG | Total packets | Discarded packets |
| A | 0 | 20 | 10 |
| B | 0 | 20 | 10 |
| C | 0 | 20 | 10 |
| D | 0 | 18 | 8 |
| Mode M0 | |||
|---|---|---|---|
| Quadrant | BADHDUFLAG | Total packets | Discarded packets |
| A | 0 | 24541 | 8560 |
| B | 0 | 23744 | 7788 |
| C | 0 | 18505 | 5573 |
| D | 0 | 22234 | 6587 |
| Mode SS | |||
|---|---|---|---|
| Quadrant | BADHDUFLAG | Total packets | Discarded packets |
| A | 0 | 186 | 54 |
| B | 0 | 186 | 51 |
| C | 0 | 186 | 53 |
| D | 0 | 183 | 48 |
| Quadrant | Total seconds | Saturated seconds | Saturation percentage |
|---|---|---|---|
| A | 6070 | 40 | 0.658979% |
| B | 6227 | 266 | 4.271720% |
| C | 6404 | 9 | 0.140537% |
| D | 6546 | 43 | 0.656890% |
Noise dominated data is calculated using 1-second bins in cleaned event files. If a bin has >2000 counts, and if more than 50% of those come from <1% of pixels, then it is considered to be noise-dominated and hence unusable.
| Quadrant | # 1 sec bins | Bins with >0 counts | Bins with >2000 counts | High rate bins dominated by noise | Noise dominated (total time) | Noise dominated (detector-on time) | Marked lightcurve |
|---|---|---|---|---|---|---|---|
| A | 7799 | 6490 | 6 | 6 | 0.08% | 0.09% | 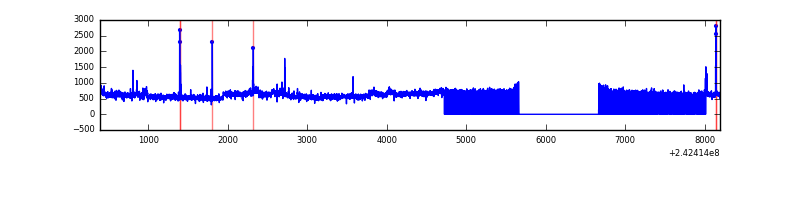 |
| B | 7800 | 6576 | 175 | 175 | 2.24% | 2.66% | 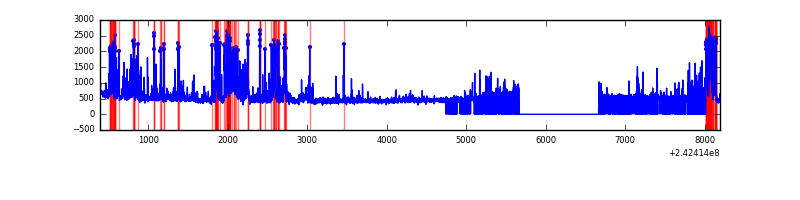 |
| C | 7799 | 6711 | 0 | 0 | 0.00% | 0.00% | 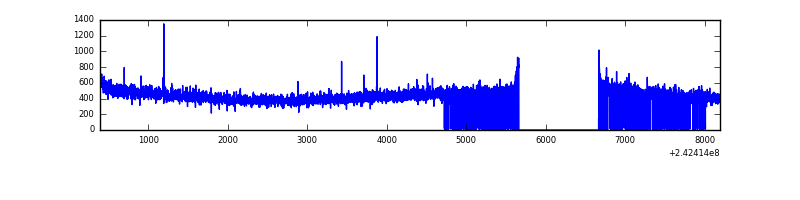 |
| D | 7801 | 6731 | 21 | 21 | 0.27% | 0.31% | 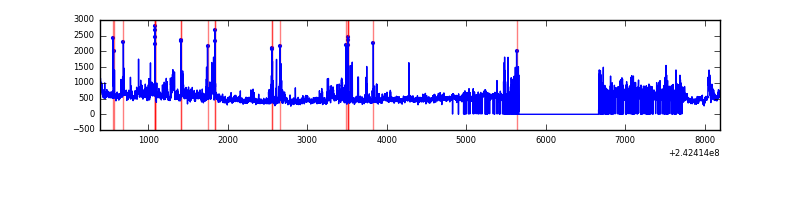 |
Top three noisy pixels from each quadrant. If the there are fewer than three noisy pixels in the level2.evt file, extra rows are filled as -1
| Pixel properties | Quadrant properties | ||||||
|---|---|---|---|---|---|---|---|
| Quadrant | DetID | PixID | Counts | Sigma | Mean | Median | Sigma |
| A | 15 | 239 | 1023650 | 7280.67 | 694 | 677 | 140.5 |
| A | 3 | 80 | 73505 | 518.33 | 694 | 677 | 140.5 |
| A | 5 | 16 | 22831 | 157.67 | 694 | 677 | 140.5 |
| B | 4 | 239 | 983082 | 7251.0 | 716 | 699 | 135.5 |
| B | 11 | 51 | 86097 | 630.32 | 716 | 699 | 135.5 |
| B | 0 | 214 | 49444 | 359.79 | 716 | 699 | 135.5 |
| C | 13 | 61 | 5426 | 28.15 | 721 | 722 | 167.1 |
| C | 14 | 234 | 4485 | 22.52 | 721 | 722 | 167.1 |
| C | 0 | 207 | 4275 | 21.27 | 721 | 722 | 167.1 |
| D | 2 | 16 | 344906 | 1970.85 | 731 | 710 | 174.6 |
| D | 1 | 52 | 228670 | 1305.29 | 731 | 710 | 174.6 |
| D | 8 | 195 | 188482 | 1075.17 | 731 | 710 | 174.6 |
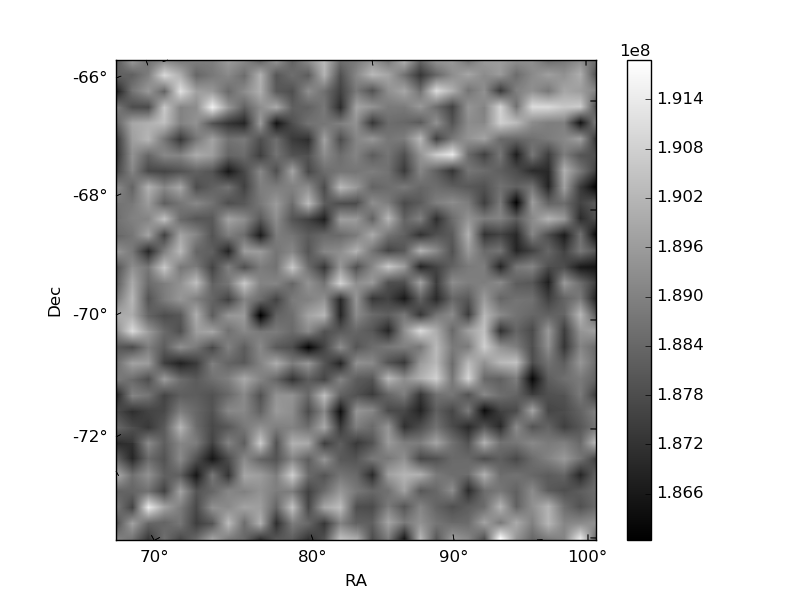
Histogram calculated using DETX and DETY for each event in the final _common_clean file
| Quadrant A | 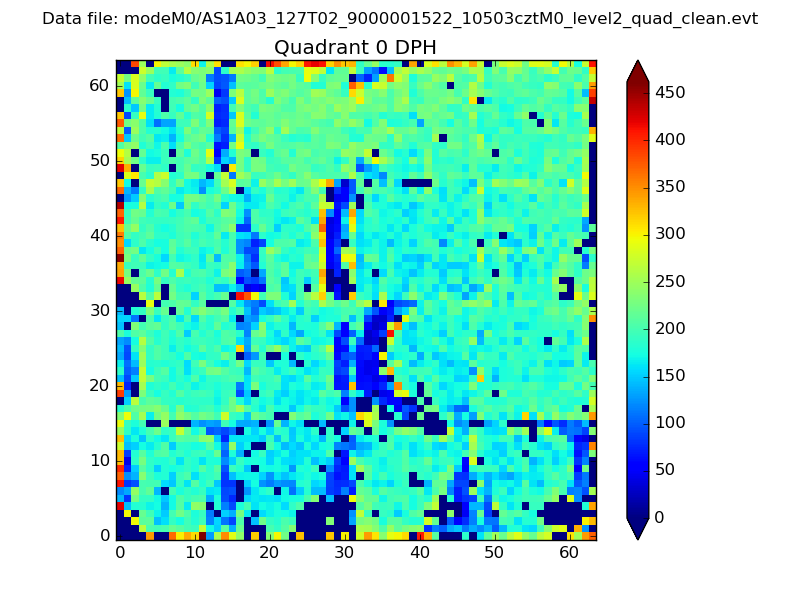 |
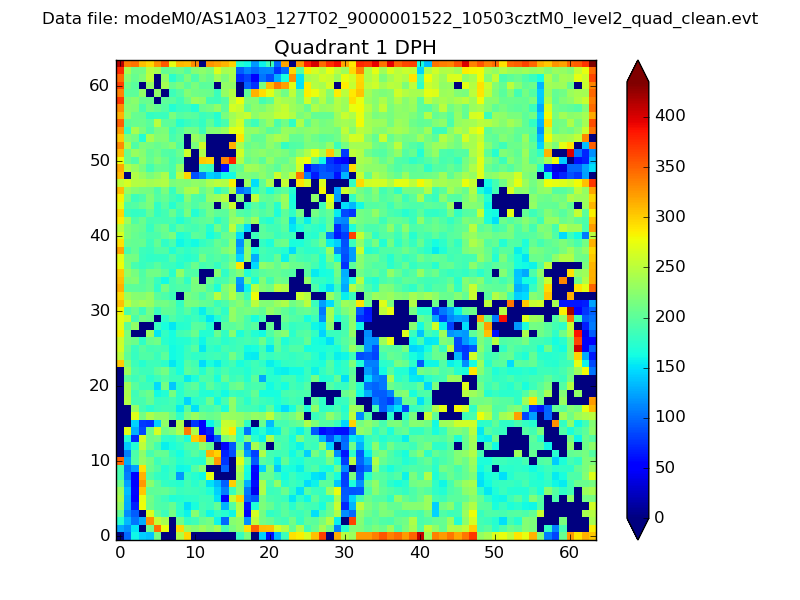 |
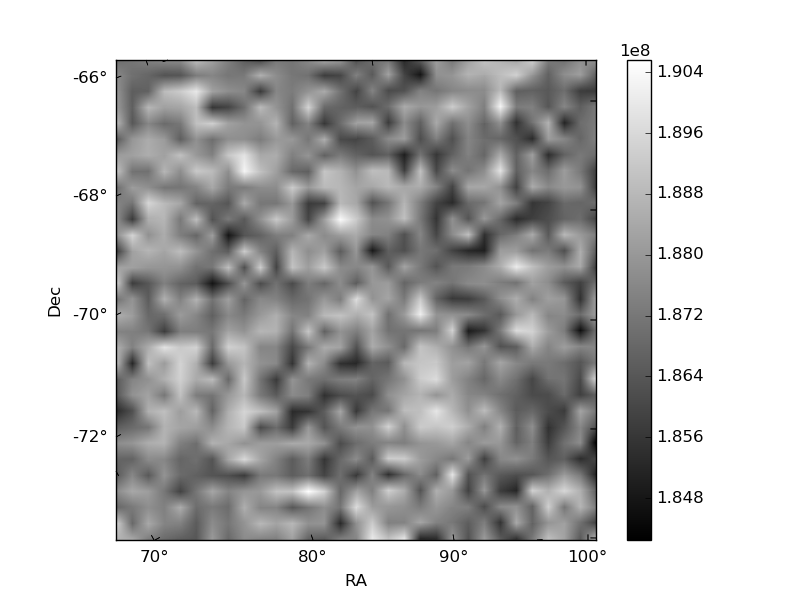
Quadrant B |
|---|---|---|---|
| Quadrant D | 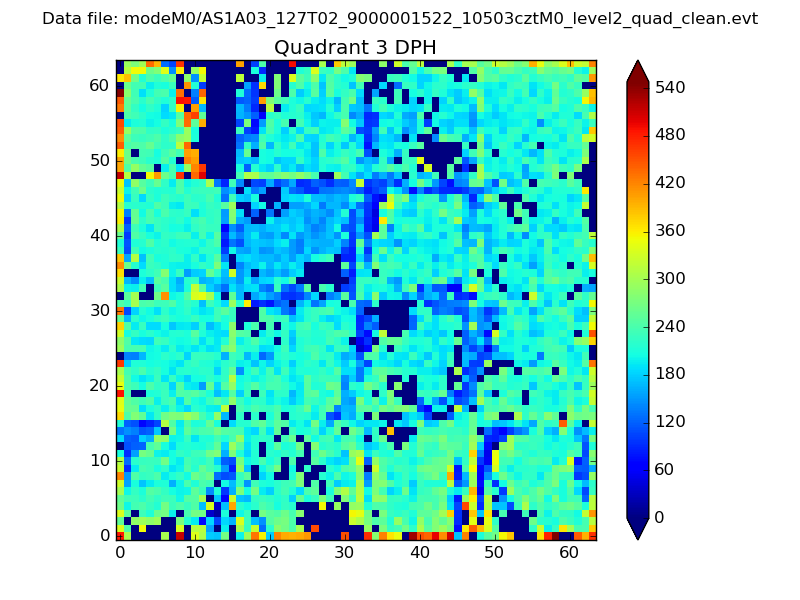 |
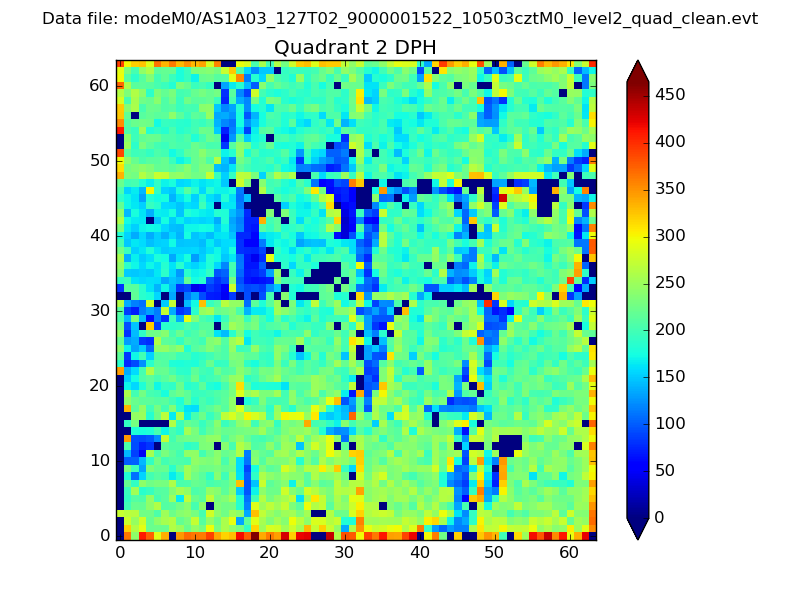 |
Quadrant C |
| Plot type | Count rate plots | Images |
|---|---|---|
| Comparison with Poisson distribution Blue bars denote a histogram of data divided into 1 sec bins. Red curve is a Poisson curve with rate = median count rate of data. |
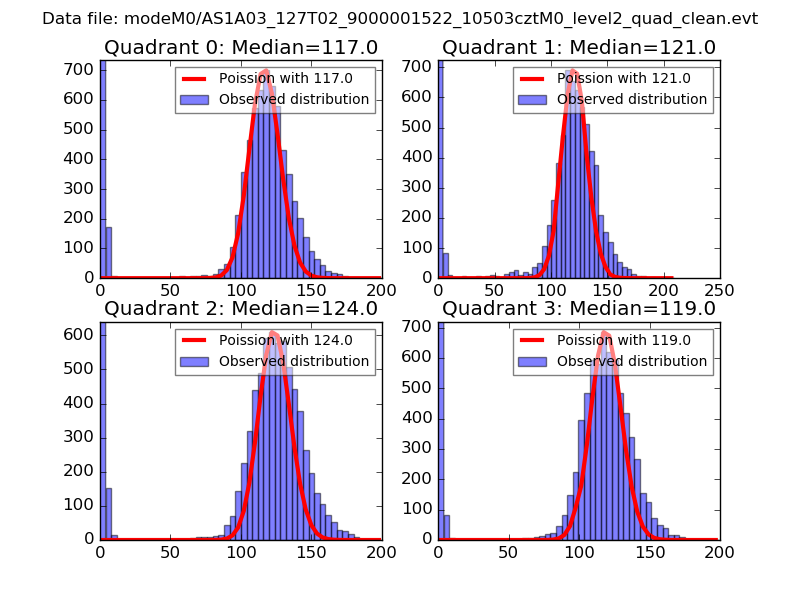 |
 |
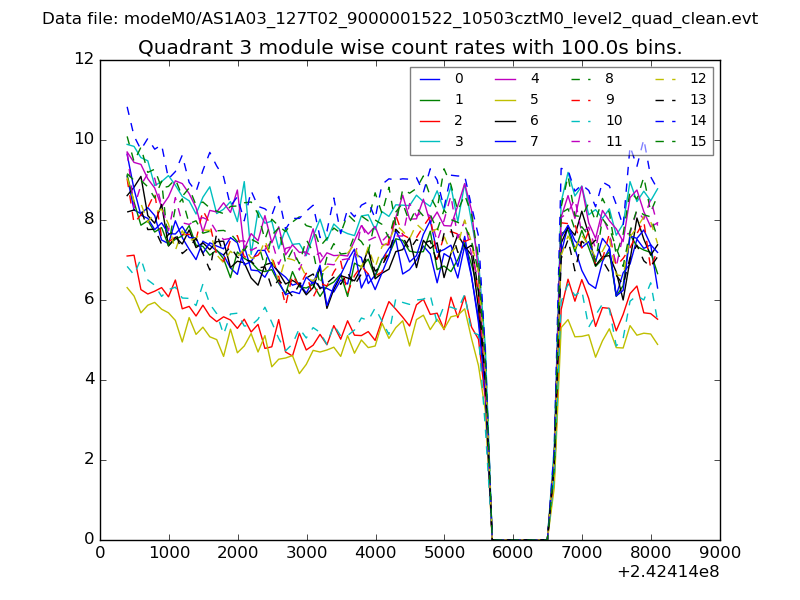
| Quadrant-wise count rates Data is divided into 100 sec bins |
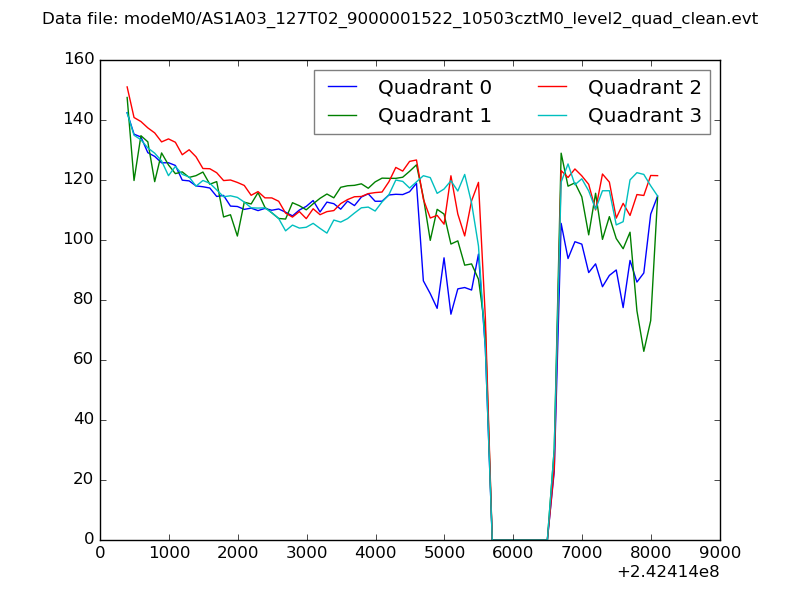 |
|
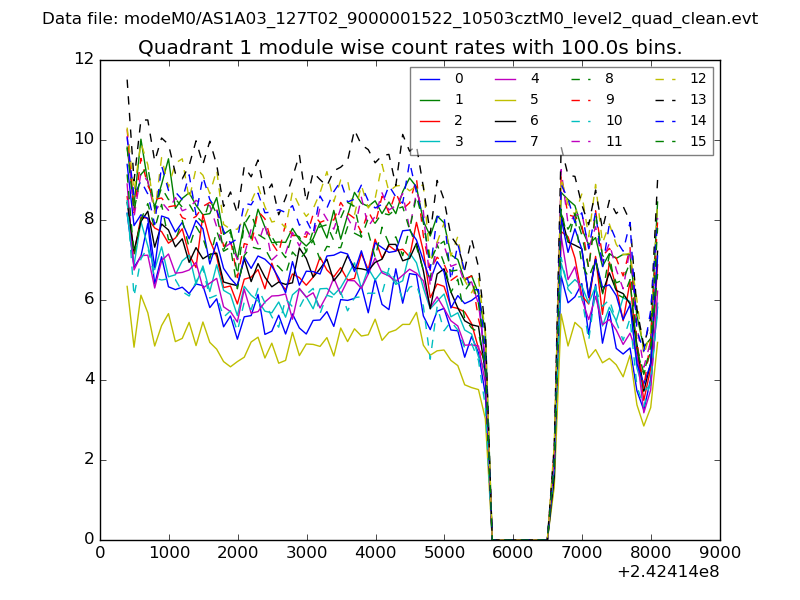
| Module-wise count rates for Quadrant A Data is divided into 100 sec bins |
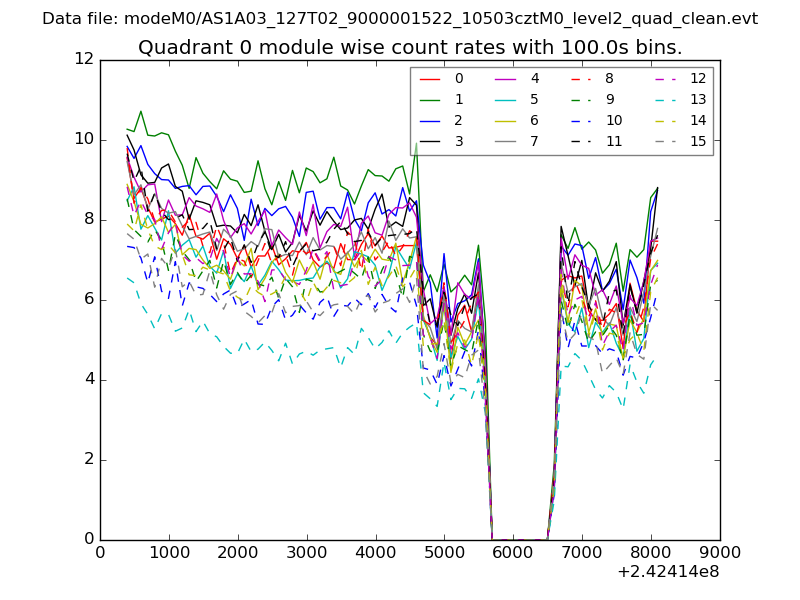 |
 |
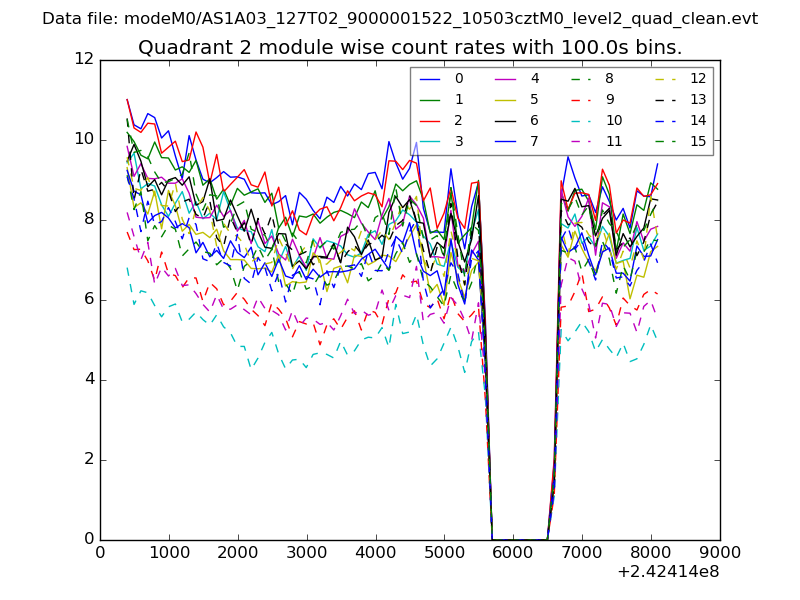
| Module-wise count rates for Quadrant B Data is divided into 100 sec bins |
 |
 |
| Module-wise count rates for Quadrant C Data is divided into 100 sec bins |
 |
 |
| Module-wise count rates for Quadrant D Data is divided into 100 sec bins |
 |
 |
| Parameter | Plot |
|---|---|
| CZT HV Monitor | 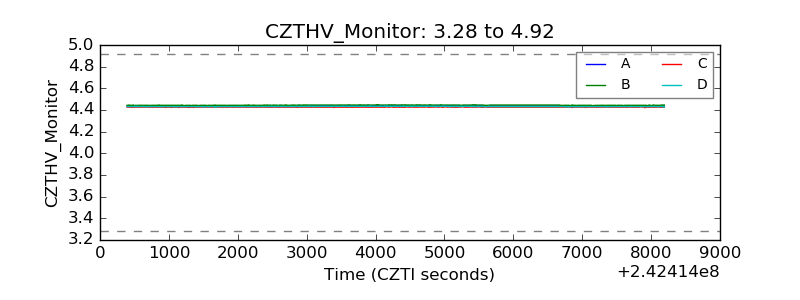 |
| D_VDD | 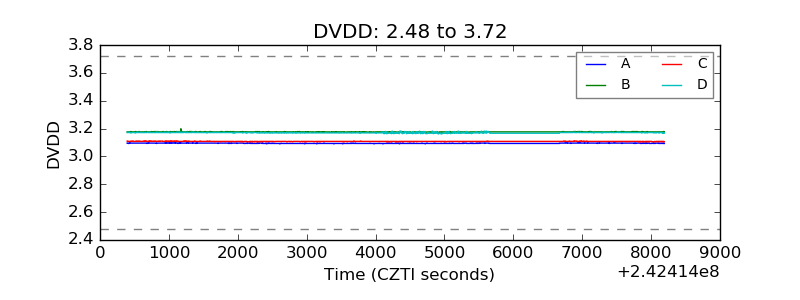 |
| Temperature 1 | 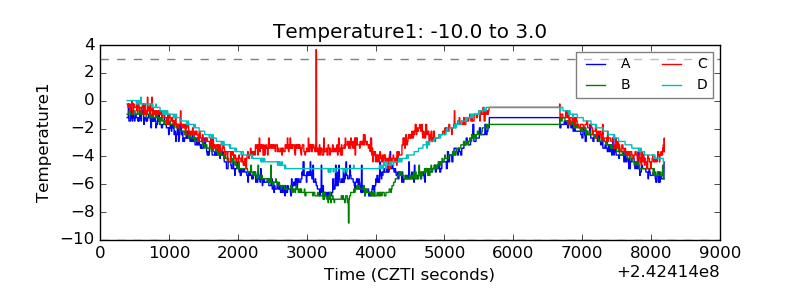 |
| Veto HV Monitor | 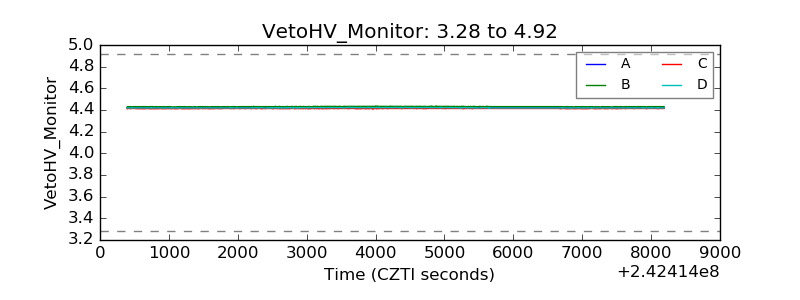 |
| Veto LLD | 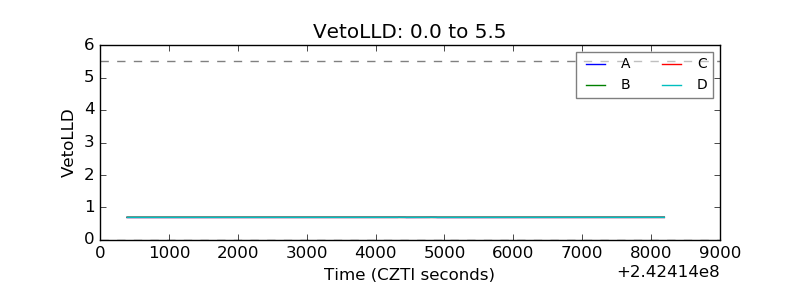 |
| Alpha Counter | 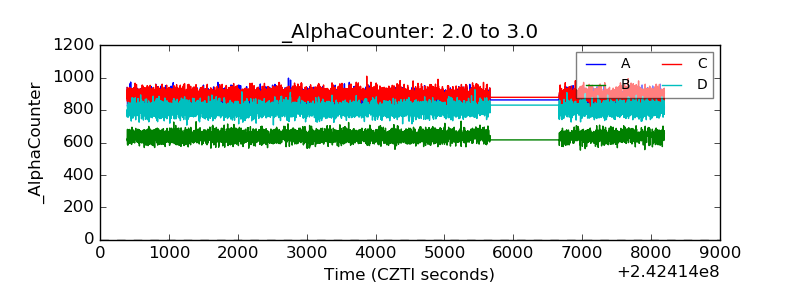 |
| _CPM_Rate | 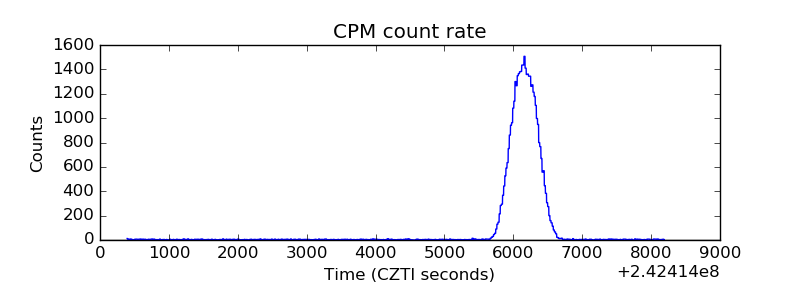 |
| CZT Counter | 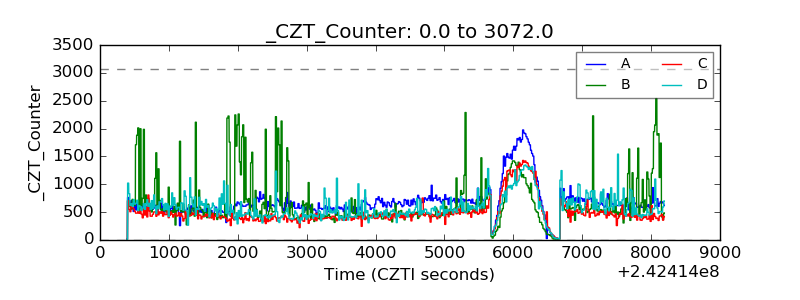 |
| +2.5 Volts monitor | 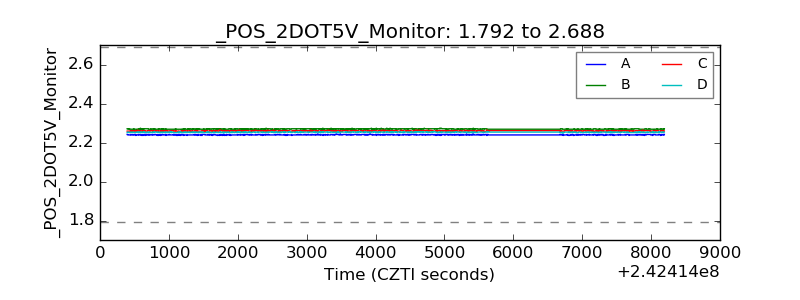 |
| +5 Volts monitor |  |
| _ROLL_ROT | 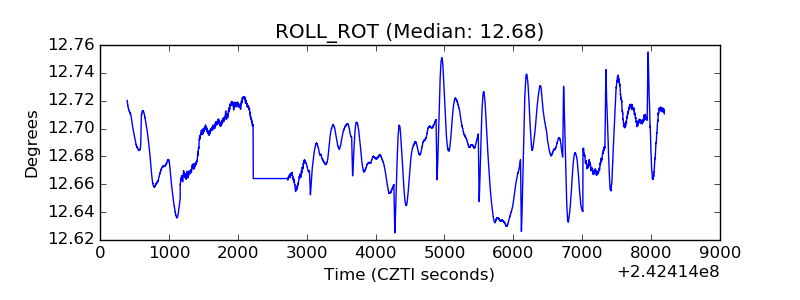 |
| _Roll_DEC | 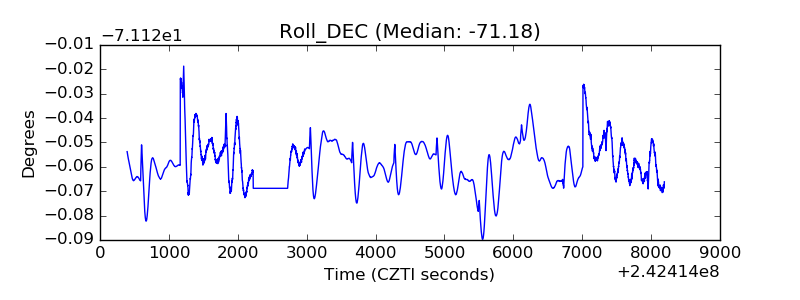 |
| _Roll_RA | 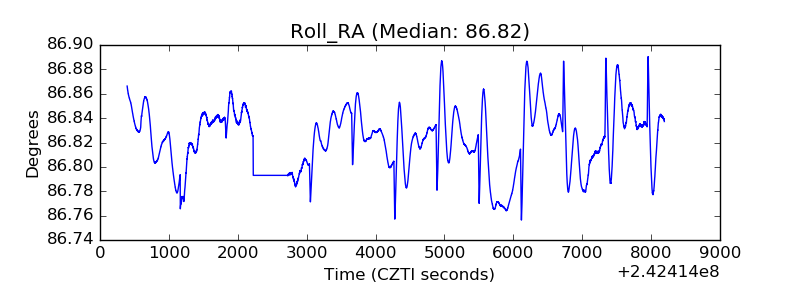 |
| Veto Counter | 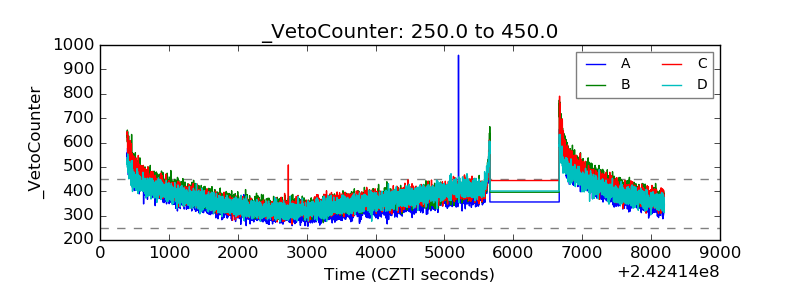 |