| Param | Original file | Final file |
|---|---|---|
| Filename | modeM0/AS1A03_127T02_9000001522_10505cztM0_level2.evt | modeM0/AS1A03_127T02_9000001522_10505cztM0_level2_quad_clean.evt |
| Size (bytes) | 526,181,760 | 122,224,320 |
| Size | 501.8 MB | 116.6 MB |
| Events in quadrant A | 4,200,164 | 806,569 |
| Events in quadrant B | 4,436,394 | 811,201 |
| Events in quadrant C | 2,920,921 | 840,744 |
| Events in quadrant D | 3,943,617 | 796,179 |
| Mode M9 | |||
|---|---|---|---|
| Quadrant | BADHDUFLAG | Total packets | Discarded packets |
| A | 0 | 12 | 0 |
| B | 0 | 12 | 0 |
| C | 0 | 12 | 0 |
| D | 0 | 13 | 0 |
| Mode M0 | |||
|---|---|---|---|
| Quadrant | BADHDUFLAG | Total packets | Discarded packets |
| A | 0 | 18087 | 7 |
| B | 0 | 17576 | 2 |
| C | 0 | 13100 | 2 |
| D | 0 | 16089 | 2 |
| Mode SS | |||
|---|---|---|---|
| Quadrant | BADHDUFLAG | Total packets | Discarded packets |
| A | 0 | 132 | 0 |
| B | 0 | 132 | 0 |
| C | 0 | 132 | 0 |
| D | 0 | 132 | 0 |
| Quadrant | Total seconds | Saturated seconds | Saturation percentage |
|---|---|---|---|
| A | 6403 | 60 | 0.937061% |
| B | 6404 | 408 | 6.371018% |
| C | 6404 | 34 | 0.530918% |
| D | 6404 | 52 | 0.811993% |
Noise dominated data is calculated using 1-second bins in cleaned event files. If a bin has >2000 counts, and if more than 50% of those come from <1% of pixels, then it is considered to be noise-dominated and hence unusable.
| Quadrant | # 1 sec bins | Bins with >0 counts | Bins with >2000 counts | High rate bins dominated by noise | Noise dominated (total time) | Noise dominated (detector-on time) | Marked lightcurve |
|---|---|---|---|---|---|---|---|
| A | 7529 | 6405 | 4 | 4 | 0.05% | 0.06% | 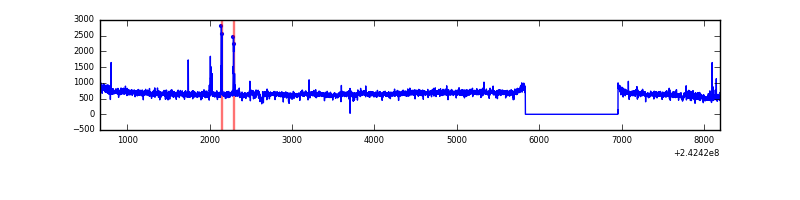 |
| B | 7529 | 6405 | 239 | 239 | 3.17% | 3.73% | 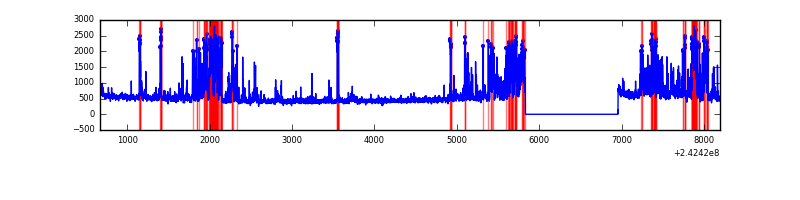 |
| C | 7529 | 6405 | 0 | 0 | 0.00% | 0.00% | 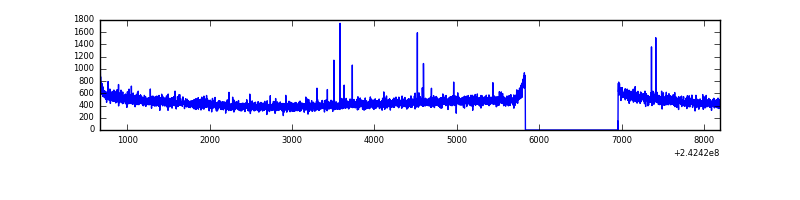 |
| D | 7529 | 6405 | 15 | 15 | 0.20% | 0.23% | 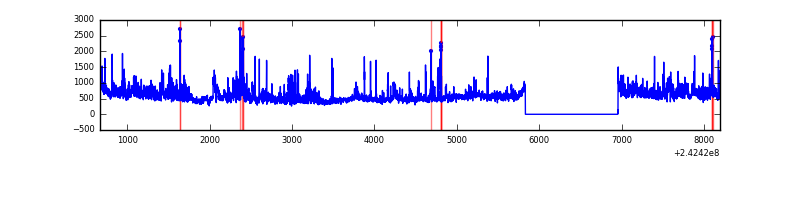 |
Top three noisy pixels from each quadrant. If the there are fewer than three noisy pixels in the level2.evt file, extra rows are filled as -1
| Pixel properties | Quadrant properties | ||||||
|---|---|---|---|---|---|---|---|
| Quadrant | DetID | PixID | Counts | Sigma | Mean | Median | Sigma |
| A | 15 | 239 | 1145635 | 7540.01 | 754 | 738 | 151.8 |
| A | 3 | 80 | 87084 | 568.65 | 754 | 738 | 151.8 |
| A | 15 | 174 | 36424 | 235.02 | 754 | 738 | 151.8 |
| B | 4 | 239 | 1352654 | 9636.73 | 749 | 731 | 140.3 |
| B | 11 | 51 | 63620 | 448.28 | 749 | 731 | 140.3 |
| B | 0 | 214 | 31791 | 221.4 | 749 | 731 | 140.3 |
| C | 14 | 234 | 12448 | 68.25 | 743 | 745 | 171.5 |
| C | 11 | 7 | 5802 | 29.49 | 743 | 745 | 171.5 |
| C | 13 | 61 | 5493 | 27.69 | 743 | 745 | 171.5 |
| D | 2 | 16 | 389552 | 2217.85 | 734 | 711 | 175.3 |
| D | 8 | 195 | 335701 | 1910.69 | 734 | 711 | 175.3 |
| D | 1 | 52 | 190526 | 1082.65 | 734 | 711 | 175.3 |
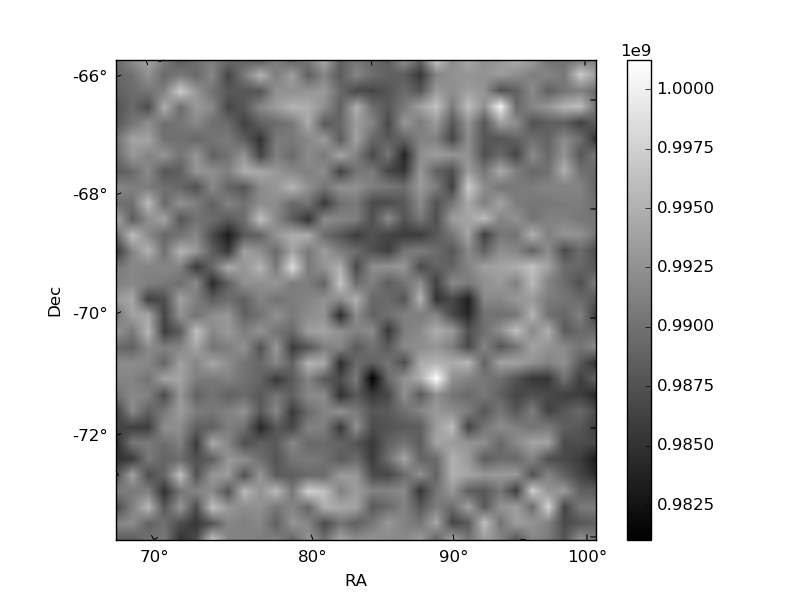
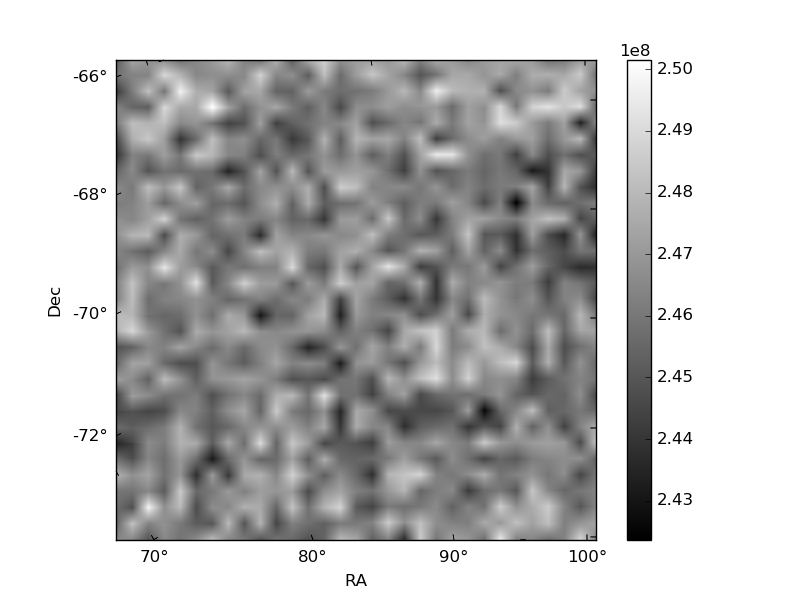
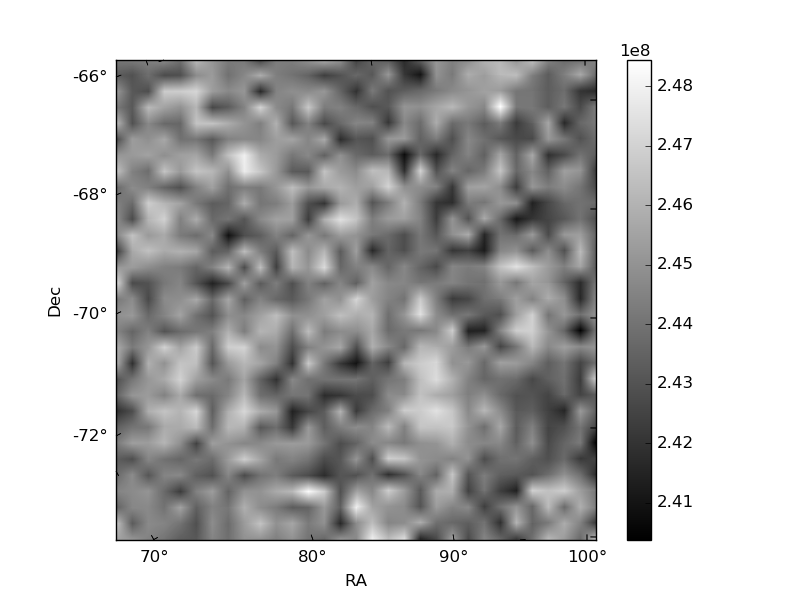
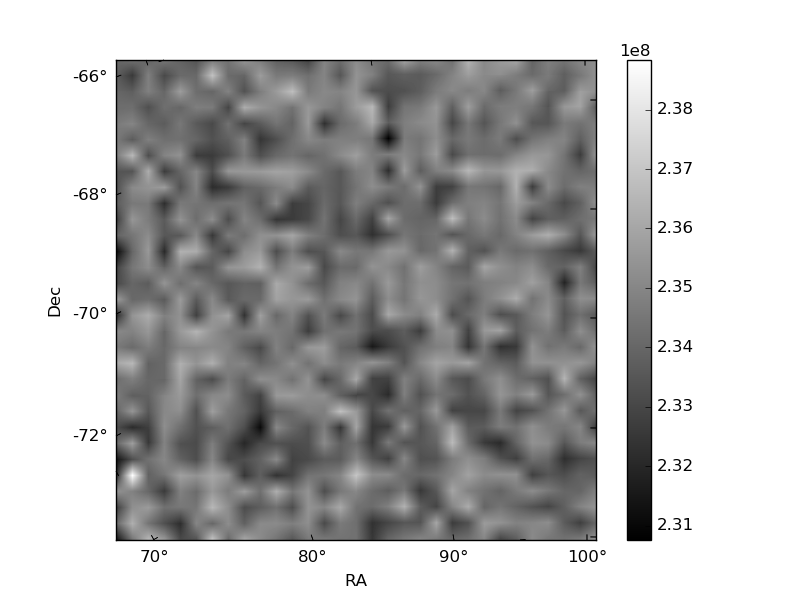
Histogram calculated using DETX and DETY for each event in the final _common_clean file
| Quadrant A | 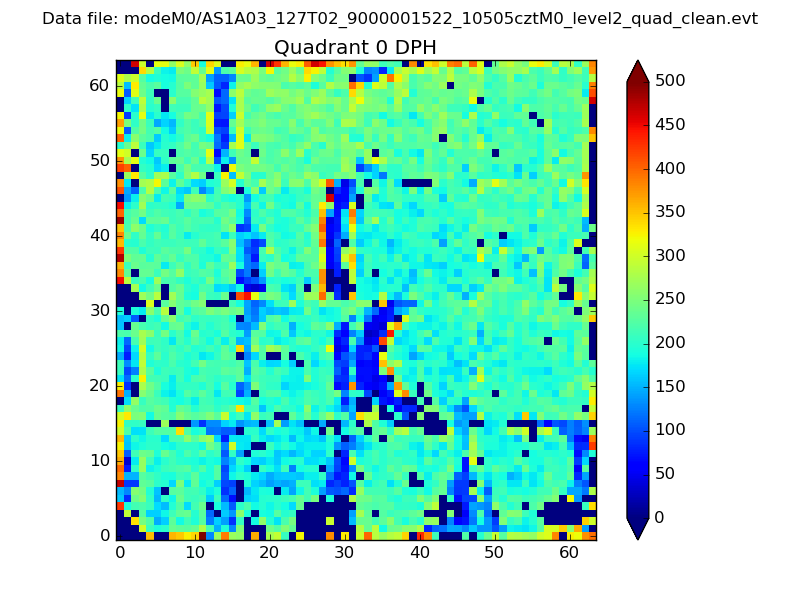 |
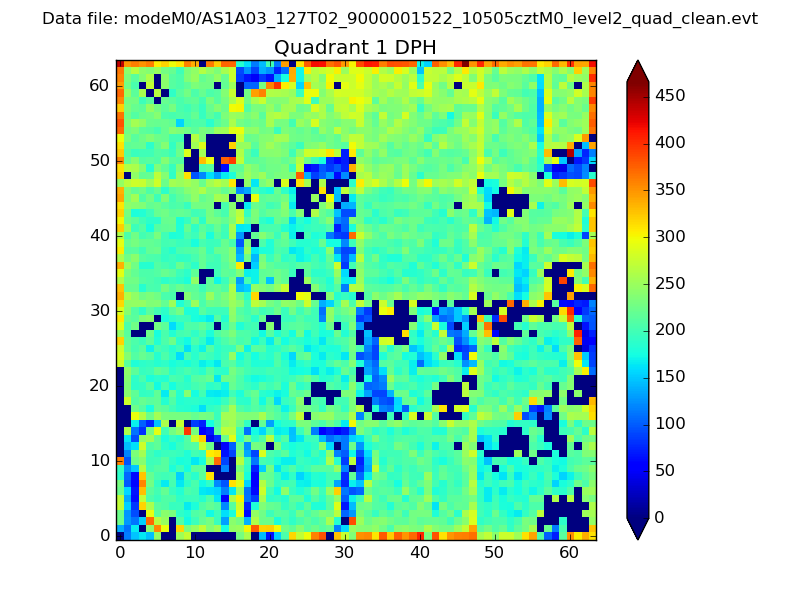 |
Quadrant B |
|---|---|---|---|
| Quadrant D | 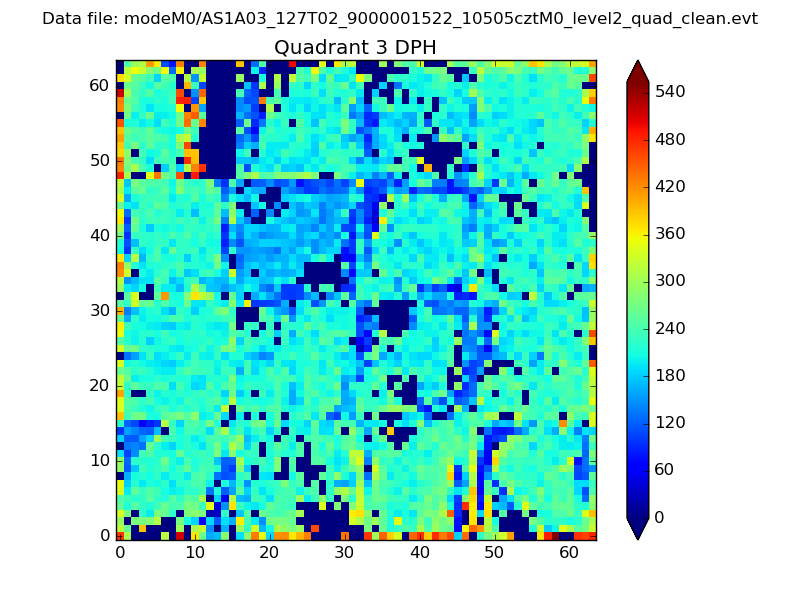 |
 |
Quadrant C |
| Plot type | Count rate plots | Images |
|---|---|---|
| Comparison with Poisson distribution Blue bars denote a histogram of data divided into 1 sec bins. Red curve is a Poisson curve with rate = median count rate of data. |
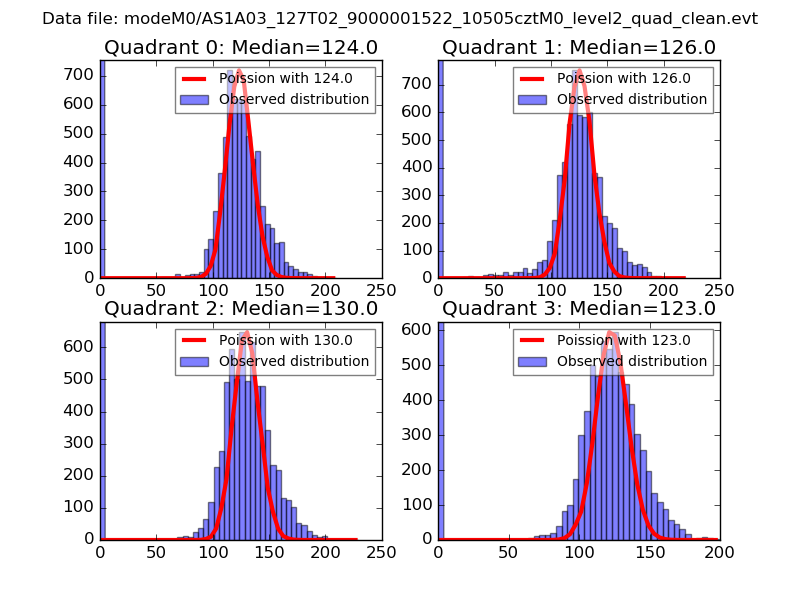 |
 |
| Quadrant-wise count rates Data is divided into 100 sec bins |
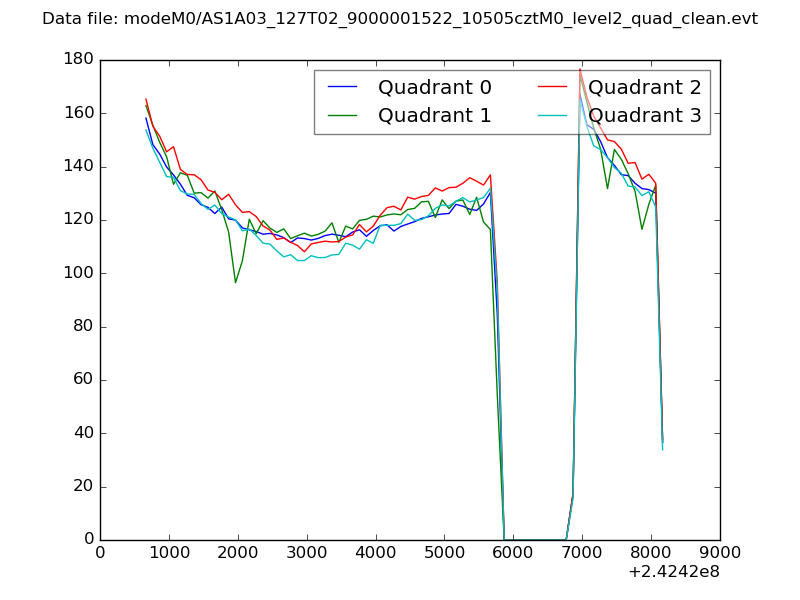 |
|
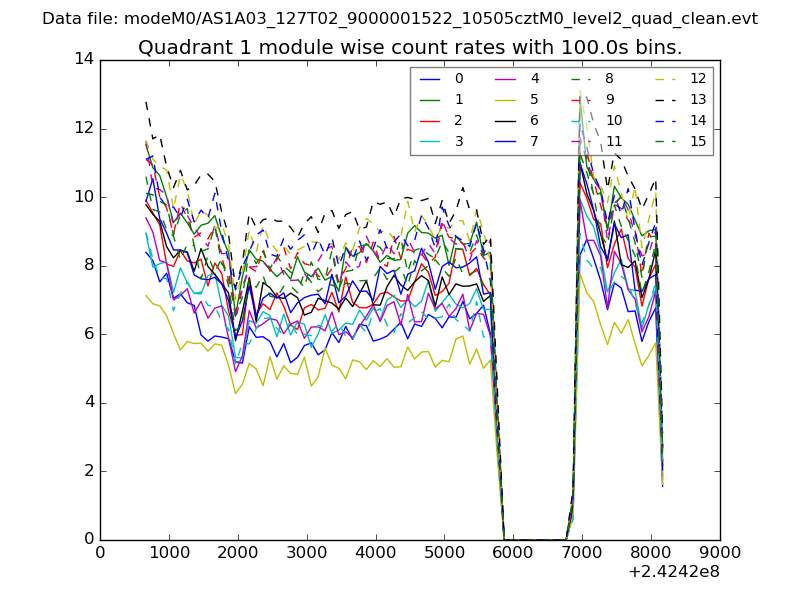
| Module-wise count rates for Quadrant A Data is divided into 100 sec bins |
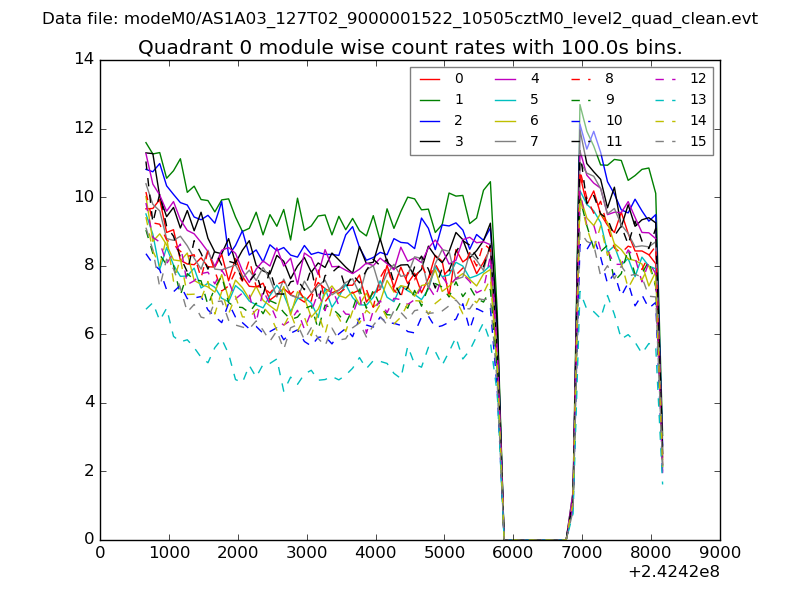 |
 |
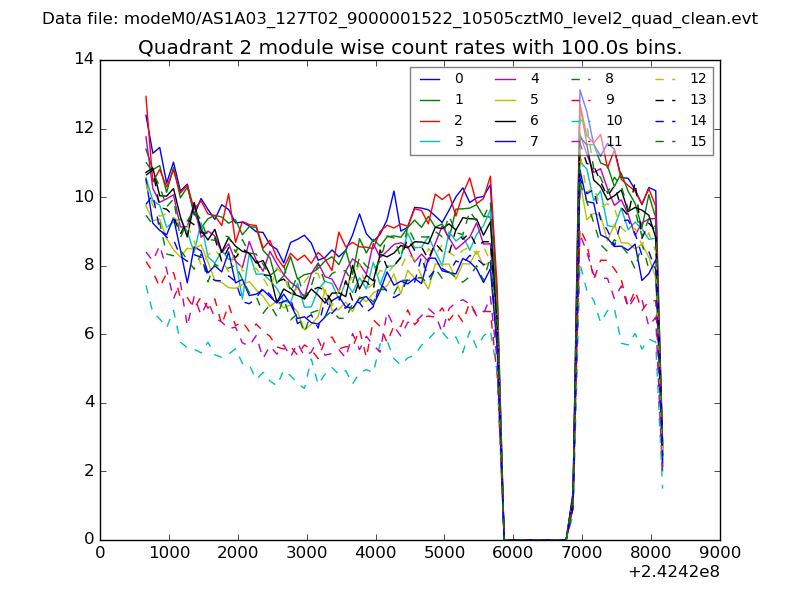
| Module-wise count rates for Quadrant B Data is divided into 100 sec bins |
 |
 |
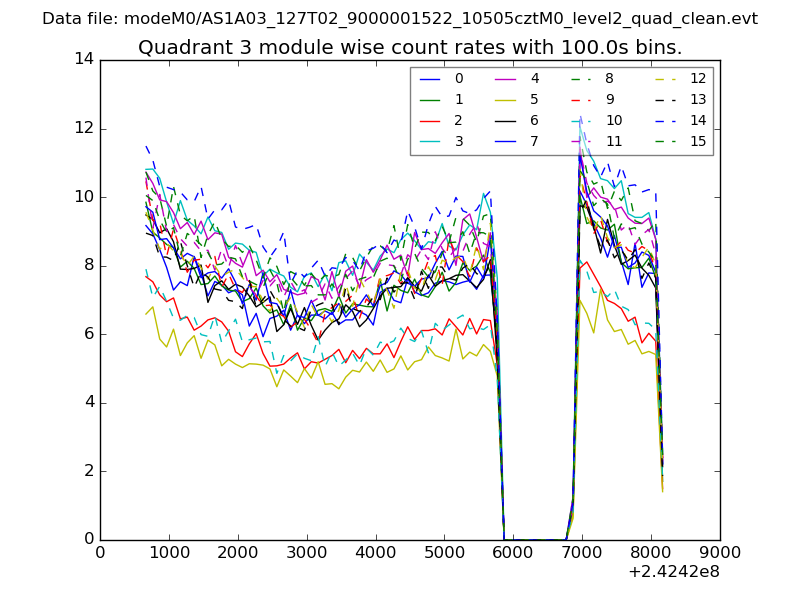
| Module-wise count rates for Quadrant C Data is divided into 100 sec bins |
 |
 |
| Module-wise count rates for Quadrant D Data is divided into 100 sec bins |
 |
 |
| Parameter | Plot |
|---|---|
| CZT HV Monitor | 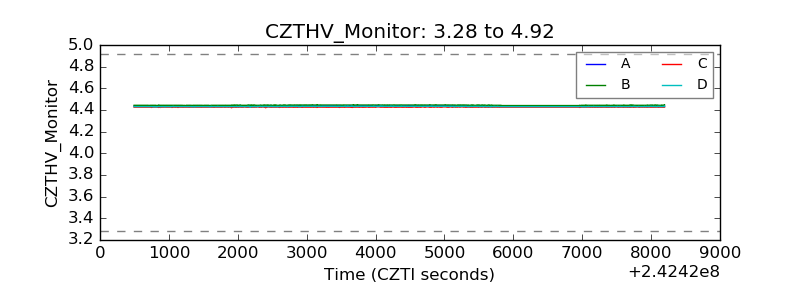 |
| D_VDD | 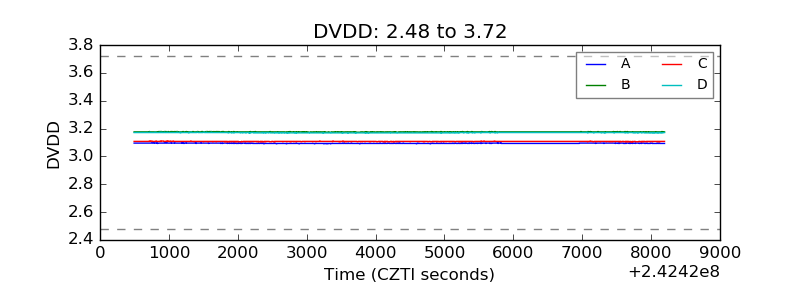 |
| Temperature 1 |  |
| Veto HV Monitor |  |
| Veto LLD | 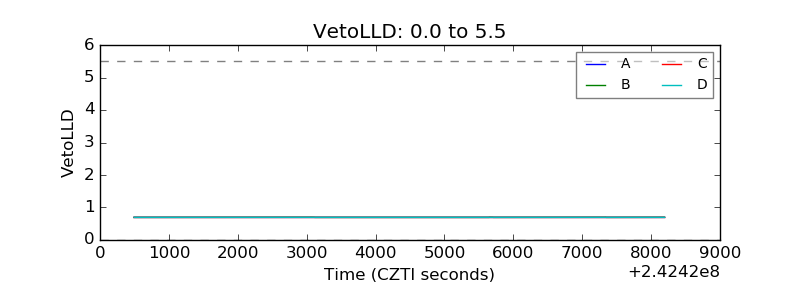 |
| Alpha Counter | 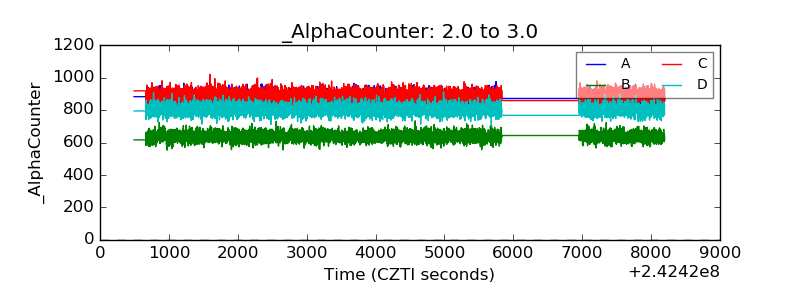 |
| _CPM_Rate | 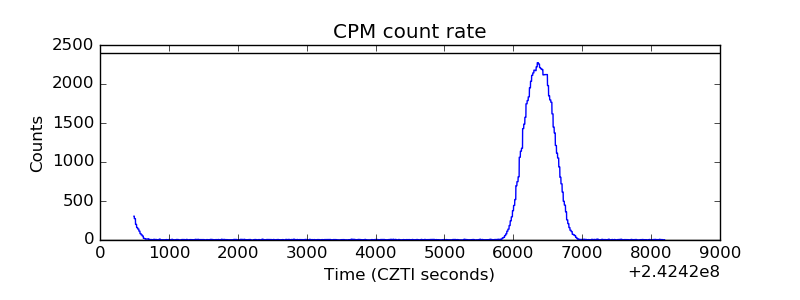 |
| CZT Counter |  |
| +2.5 Volts monitor |  |
| +5 Volts monitor |  |
| _ROLL_ROT | 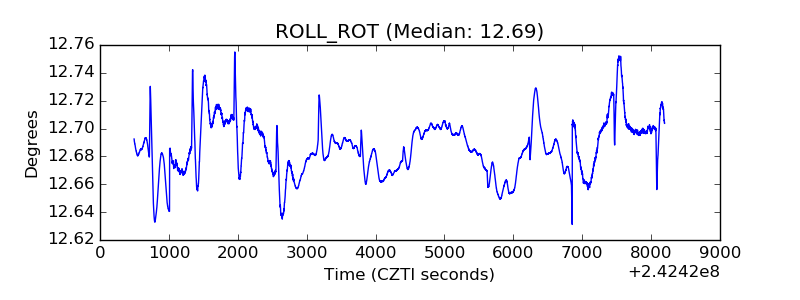 |
| _Roll_DEC | 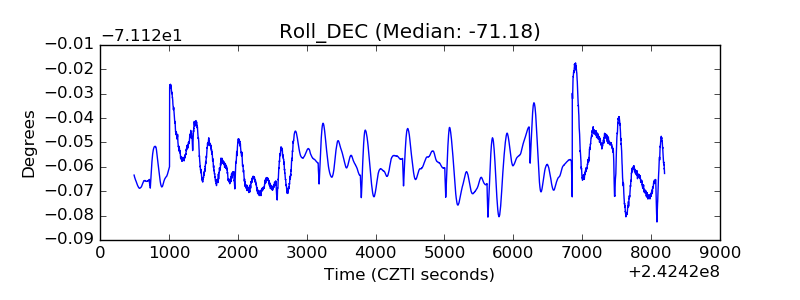 |
| _Roll_RA | 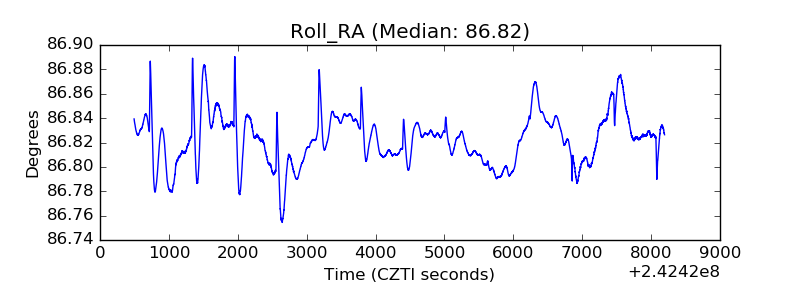 |
| Veto Counter | 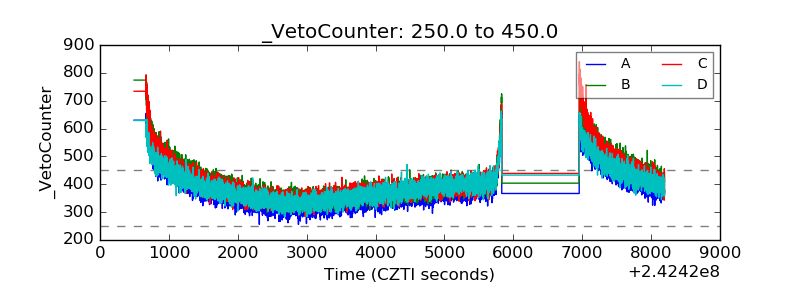 |