| Param | Original file | Final file |
|---|---|---|
| Filename | modeM0/AS1A03_127T02_9000001522_10506cztM0_level2.evt | modeM0/AS1A03_127T02_9000001522_10506cztM0_level2_quad_clean.evt |
| Size (bytes) | 1,300,613,760 | 351,990,720 |
| Size | 1.2 GB | 335.7 MB |
| Events in quadrant A | 9,103,754 | 2,148,151 |
| Events in quadrant B | 8,438,120 | 2,079,081 |
| Events in quadrant C | 8,881,477 | 2,517,932 |
| Events in quadrant D | 11,659,916 | 2,588,845 |
| Mode M9 | |||
|---|---|---|---|
| Quadrant | BADHDUFLAG | Total packets | Discarded packets |
| A | 0 | 67 | 29 |
| B | 0 | 71 | 33 |
| C | 0 | 71 | 33 |
| D | 0 | 64 | 26 |
| Mode M0 | |||
|---|---|---|---|
| Quadrant | BADHDUFLAG | Total packets | Discarded packets |
| A | 0 | 119870 | 80782 |
| B | 0 | 125863 | 89756 |
| C | 0 | 98445 | 58037 |
| D | 0 | 112662 | 64162 |
| Mode SS | |||
|---|---|---|---|
| Quadrant | BADHDUFLAG | Total packets | Discarded packets |
| A | 0 | 988 | 529 |
| B | 0 | 988 | 531 |
| C | 0 | 988 | 532 |
| D | 0 | 939 | 496 |
| Quadrant | Total seconds | Saturated seconds | Saturation percentage |
|---|---|---|---|
| A | 17890 | 102 | 0.570151% |
| B | 16946 | 104 | 0.613714% |
| C | 20018 | 60 | 0.299730% |
| D | 21650 | 70 | 0.323326% |
Noise dominated data is calculated using 1-second bins in cleaned event files. If a bin has >2000 counts, and if more than 50% of those come from <1% of pixels, then it is considered to be noise-dominated and hence unusable.
| Quadrant | # 1 sec bins | Bins with >0 counts | Bins with >2000 counts | High rate bins dominated by noise | Noise dominated (total time) | Noise dominated (detector-on time) | Marked lightcurve |
|---|---|---|---|---|---|---|---|
| A | 35160 | 21307 | 0 | 0 | 0.00% | 0.00% | 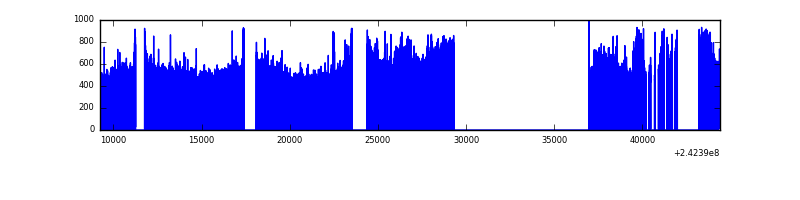 |
| B | 35160 | 20396 | 0 | 0 | 0.00% | 0.00% | 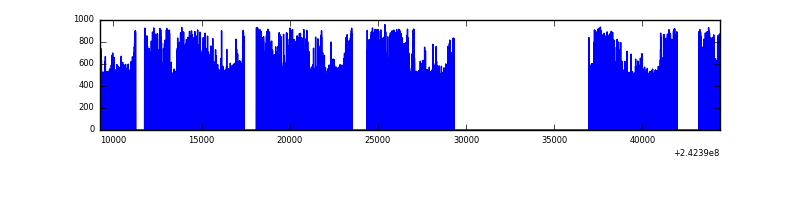 |
| C | 35160 | 23322 | 0 | 0 | 0.00% | 0.00% | 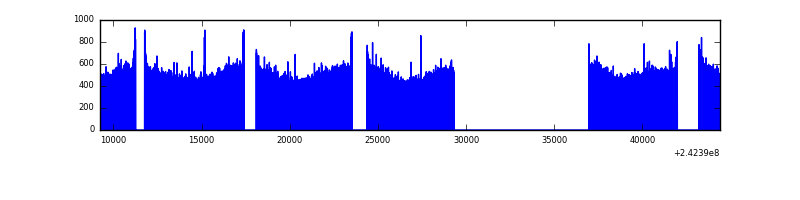 |
| D | 35160 | 23049 | 0 | 0 | 0.00% | 0.00% | 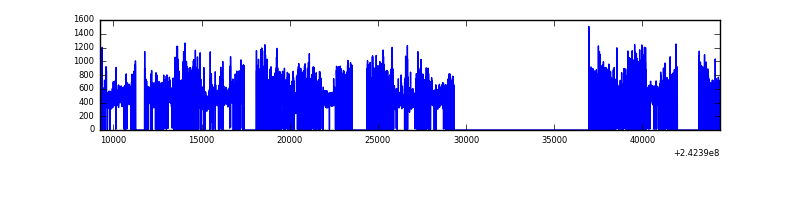 |
Top three noisy pixels from each quadrant. If the there are fewer than three noisy pixels in the level2.evt file, extra rows are filled as -1
| Pixel properties | Quadrant properties | ||||||
|---|---|---|---|---|---|---|---|
| Quadrant | DetID | PixID | Counts | Sigma | Mean | Median | Sigma |
| A | 15 | 239 | 941096 | 2286.61 | 2037 | 1994 | 410.7 |
| A | 3 | 80 | 238848 | 576.71 | 2037 | 1994 | 410.7 |
| A | 5 | 16 | 29622 | 67.27 | 2037 | 1994 | 410.7 |
| B | 4 | 239 | 500318 | 1367.53 | 1944 | 1896 | 364.5 |
| B | 11 | 51 | 139619 | 377.87 | 1944 | 1896 | 364.5 |
| B | 0 | 214 | 129586 | 350.34 | 1944 | 1896 | 364.5 |
| C | 13 | 61 | 16939 | 28.21 | 2273 | 2282 | 519.5 |
| C | 14 | 234 | 11429 | 17.61 | 2273 | 2282 | 519.5 |
| C | 8 | 222 | 7039 | 9.16 | 2273 | 2282 | 519.5 |
| D | 2 | 16 | 716007 | 1243.67 | 2426 | 2356 | 573.8 |
| D | 1 | 52 | 581346 | 1009.0 | 2426 | 2356 | 573.8 |
| D | 8 | 195 | 439803 | 762.33 | 2426 | 2356 | 573.8 |
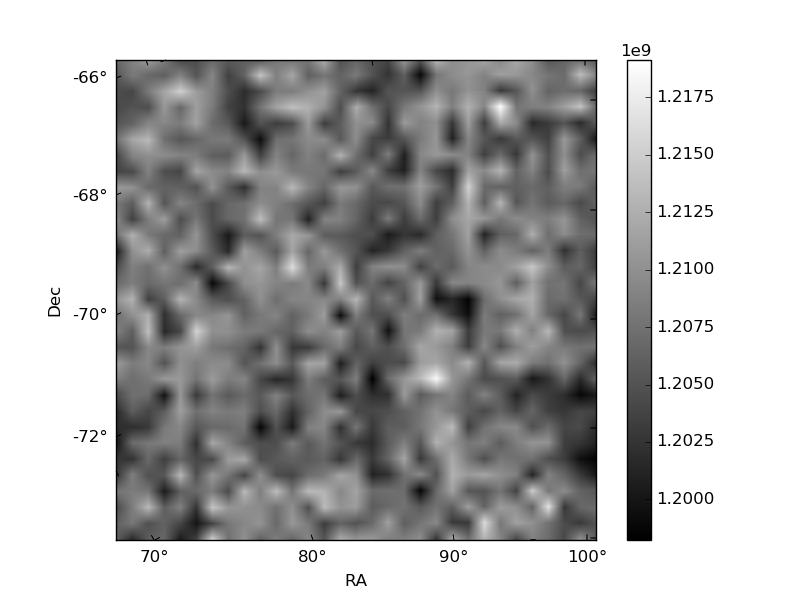
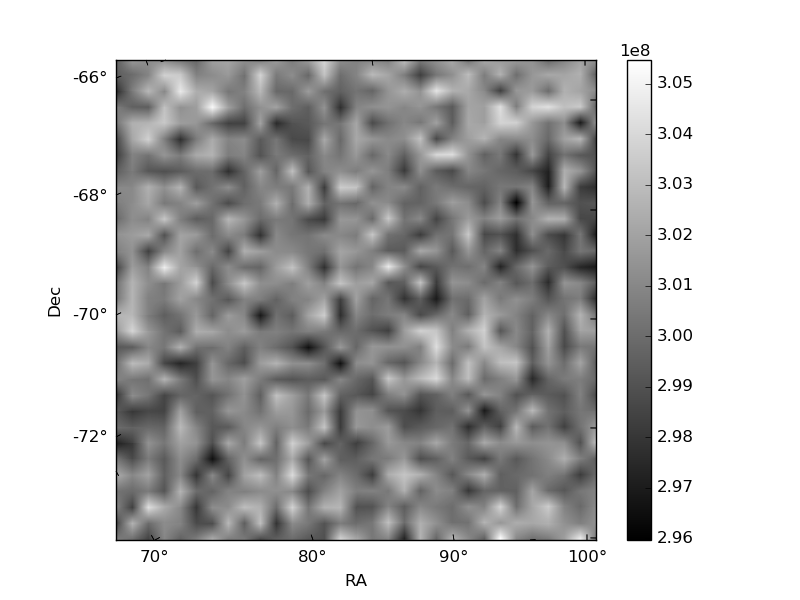
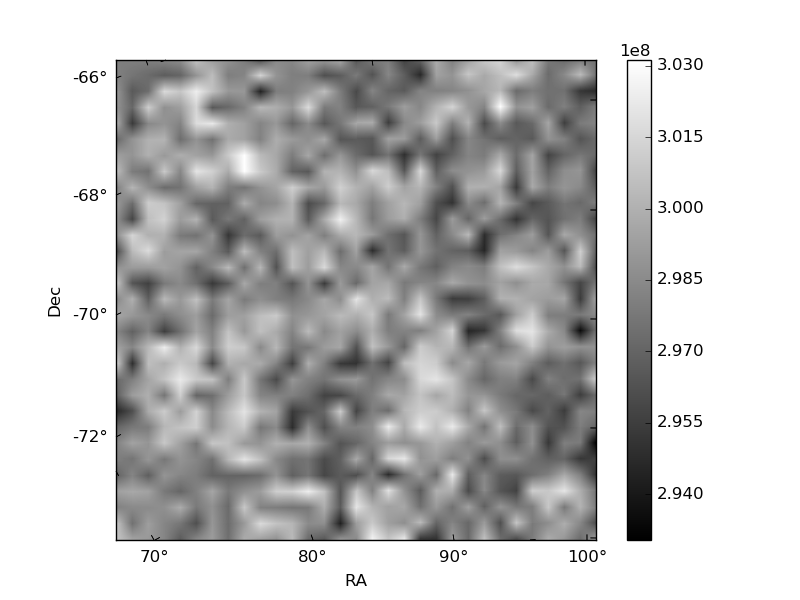
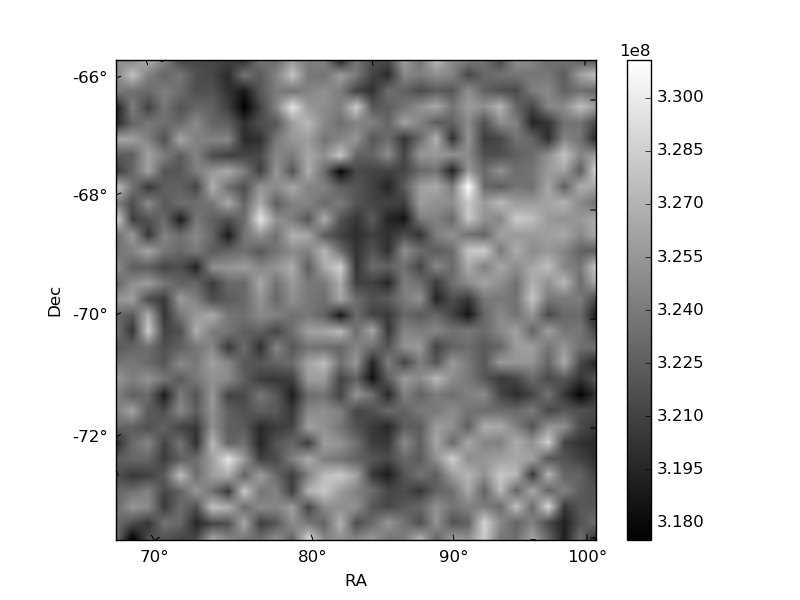
Histogram calculated using DETX and DETY for each event in the final _common_clean file
| Quadrant A | 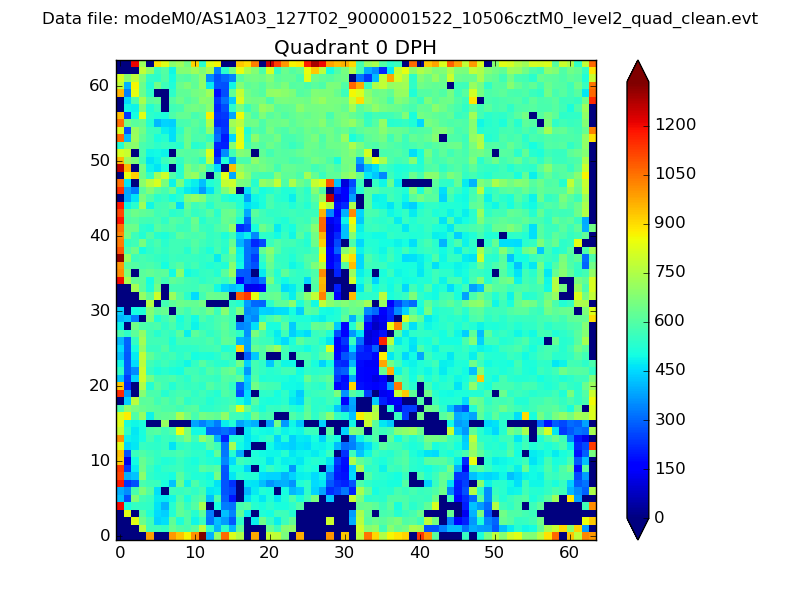 |
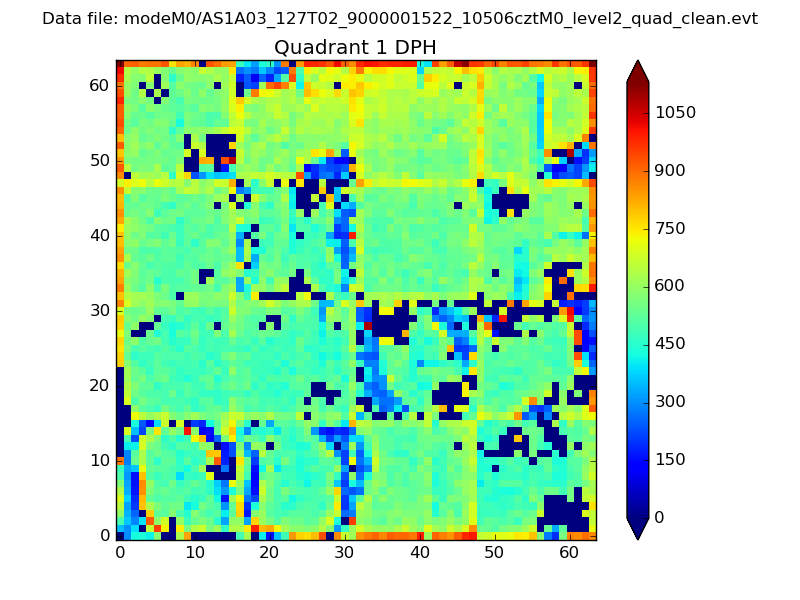 |
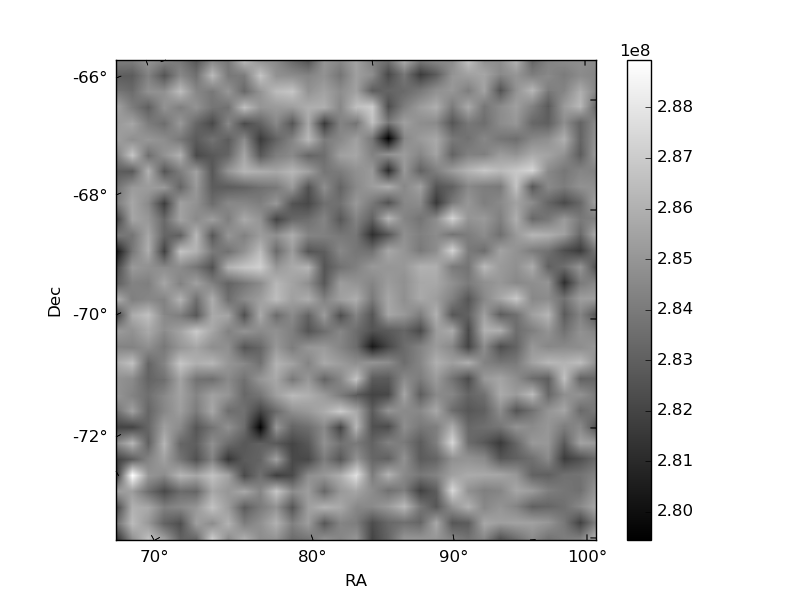
Quadrant B |
|---|---|---|---|
| Quadrant D | 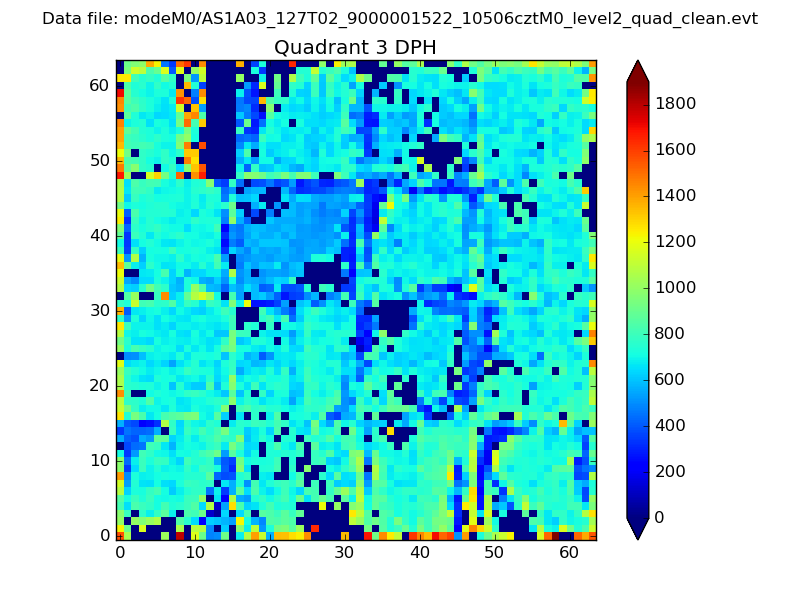 |
 |
Quadrant C |
| Plot type | Count rate plots | Images |
|---|---|---|
| Comparison with Poisson distribution Blue bars denote a histogram of data divided into 1 sec bins. Red curve is a Poisson curve with rate = median count rate of data. |
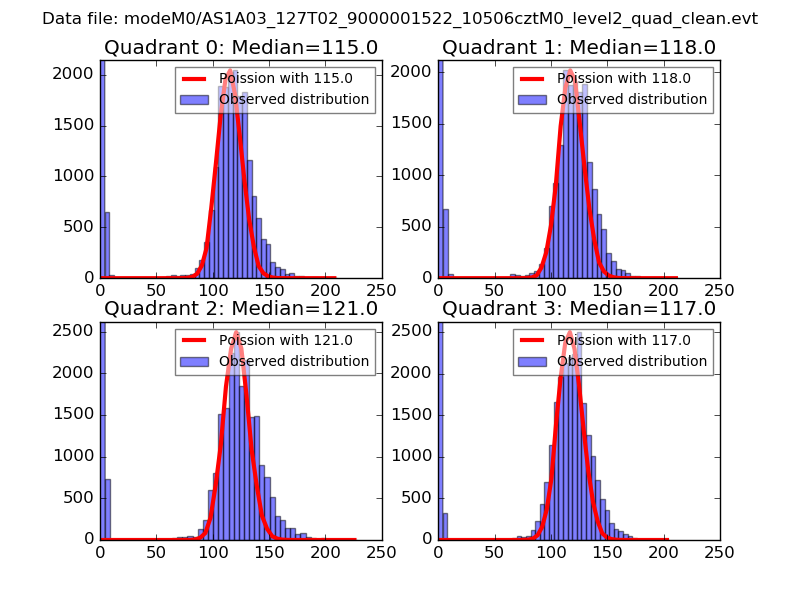 |
 |
| Quadrant-wise count rates Data is divided into 100 sec bins |
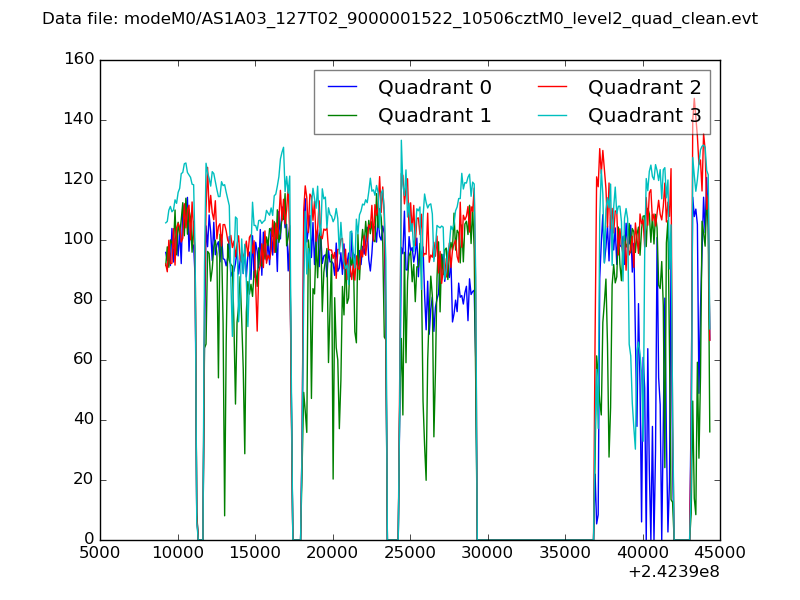 |
|
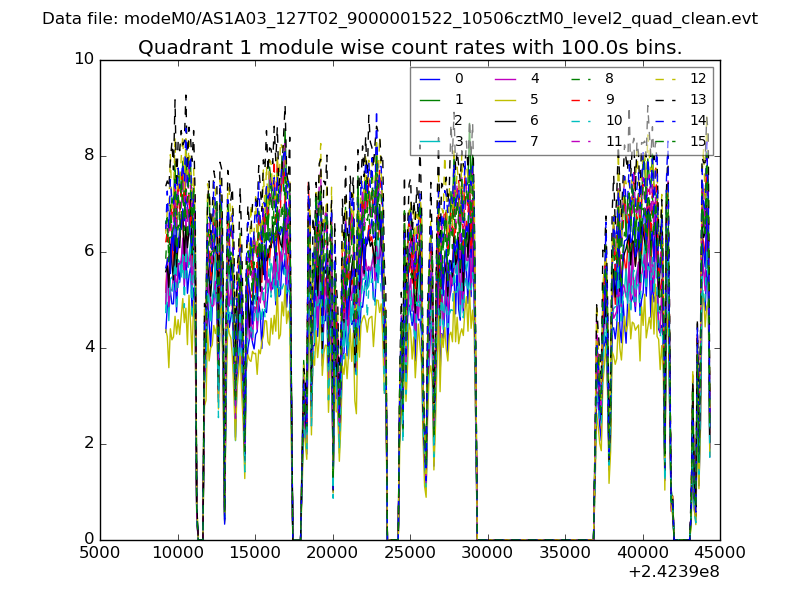
| Module-wise count rates for Quadrant A Data is divided into 100 sec bins |
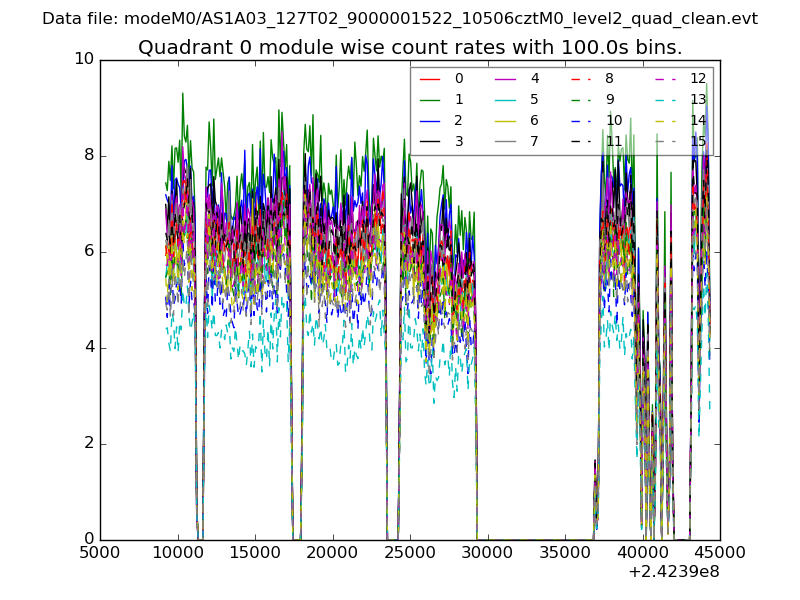 |
 |
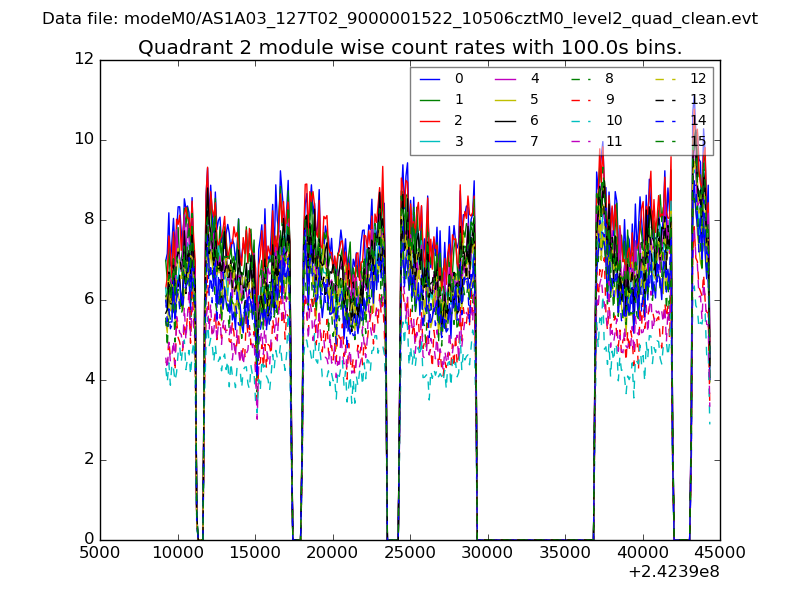
| Module-wise count rates for Quadrant B Data is divided into 100 sec bins |
 |
 |
| Module-wise count rates for Quadrant C Data is divided into 100 sec bins |
 |
 |
| Module-wise count rates for Quadrant D Data is divided into 100 sec bins |
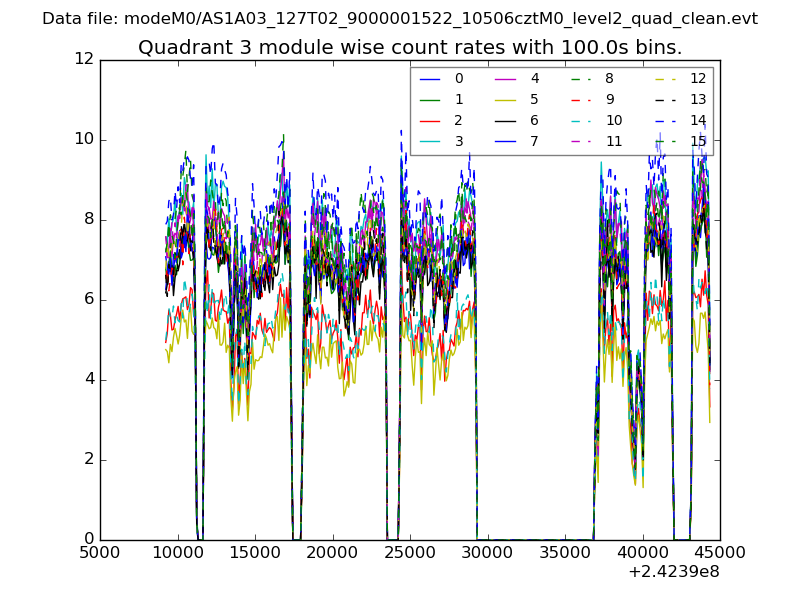 |
 |
| Parameter | Plot |
|---|---|
| CZT HV Monitor | 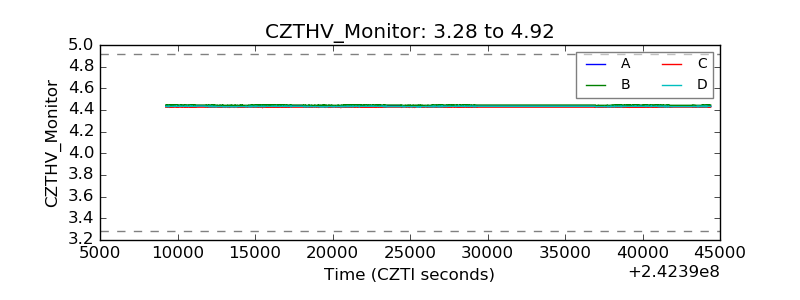 |
| D_VDD | 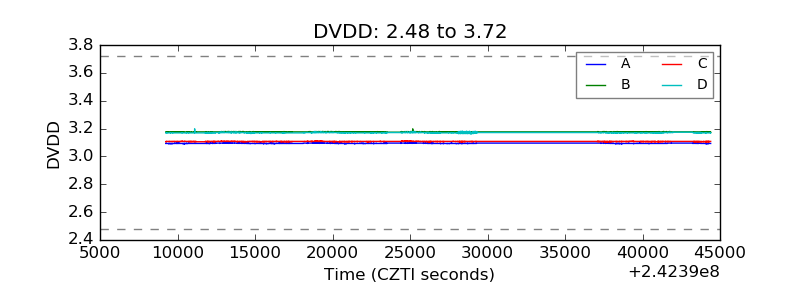 |
| Temperature 1 | 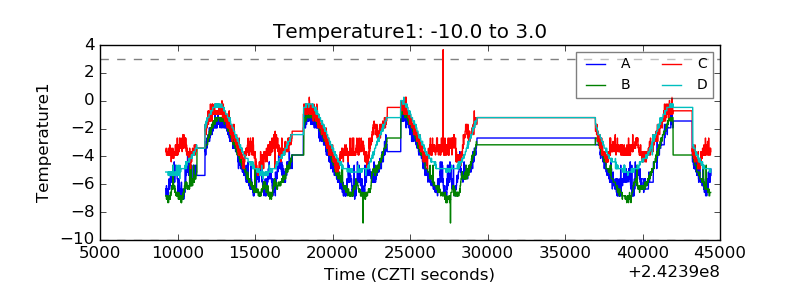 |
| Veto HV Monitor | 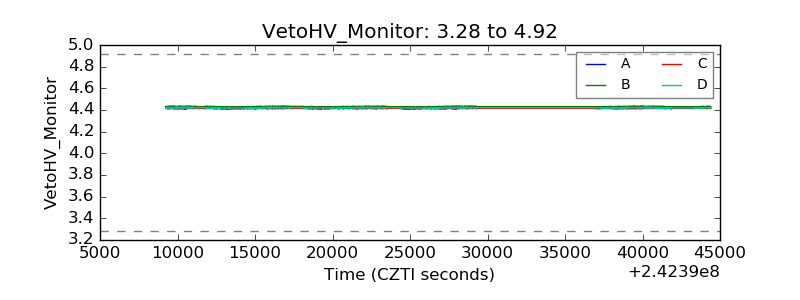 |
| Veto LLD | 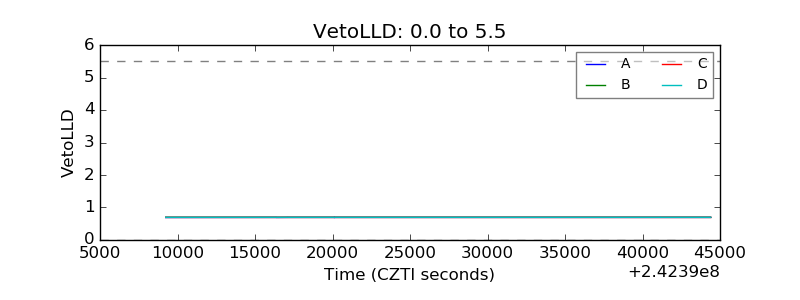 |
| Alpha Counter | 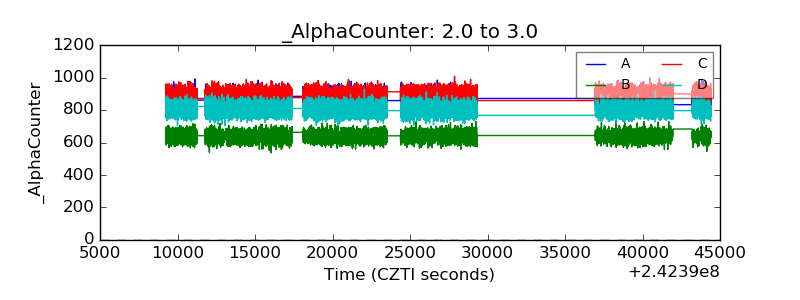 |
| _CPM_Rate | 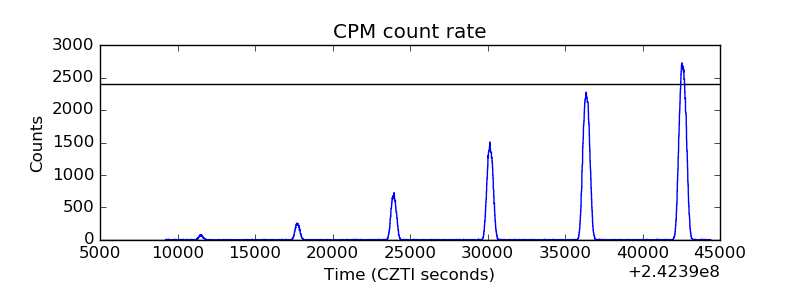 |
| CZT Counter | 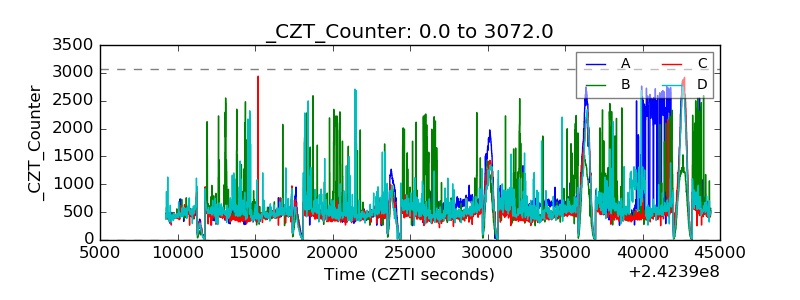 |
| +2.5 Volts monitor | 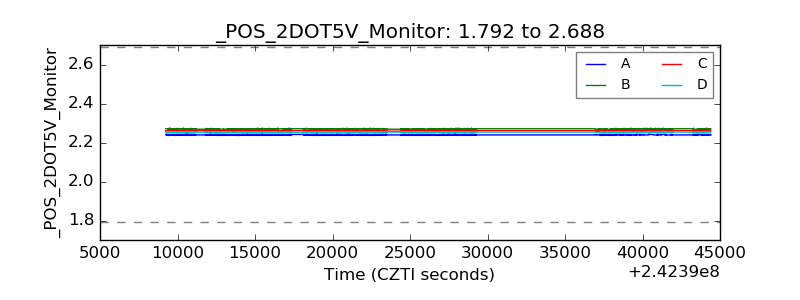 |
| +5 Volts monitor | 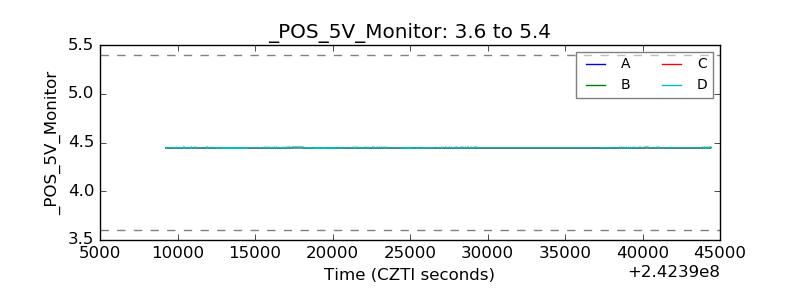 |
| _ROLL_ROT | 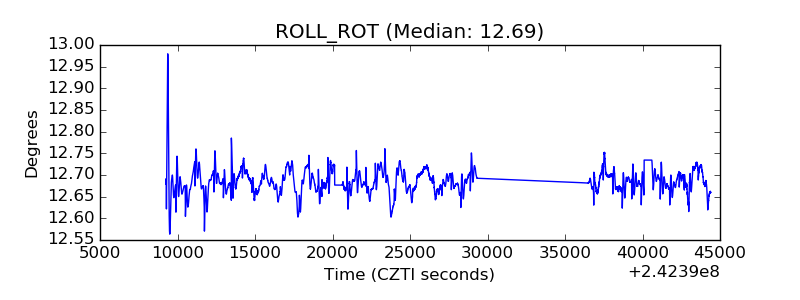 |
| _Roll_DEC |  |
| _Roll_RA | 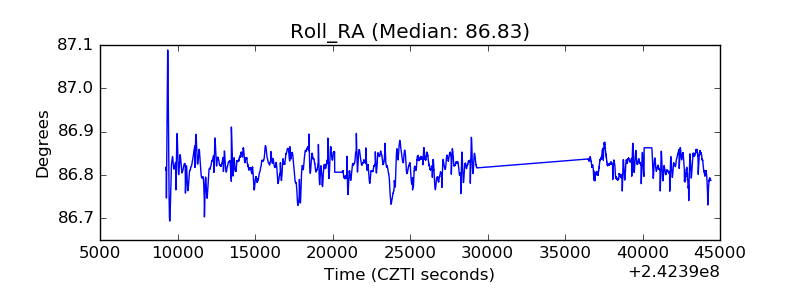 |
| Veto Counter | 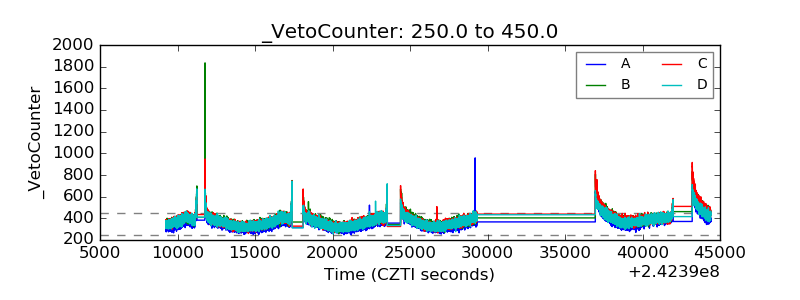 |