| Param | Original file | Final file |
|---|---|---|
| Filename | modeM0/AS1A03_127T02_9000001522_10509cztM0_level2.evt | modeM0/AS1A03_127T02_9000001522_10509cztM0_level2_quad_clean.evt |
| Size (bytes) | 465,949,440 | 120,392,640 |
| Size | 444.4 MB | 114.8 MB |
| Events in quadrant A | 2,998,936 | 795,753 |
| Events in quadrant B | 3,328,279 | 817,394 |
| Events in quadrant C | 2,882,946 | 839,531 |
| Events in quadrant D | 4,482,172 | 763,031 |
| Mode M9 | |||
|---|---|---|---|
| Quadrant | BADHDUFLAG | Total packets | Discarded packets |
| A | 0 | 13 | 0 |
| B | 0 | 13 | 0 |
| C | 0 | 13 | 0 |
| D | 0 | 13 | 0 |
| Mode M0 | |||
|---|---|---|---|
| Quadrant | BADHDUFLAG | Total packets | Discarded packets |
| A | 0 | 12930 | 6 |
| B | 0 | 13953 | 16 |
| C | 0 | 12625 | 3 |
| D | 0 | 17350 | 3 |
| Mode SS | |||
|---|---|---|---|
| Quadrant | BADHDUFLAG | Total packets | Discarded packets |
| A | 0 | 124 | 0 |
| B | 0 | 124 | 0 |
| C | 0 | 124 | 0 |
| D | 0 | 124 | 0 |
| Quadrant | Total seconds | Saturated seconds | Saturation percentage |
|---|---|---|---|
| A | 6172 | 42 | 0.680493% |
| B | 6169 | 134 | 2.172151% |
| C | 6173 | 35 | 0.566985% |
| D | 6173 | 364 | 5.896647% |
Noise dominated data is calculated using 1-second bins in cleaned event files. If a bin has >2000 counts, and if more than 50% of those come from <1% of pixels, then it is considered to be noise-dominated and hence unusable.
| Quadrant | # 1 sec bins | Bins with >0 counts | Bins with >2000 counts | High rate bins dominated by noise | Noise dominated (total time) | Noise dominated (detector-on time) | Marked lightcurve |
|---|---|---|---|---|---|---|---|
| A | 7399 | 6175 | 7 | 7 | 0.09% | 0.11% | 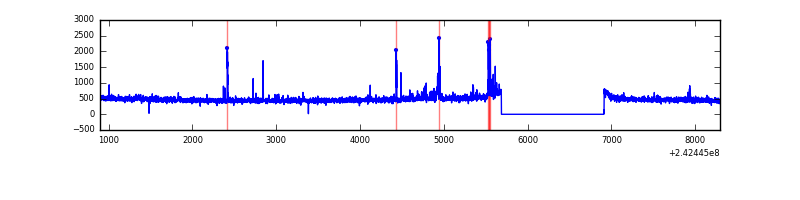 |
| B | 7399 | 6175 | 60 | 60 | 0.81% | 0.97% | 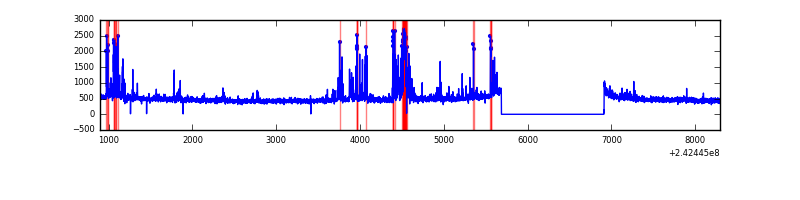 |
| C | 7399 | 6175 | 2 | 2 | 0.03% | 0.03% | 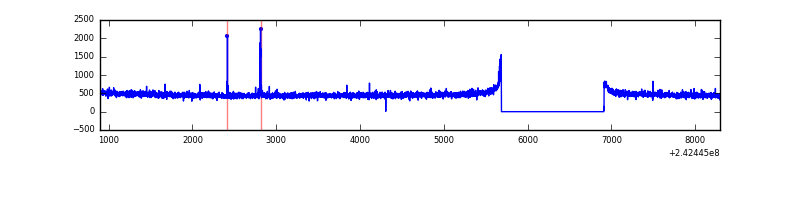 |
| D | 7399 | 6175 | 302 | 302 | 4.08% | 4.89% | 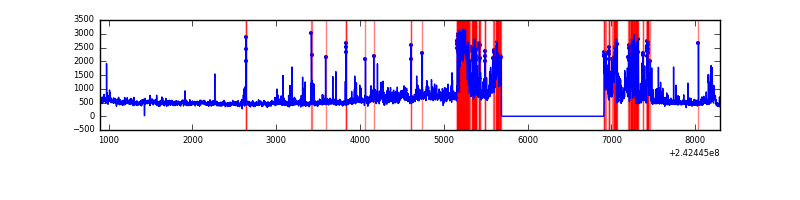 |
Top three noisy pixels from each quadrant. If the there are fewer than three noisy pixels in the level2.evt file, extra rows are filled as -1
| Pixel properties | Quadrant properties | ||||||
|---|---|---|---|---|---|---|---|
| Quadrant | DetID | PixID | Counts | Sigma | Mean | Median | Sigma |
| A | 14 | 254 | 66608 | 456.08 | 722 | 706 | 144.5 |
| A | 3 | 80 | 50762 | 346.42 | 722 | 706 | 144.5 |
| A | 13 | 251 | 45599 | 310.69 | 722 | 706 | 144.5 |
| B | 4 | 239 | 337906 | 2518.14 | 727 | 707 | 133.9 |
| B | 0 | 214 | 44392 | 326.23 | 727 | 707 | 133.9 |
| B | 11 | 51 | 41085 | 301.54 | 727 | 707 | 133.9 |
| C | 14 | 234 | 28889 | 168.64 | 730 | 734 | 167.0 |
| C | 13 | 61 | 5405 | 27.98 | 730 | 734 | 167.0 |
| C | 14 | 67 | 2902 | 12.99 | 730 | 734 | 167.0 |
| D | 1 | 52 | 1110732 | 6748.54 | 699 | 680 | 164.5 |
| D | 2 | 16 | 338205 | 2051.98 | 699 | 680 | 164.5 |
| D | 8 | 195 | 238248 | 1444.29 | 699 | 680 | 164.5 |
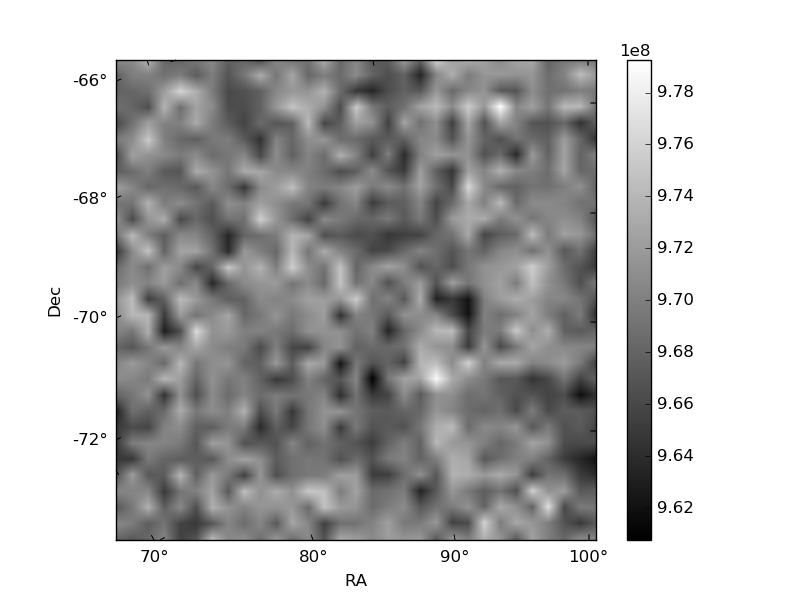
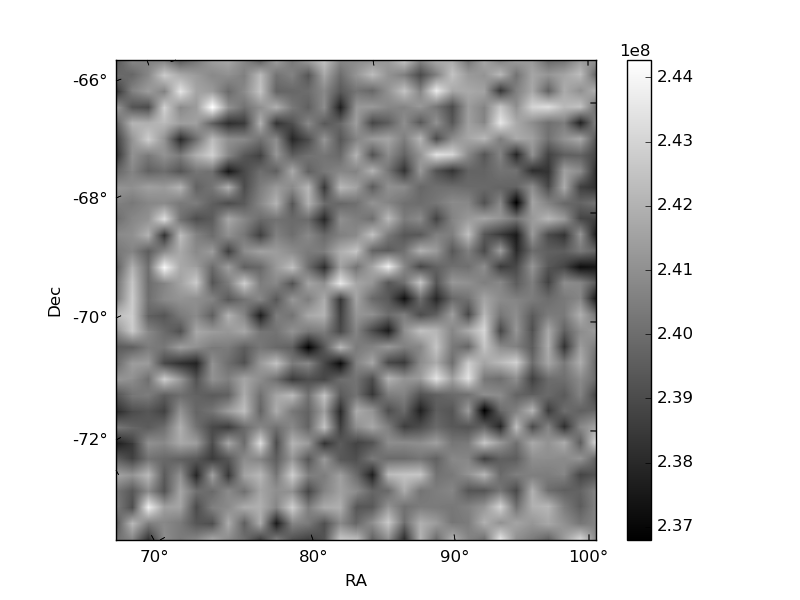
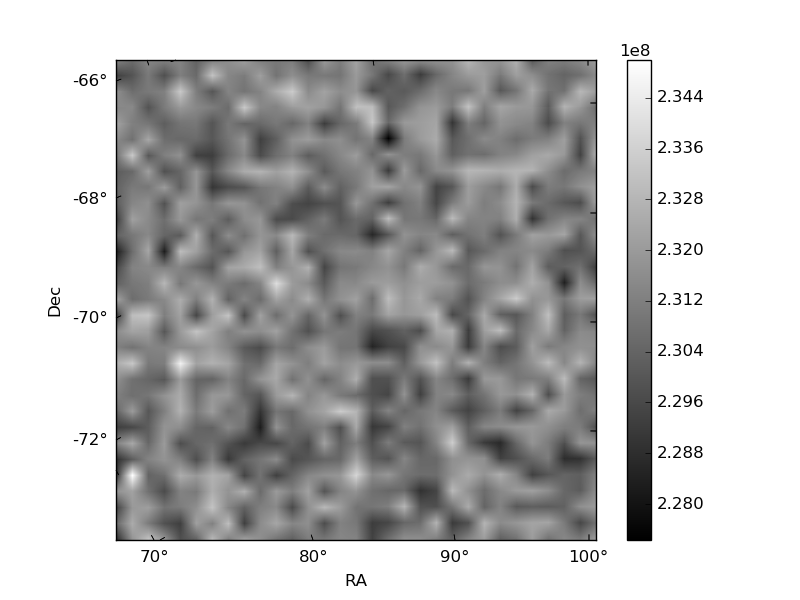
Histogram calculated using DETX and DETY for each event in the final _common_clean file
| Quadrant A | 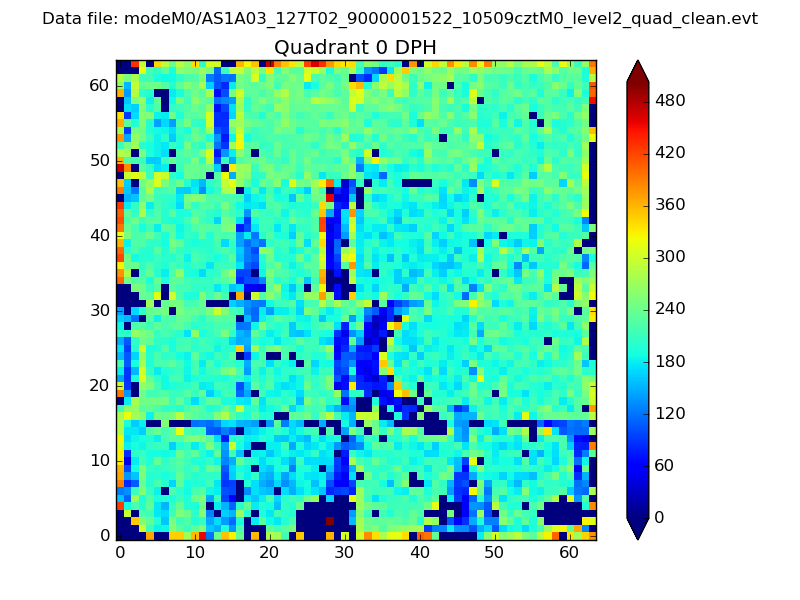 |
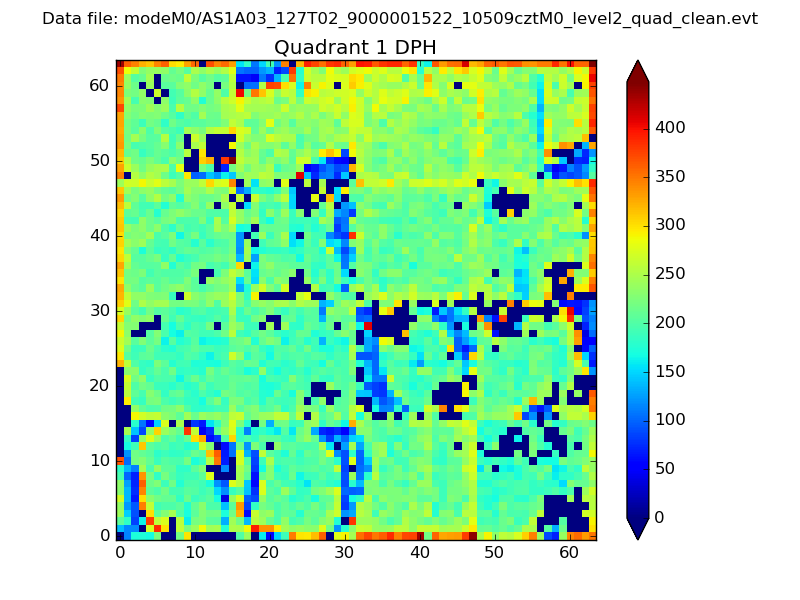 |
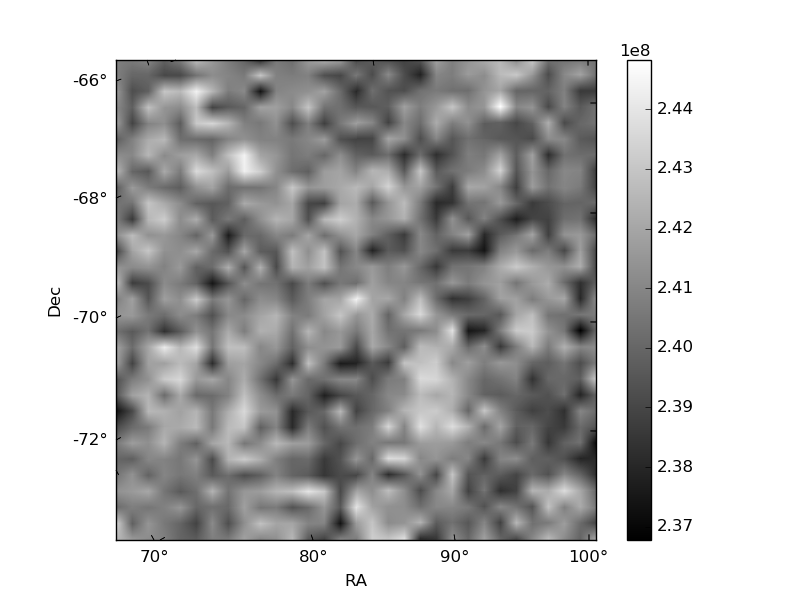
Quadrant B |
|---|---|---|---|
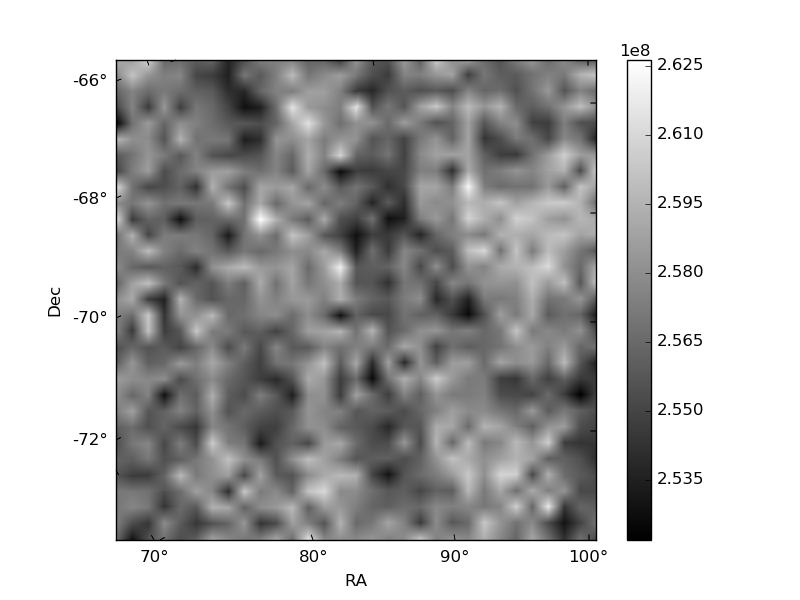
| Quadrant D | 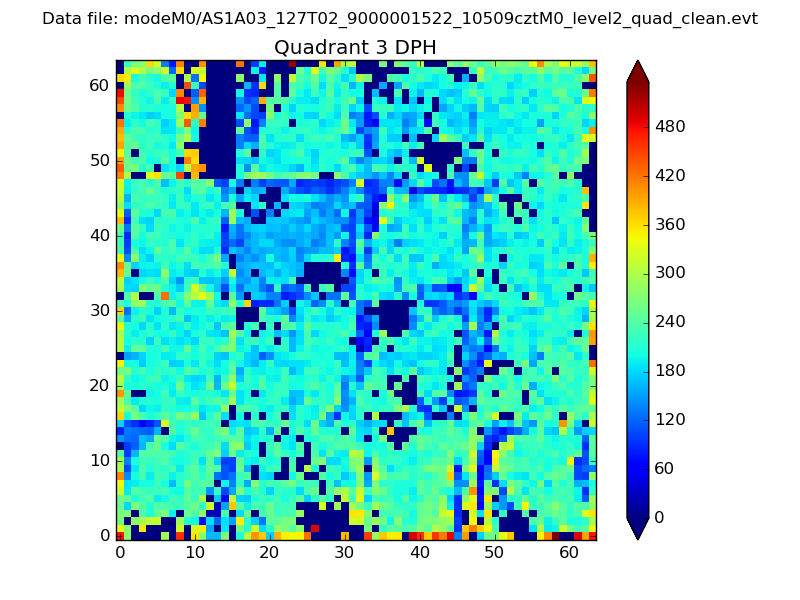 |
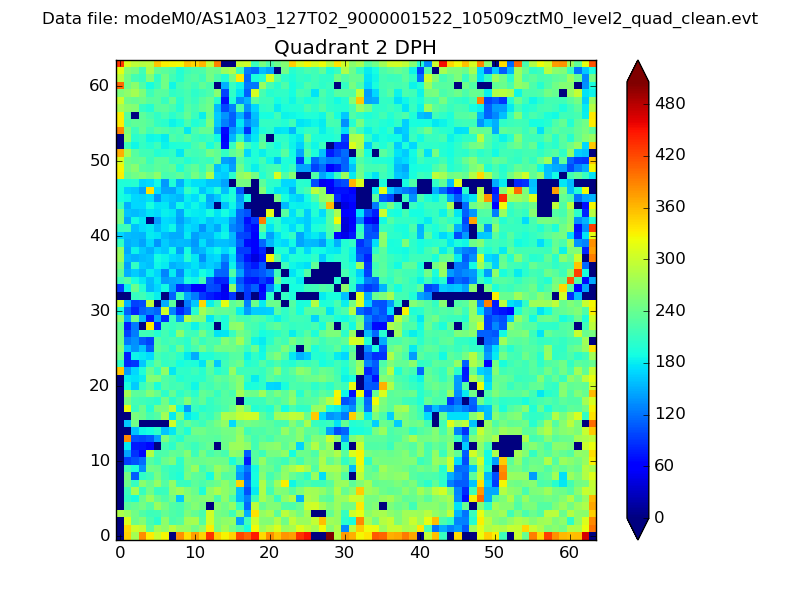 |
Quadrant C |
| Plot type | Count rate plots | Images |
|---|---|---|
| Comparison with Poisson distribution Blue bars denote a histogram of data divided into 1 sec bins. Red curve is a Poisson curve with rate = median count rate of data. |
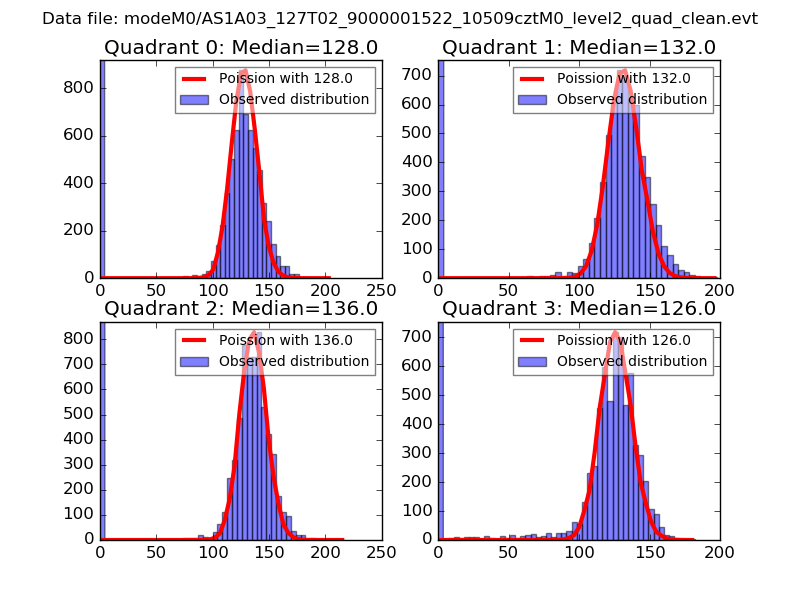 |
 |
| Quadrant-wise count rates Data is divided into 100 sec bins |
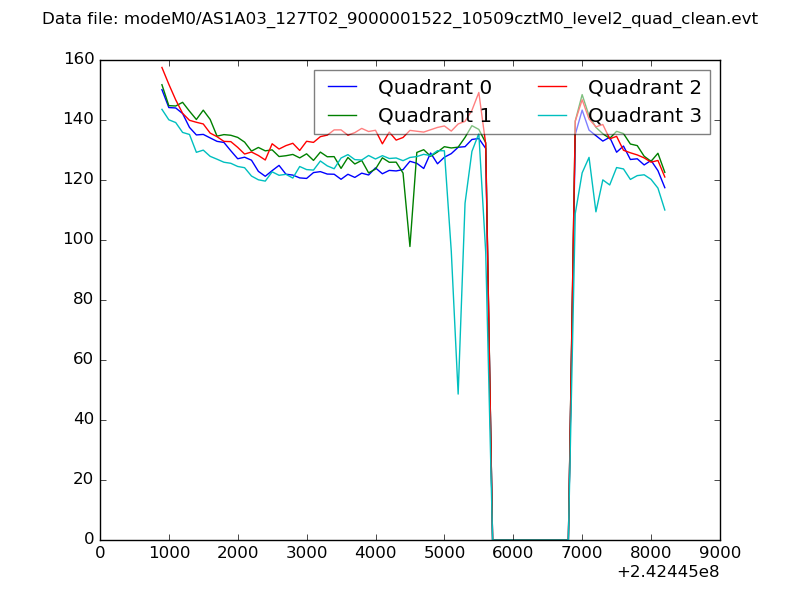 |
|
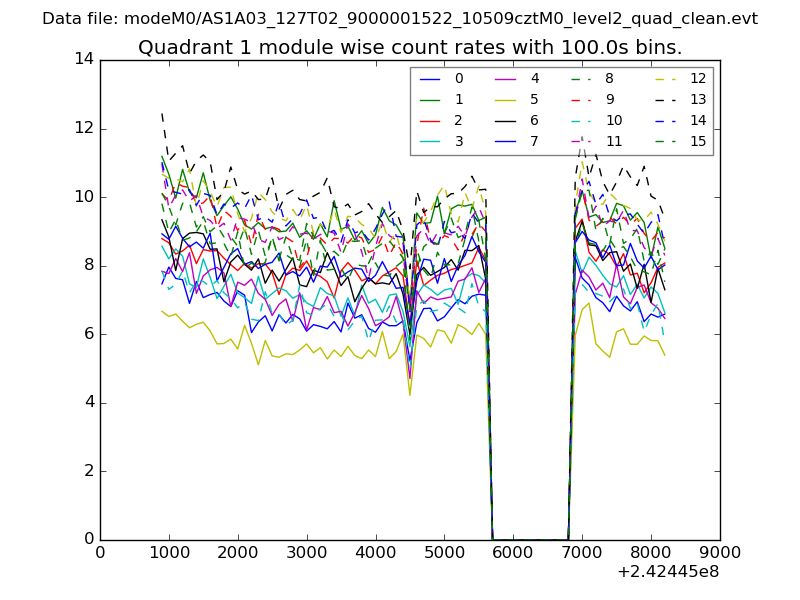
| Module-wise count rates for Quadrant A Data is divided into 100 sec bins |
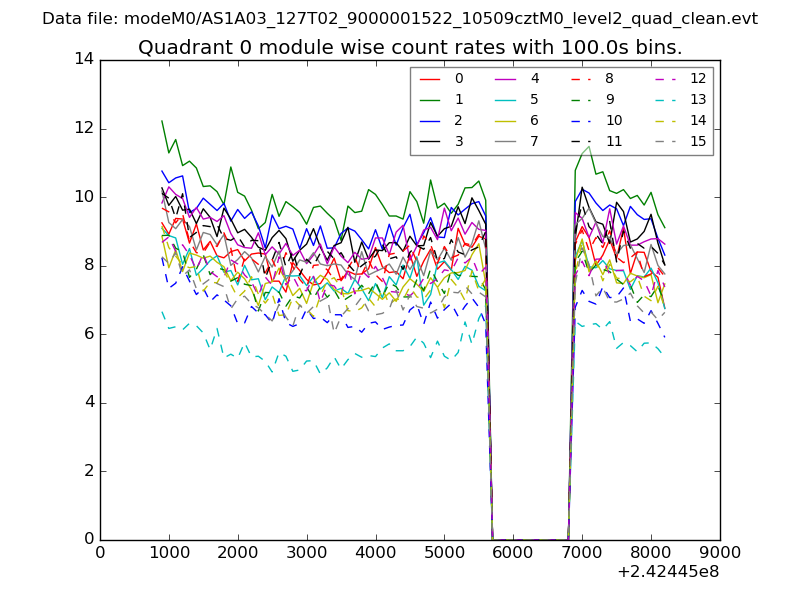 |
 |
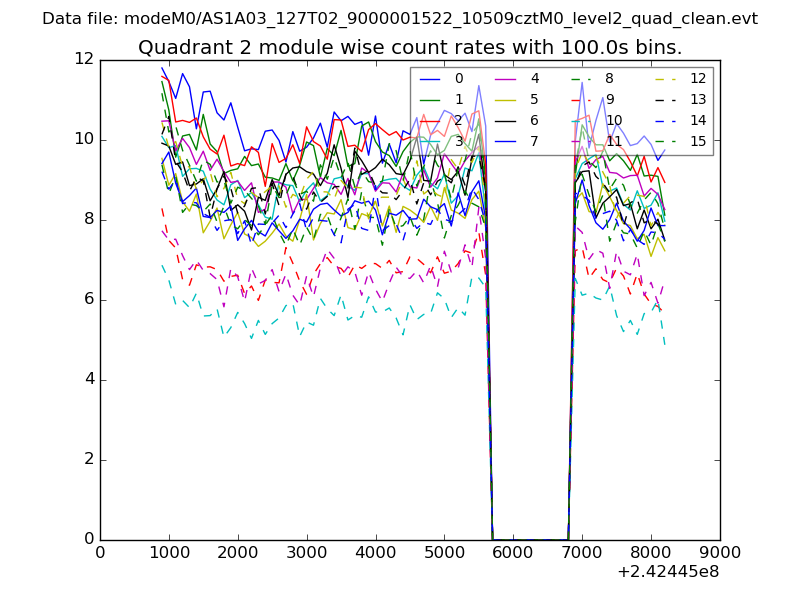
| Module-wise count rates for Quadrant B Data is divided into 100 sec bins |
 |
 |
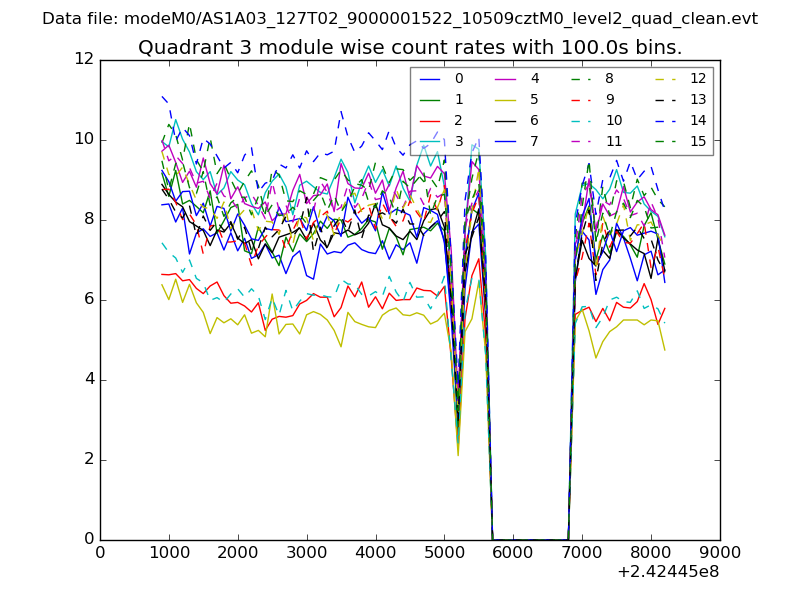
| Module-wise count rates for Quadrant C Data is divided into 100 sec bins |
 |
 |
| Module-wise count rates for Quadrant D Data is divided into 100 sec bins |
 |
 |
| Parameter | Plot |
|---|---|
| CZT HV Monitor | 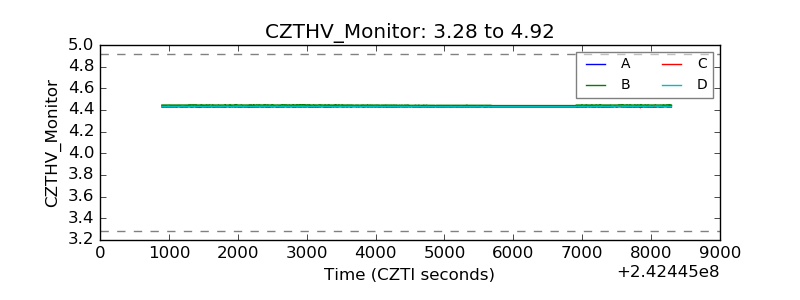 |
| D_VDD | 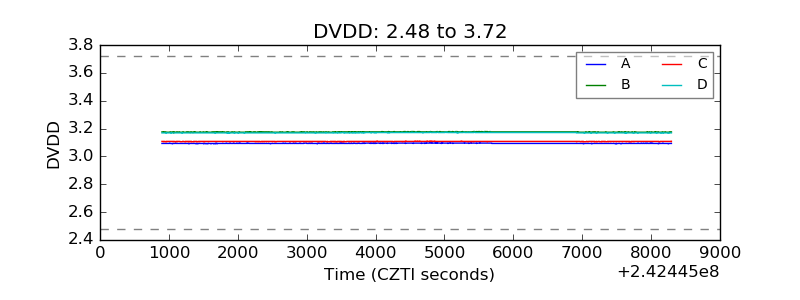 |
| Temperature 1 | 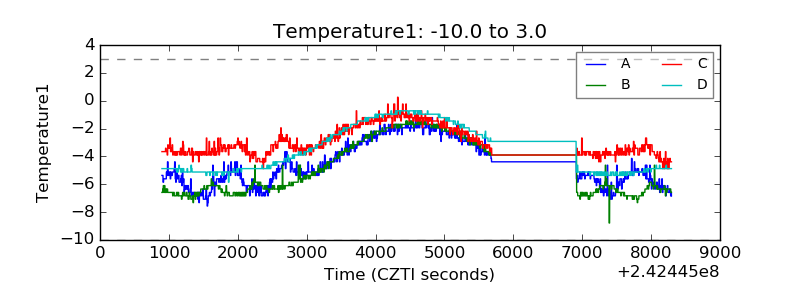 |
| Veto HV Monitor | 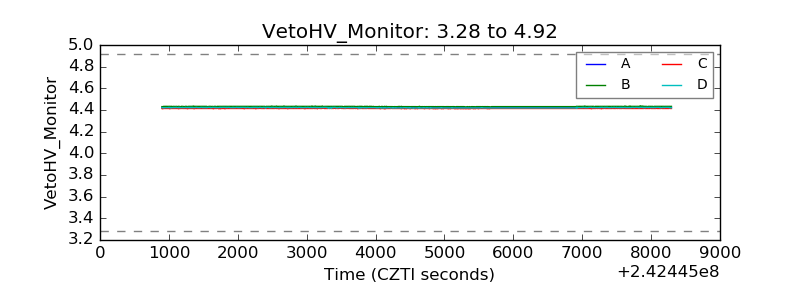 |
| Veto LLD | 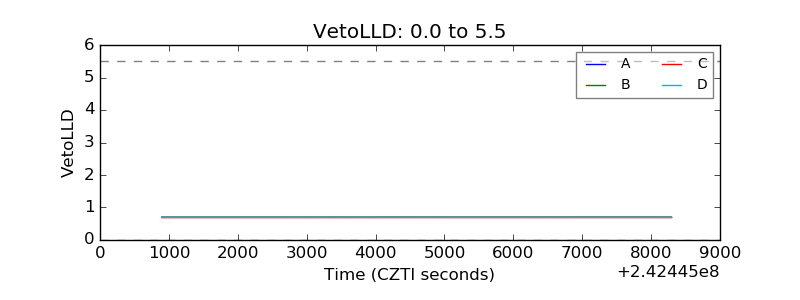 |
| Alpha Counter |  |
| _CPM_Rate | 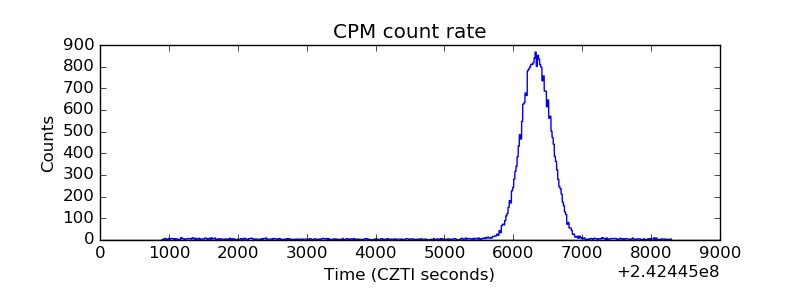 |
| CZT Counter | 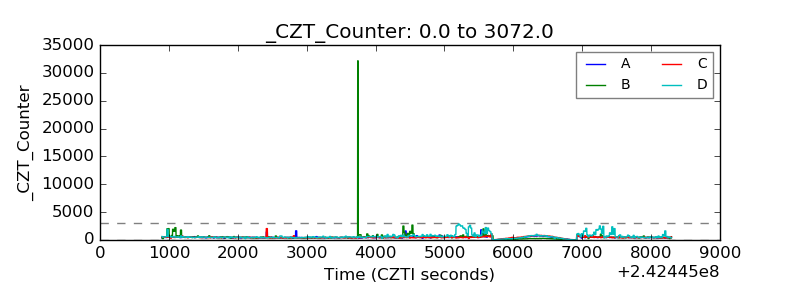 |
| +2.5 Volts monitor |  |
| +5 Volts monitor | 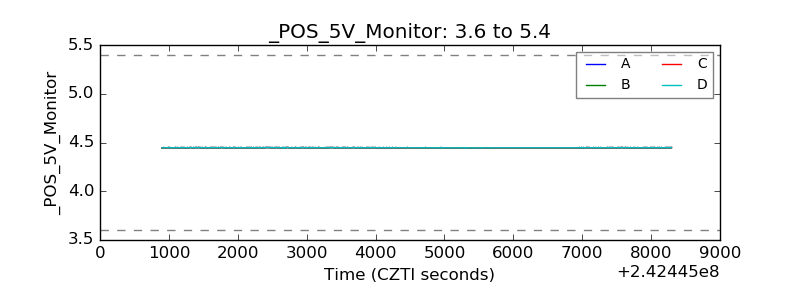 |
| _ROLL_ROT | 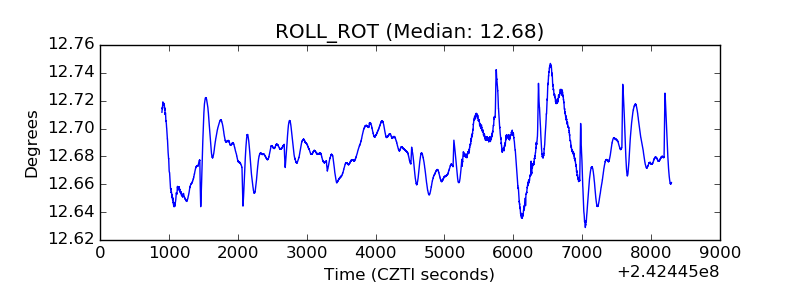 |
| _Roll_DEC | 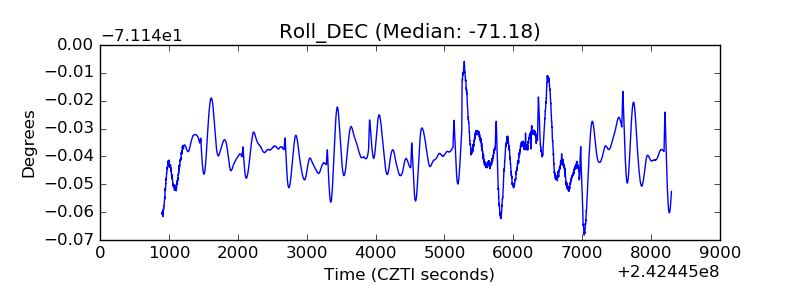 |
| _Roll_RA | 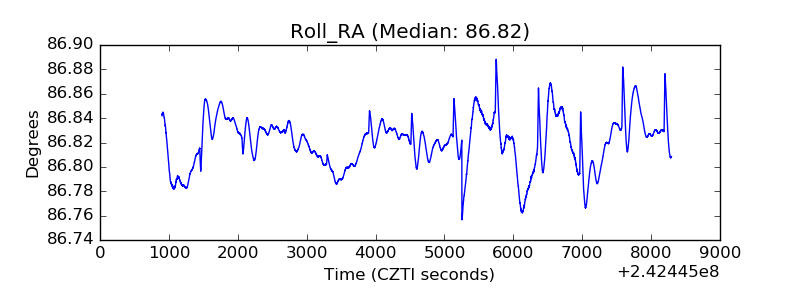 |
| Veto Counter | 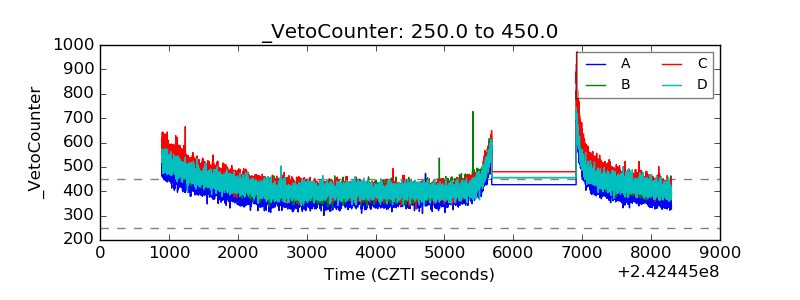 |