| Param | Original file | Final file |
|---|---|---|
| Filename | modeM0/AS1A03_127T02_9000001522_10510cztM0_level2.evt | modeM0/AS1A03_127T02_9000001522_10510cztM0_level2_quad_clean.evt |
| Size (bytes) | 675,973,440 | 174,945,600 |
| Size | 644.7 MB | 166.8 MB |
| Events in quadrant A | 4,421,862 | 1,127,392 |
| Events in quadrant B | 4,639,783 | 1,147,650 |
| Events in quadrant C | 4,222,428 | 1,218,825 |
| Events in quadrant D | 6,562,187 | 1,165,205 |
| Mode M9 | |||
|---|---|---|---|
| Quadrant | BADHDUFLAG | Total packets | Discarded packets |
| A | 0 | 30 | 7 |
| B | 0 | 33 | 10 |
| C | 0 | 33 | 10 |
| D | 0 | 32 | 9 |
| Mode M0 | |||
|---|---|---|---|
| Quadrant | BADHDUFLAG | Total packets | Discarded packets |
| A | 0 | 35076 | 16033 |
| B | 0 | 38542 | 18761 |
| C | 0 | 34229 | 15396 |
| D | 0 | 45295 | 19510 |
| Mode SS | |||
|---|---|---|---|
| Quadrant | BADHDUFLAG | Total packets | Discarded packets |
| A | 0 | 338 | 139 |
| B | 0 | 338 | 140 |
| C | 0 | 338 | 139 |
| D | 0 | 329 | 130 |
| Quadrant | Total seconds | Saturated seconds | Saturation percentage |
|---|---|---|---|
| A | 9057 | 65 | 0.717677% |
| B | 8967 | 149 | 1.661648% |
| C | 9212 | 49 | 0.531915% |
| D | 9561 | 388 | 4.058153% |
Noise dominated data is calculated using 1-second bins in cleaned event files. If a bin has >2000 counts, and if more than 50% of those come from <1% of pixels, then it is considered to be noise-dominated and hence unusable.
| Quadrant | # 1 sec bins | Bins with >0 counts | Bins with >2000 counts | High rate bins dominated by noise | Noise dominated (total time) | Noise dominated (detector-on time) | Marked lightcurve |
|---|---|---|---|---|---|---|---|
| A | 12500 | 9974 | 8 | 8 | 0.06% | 0.08% | 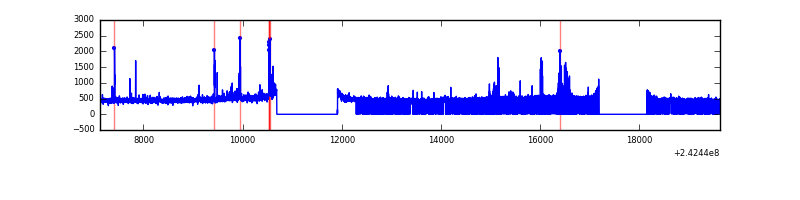 |
| B | 12500 | 9869 | 51 | 51 | 0.41% | 0.52% | 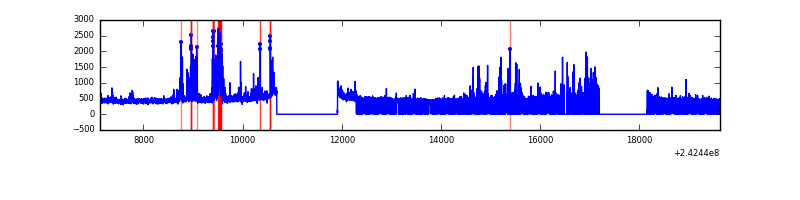 |
| C | 12499 | 10108 | 2 | 2 | 0.02% | 0.02% | 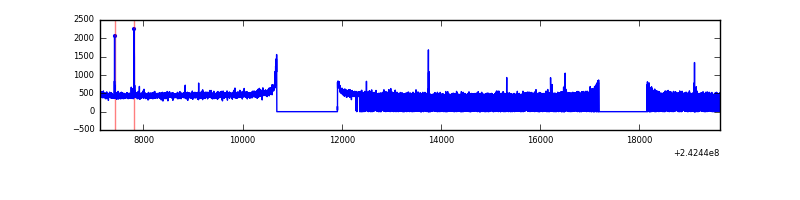 |
| D | 12500 | 10001 | 290 | 290 | 2.32% | 2.90% | 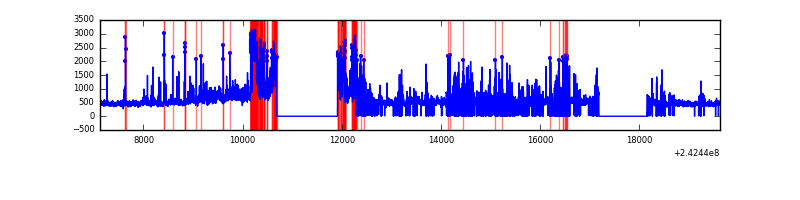 |
Top three noisy pixels from each quadrant. If the there are fewer than three noisy pixels in the level2.evt file, extra rows are filled as -1
| Pixel properties | Quadrant properties | ||||||
|---|---|---|---|---|---|---|---|
| Quadrant | DetID | PixID | Counts | Sigma | Mean | Median | Sigma |
| A | 5 | 16 | 101138 | 475.82 | 1045 | 1020 | 210.4 |
| A | 14 | 254 | 84181 | 395.23 | 1045 | 1020 | 210.4 |
| A | 3 | 80 | 81642 | 383.16 | 1045 | 1020 | 210.4 |
| B | 4 | 239 | 366068 | 1908.55 | 1036 | 1009 | 191.3 |
| B | 11 | 51 | 92617 | 478.93 | 1036 | 1009 | 191.3 |
| B | 0 | 214 | 54663 | 280.51 | 1036 | 1009 | 191.3 |
| C | 14 | 234 | 43316 | 173.31 | 1070 | 1071 | 243.7 |
| C | 13 | 61 | 7963 | 28.27 | 1070 | 1071 | 243.7 |
| C | 14 | 67 | 3977 | 11.92 | 1070 | 1071 | 243.7 |
| D | 1 | 52 | 1371142 | 5409.12 | 1077 | 1047 | 253.3 |
| D | 2 | 16 | 441878 | 1740.4 | 1077 | 1047 | 253.3 |
| D | 8 | 195 | 357661 | 1407.91 | 1077 | 1047 | 253.3 |
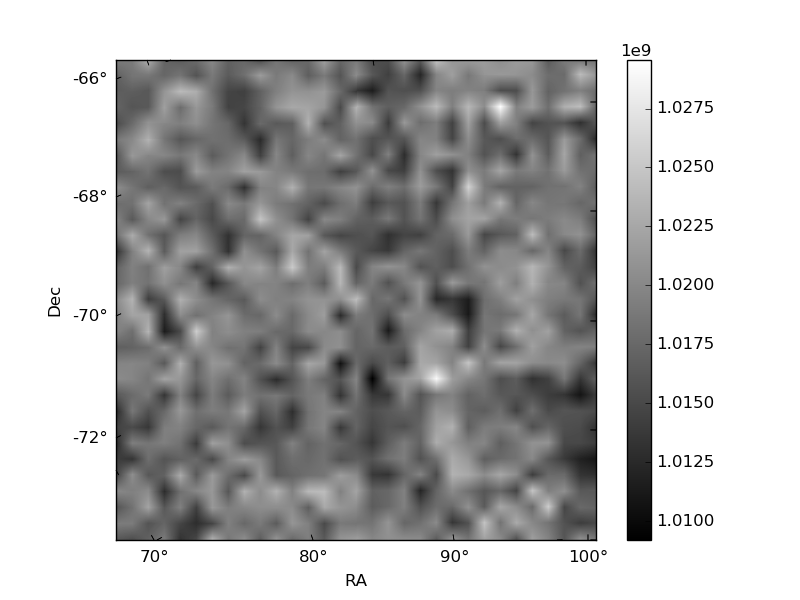
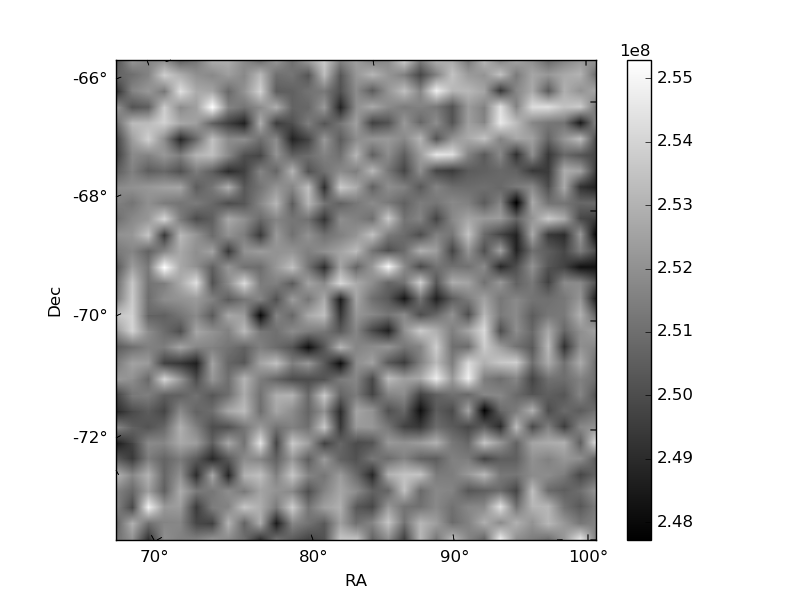
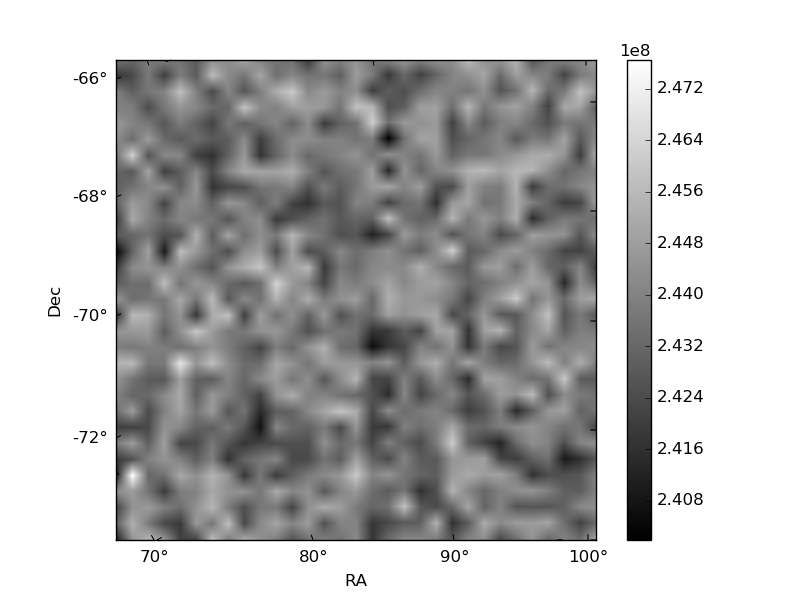
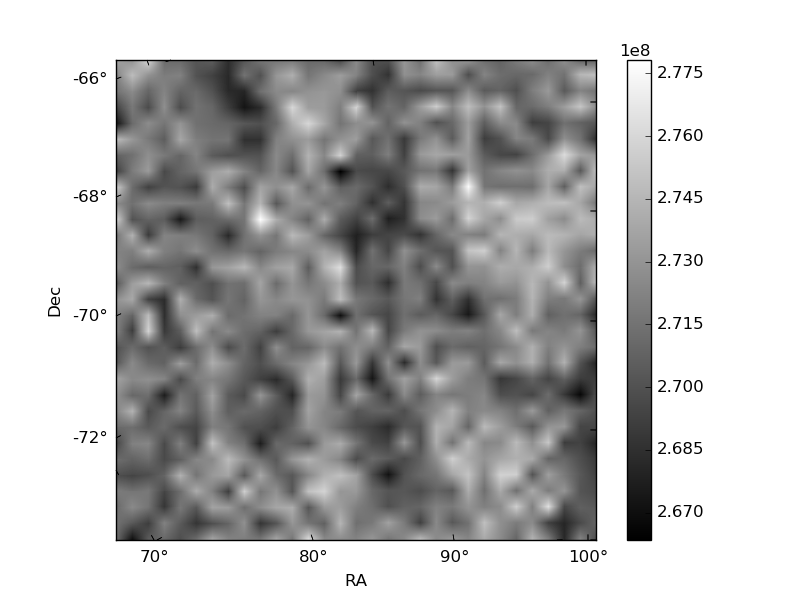
Histogram calculated using DETX and DETY for each event in the final _common_clean file
| Quadrant A | 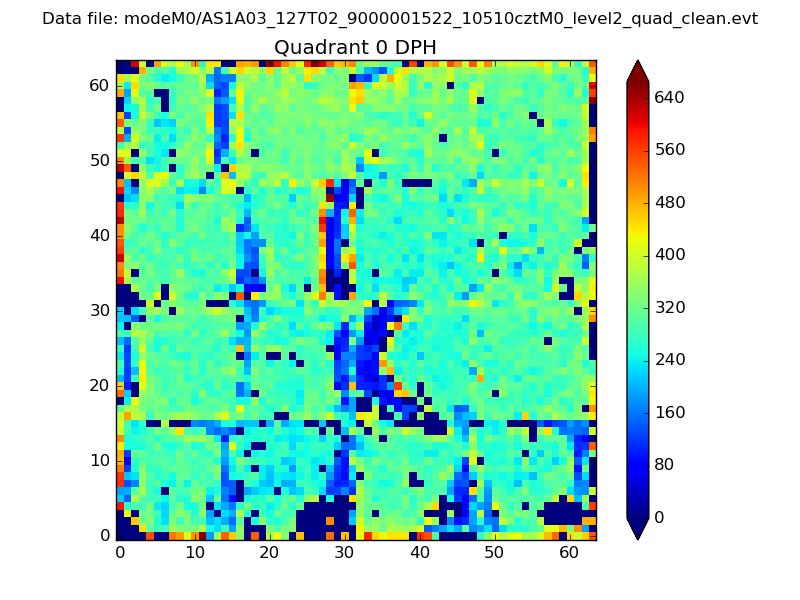 |
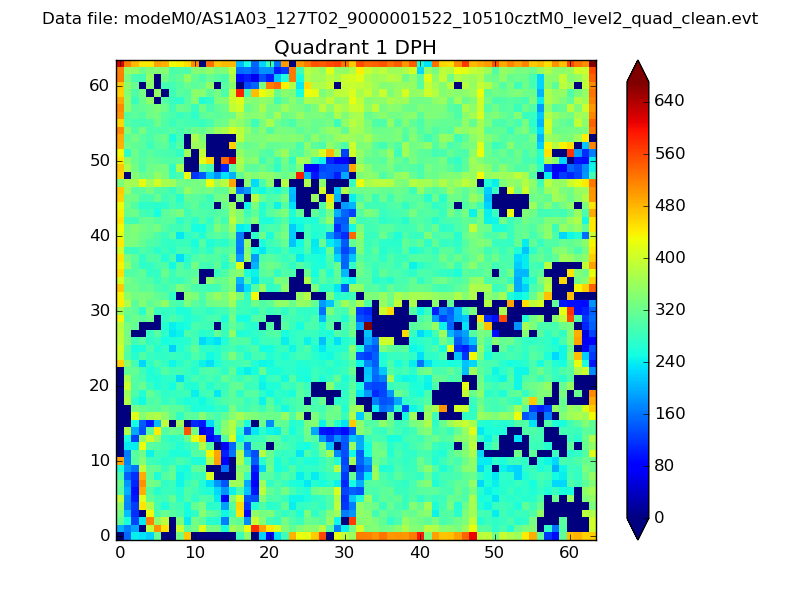 |
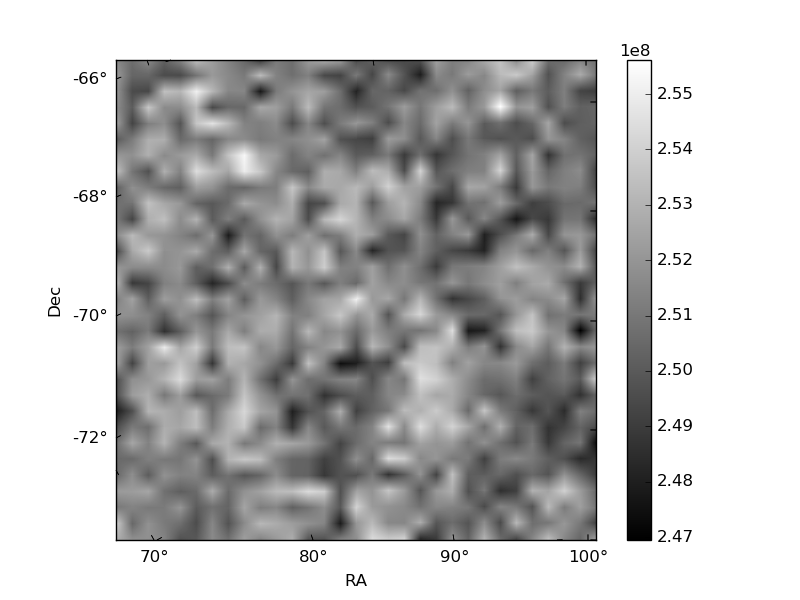
Quadrant B |
|---|---|---|---|
| Quadrant D | 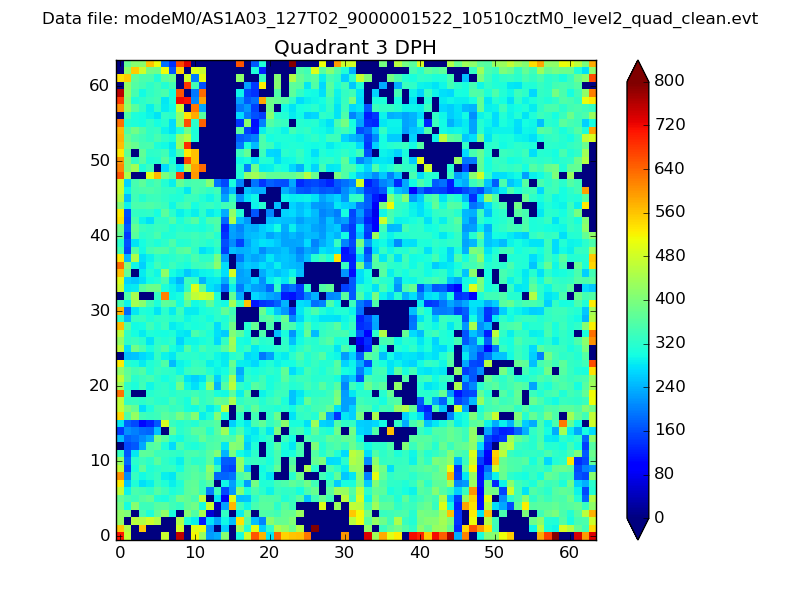 |
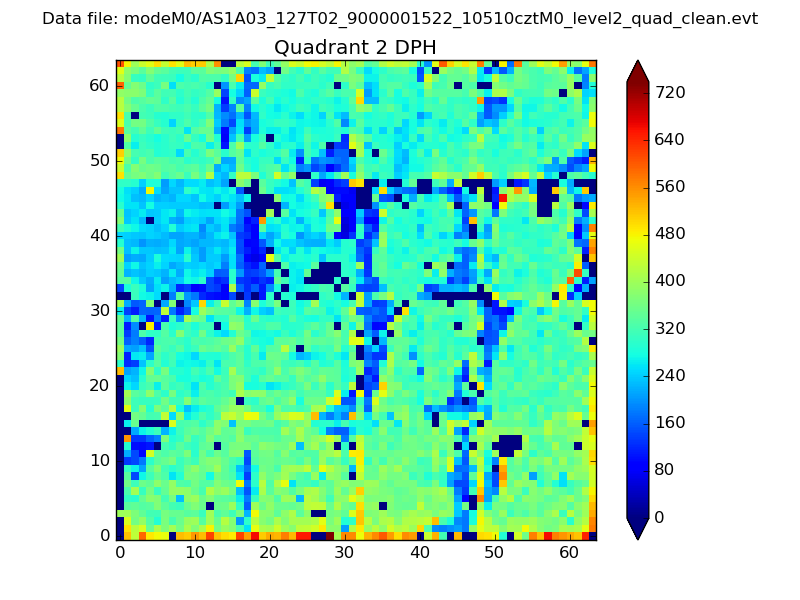 |
Quadrant C |
| Plot type | Count rate plots | Images |
|---|---|---|
| Comparison with Poisson distribution Blue bars denote a histogram of data divided into 1 sec bins. Red curve is a Poisson curve with rate = median count rate of data. |
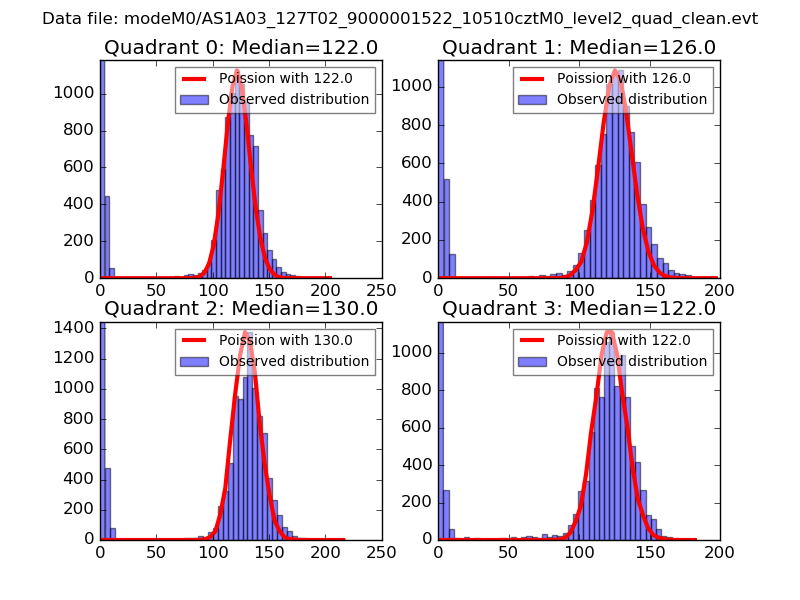 |
 |
| Quadrant-wise count rates Data is divided into 100 sec bins |
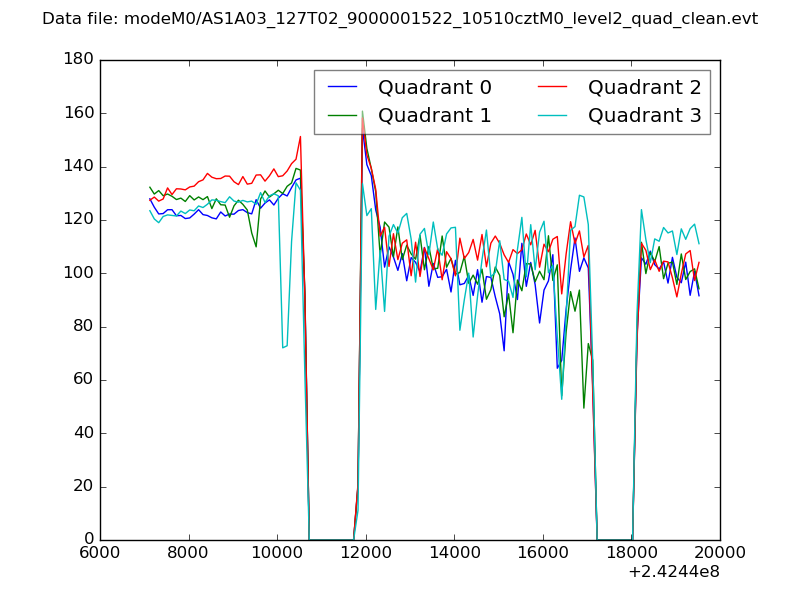 |
|
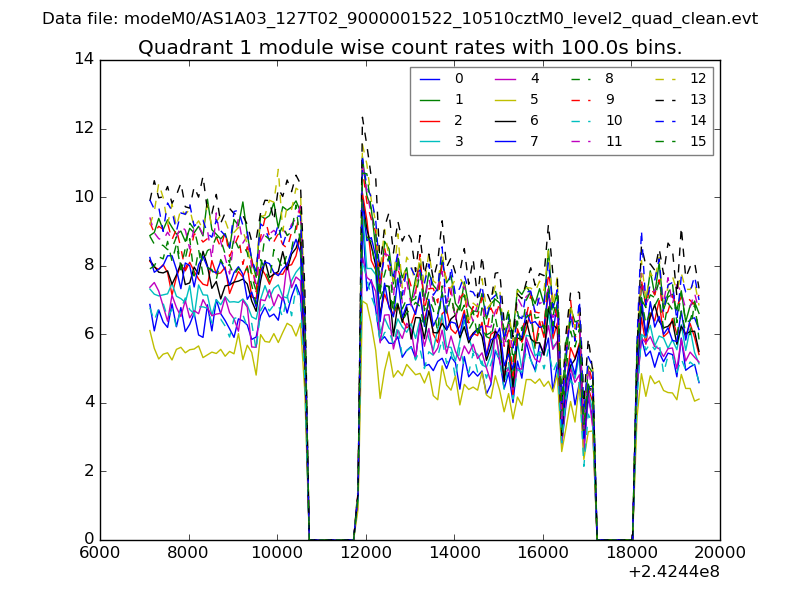
| Module-wise count rates for Quadrant A Data is divided into 100 sec bins |
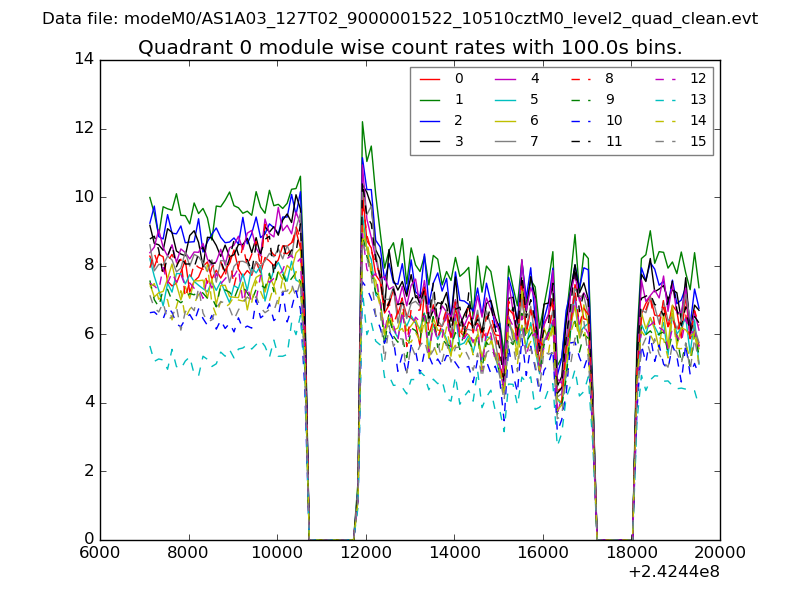 |
 |
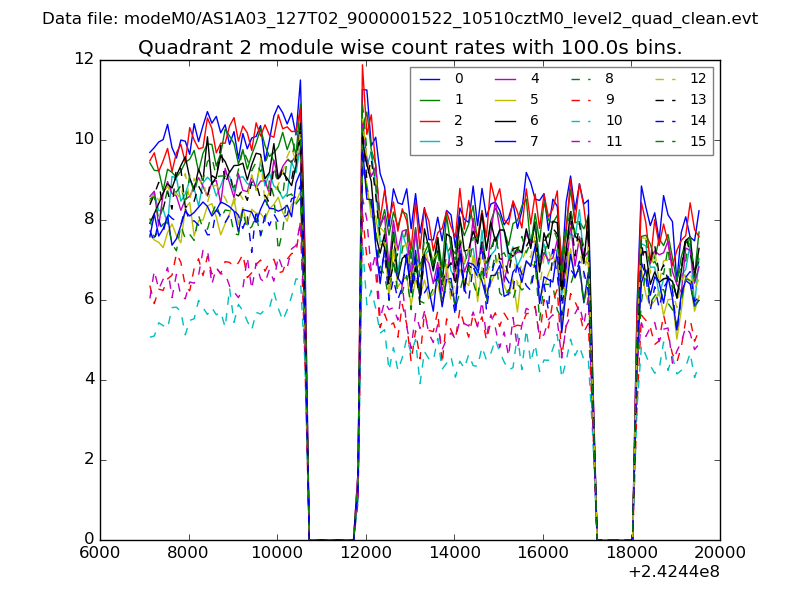
| Module-wise count rates for Quadrant B Data is divided into 100 sec bins |
 |
 |
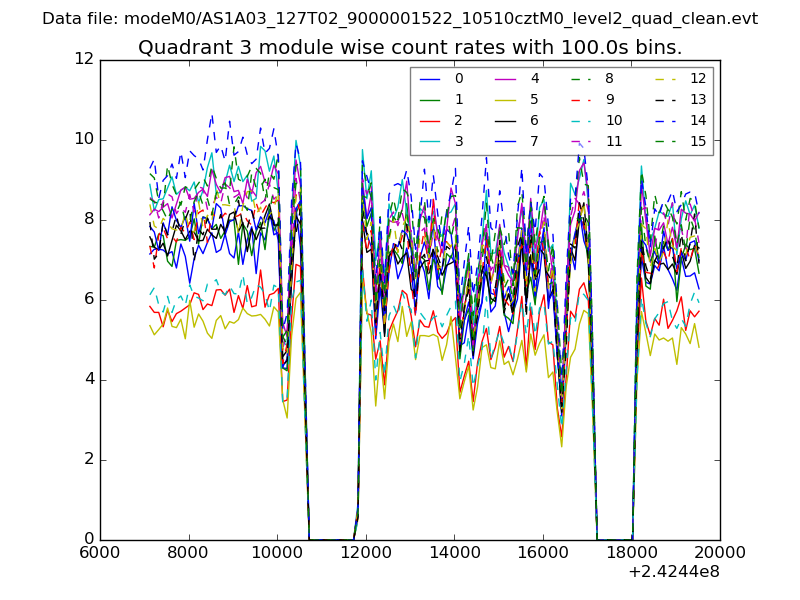
| Module-wise count rates for Quadrant C Data is divided into 100 sec bins |
 |
 |
| Module-wise count rates for Quadrant D Data is divided into 100 sec bins |
 |
 |
| Parameter | Plot |
|---|---|
| CZT HV Monitor | 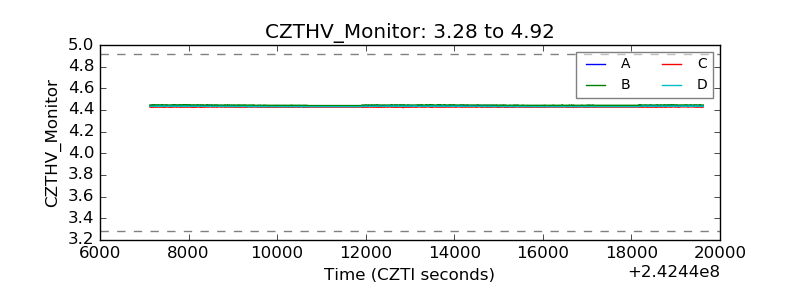 |
| D_VDD | 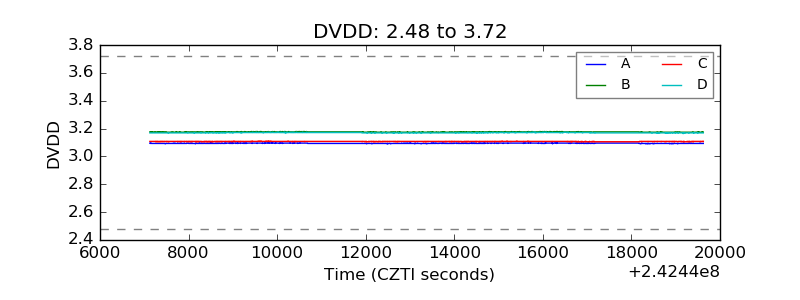 |
| Temperature 1 | 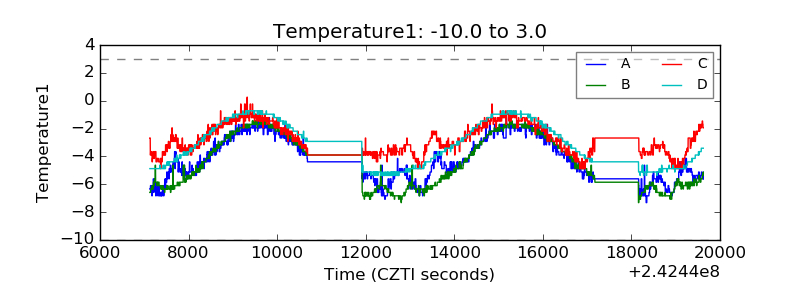 |
| Veto HV Monitor | 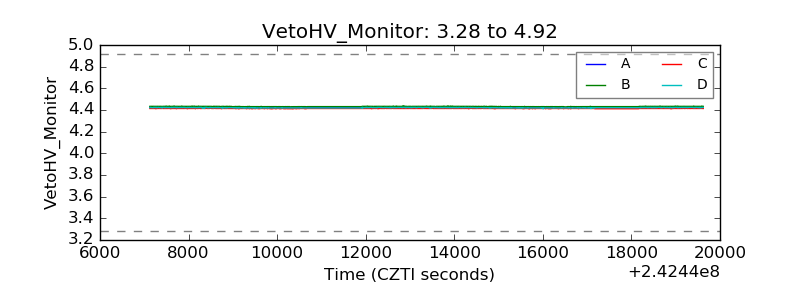 |
| Veto LLD | 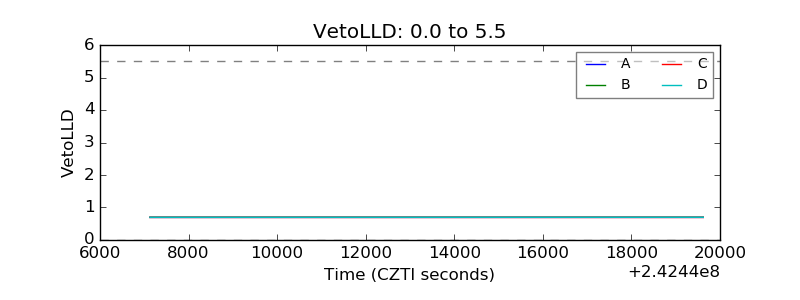 |
| Alpha Counter | 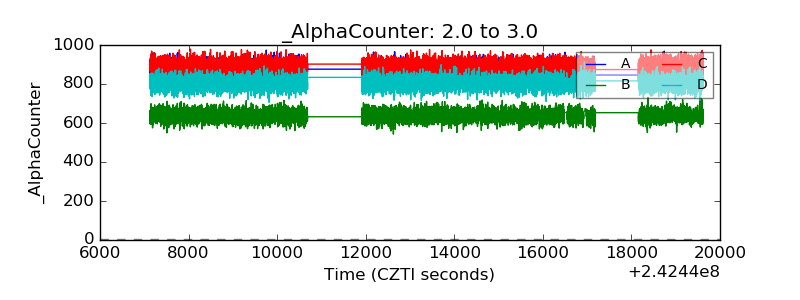 |
| _CPM_Rate | 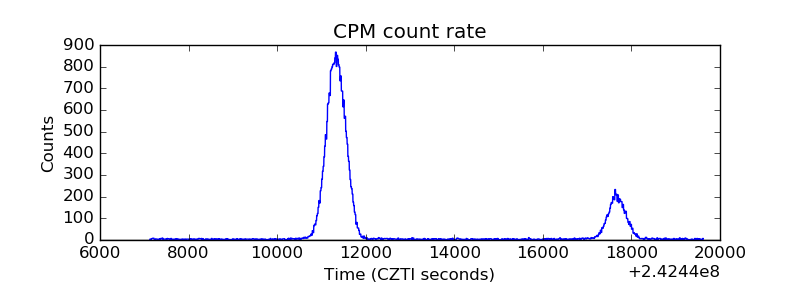 |
| CZT Counter | 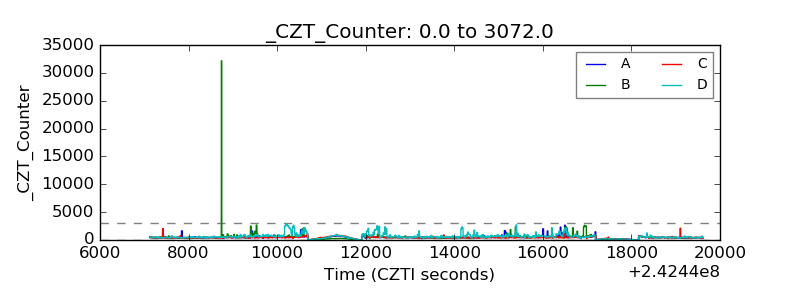 |
| +2.5 Volts monitor |  |
| +5 Volts monitor |  |
| _ROLL_ROT |  |
| _Roll_DEC |  |
| _Roll_RA | 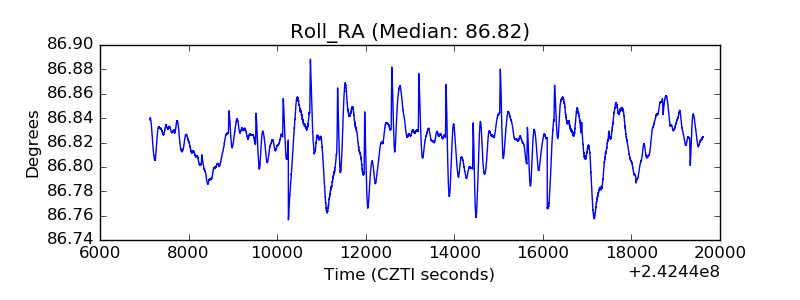 |
| Veto Counter | 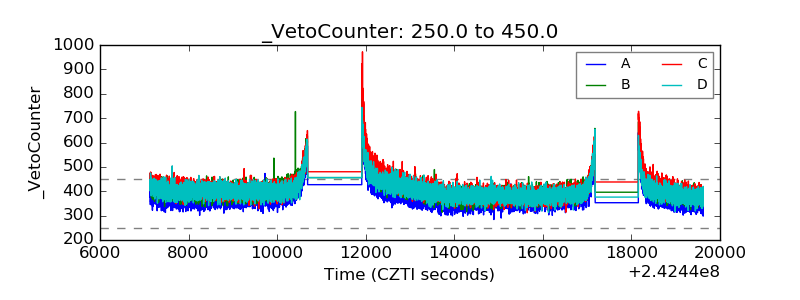 |