| Param | Original file | Final file |
|---|---|---|
| Filename | modeM0/AS1A03_127T02_9000001522_10511cztM0_level2.evt | modeM0/AS1A03_127T02_9000001522_10511cztM0_level2_quad_clean.evt |
| Size (bytes) | 349,554,240 | 92,851,200 |
| Size | 333.4 MB | 88.5 MB |
| Events in quadrant A | 2,279,374 | 604,623 |
| Events in quadrant B | 2,910,331 | 612,411 |
| Events in quadrant C | 2,294,648 | 640,440 |
| Events in quadrant D | 2,757,116 | 599,813 |
| Mode M9 | |||
|---|---|---|---|
| Quadrant | BADHDUFLAG | Total packets | Discarded packets |
| A | 0 | 6 | 0 |
| B | 0 | 7 | 1 |
| C | 0 | 6 | 0 |
| D | 0 | 7 | 1 |
| Mode M0 | |||
|---|---|---|---|
| Quadrant | BADHDUFLAG | Total packets | Discarded packets |
| A | 0 | 11207 | 882 |
| B | 0 | 13665 | 1545 |
| C | 0 | 11250 | 841 |
| D | 0 | 12423 | 1043 |
| Mode SS | |||
|---|---|---|---|
| Quadrant | BADHDUFLAG | Total packets | Discarded packets |
| A | 0 | 112 | 10 |
| B | 0 | 111 | 9 |
| C | 0 | 111 | 9 |
| D | 0 | 113 | 11 |
| Quadrant | Total seconds | Saturated seconds | Saturation percentage |
|---|---|---|---|
| A | 5066 | 76 | 1.500197% |
| B | 5064 | 236 | 4.660348% |
| C | 5076 | 61 | 1.201734% |
| D | 5046 | 109 | 2.160127% |
Noise dominated data is calculated using 1-second bins in cleaned event files. If a bin has >2000 counts, and if more than 50% of those come from <1% of pixels, then it is considered to be noise-dominated and hence unusable.
| Quadrant | # 1 sec bins | Bins with >0 counts | Bins with >2000 counts | High rate bins dominated by noise | Noise dominated (total time) | Noise dominated (detector-on time) | Marked lightcurve |
|---|---|---|---|---|---|---|---|
| A | 7203 | 5116 | 0 | 0 | 0.00% | 0.00% | 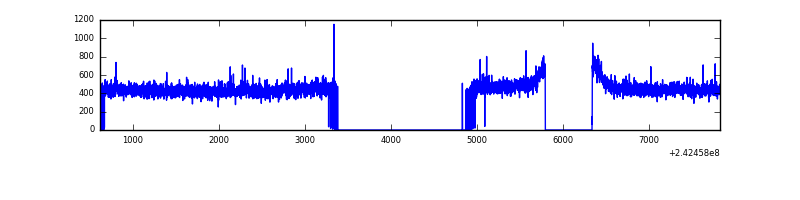 |
| B | 7198 | 5109 | 110 | 110 | 1.53% | 2.15% | 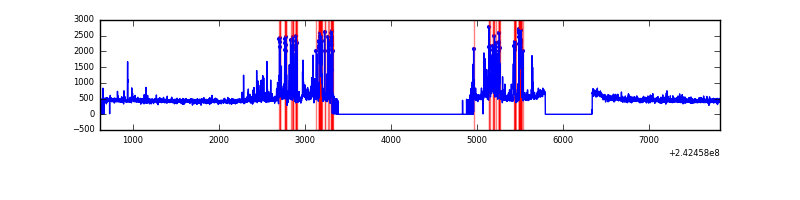 |
| C | 7196 | 5116 | 5 | 5 | 0.07% | 0.10% | 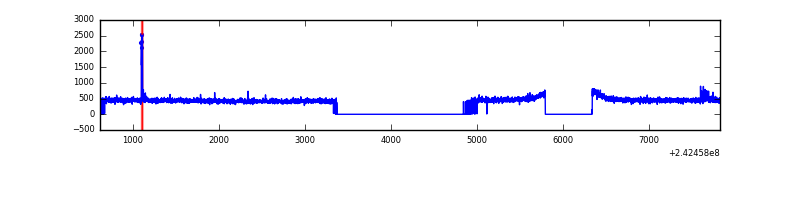 |
| D | 7194 | 5086 | 42 | 42 | 0.58% | 0.83% | 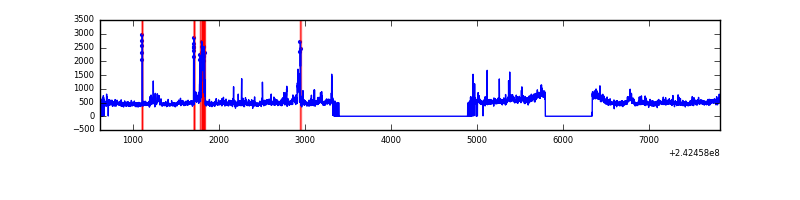 |
Top three noisy pixels from each quadrant. If the there are fewer than three noisy pixels in the level2.evt file, extra rows are filled as -1
| Pixel properties | Quadrant properties | ||||||
|---|---|---|---|---|---|---|---|
| Quadrant | DetID | PixID | Counts | Sigma | Mean | Median | Sigma |
| A | 3 | 80 | 35825 | 302.37 | 572 | 559 | 116.6 |
| A | 15 | 239 | 26120 | 219.16 | 572 | 559 | 116.6 |
| A | 14 | 254 | 6941 | 54.72 | 572 | 559 | 116.6 |
| B | 4 | 239 | 559965 | 5140.54 | 568 | 553 | 108.8 |
| B | 11 | 51 | 54623 | 496.86 | 568 | 553 | 108.8 |
| B | 0 | 214 | 44056 | 399.76 | 568 | 553 | 108.8 |
| C | 14 | 234 | 31974 | 234.32 | 579 | 581 | 134.0 |
| C | 13 | 61 | 4393 | 28.45 | 579 | 581 | 134.0 |
| C | 14 | 238 | 1941 | 10.15 | 579 | 581 | 134.0 |
| D | 1 | 52 | 231417 | 1707.54 | 568 | 551 | 135.2 |
| D | 1 | 20 | 151031 | 1112.98 | 568 | 551 | 135.2 |
| D | 8 | 195 | 131174 | 966.12 | 568 | 551 | 135.2 |
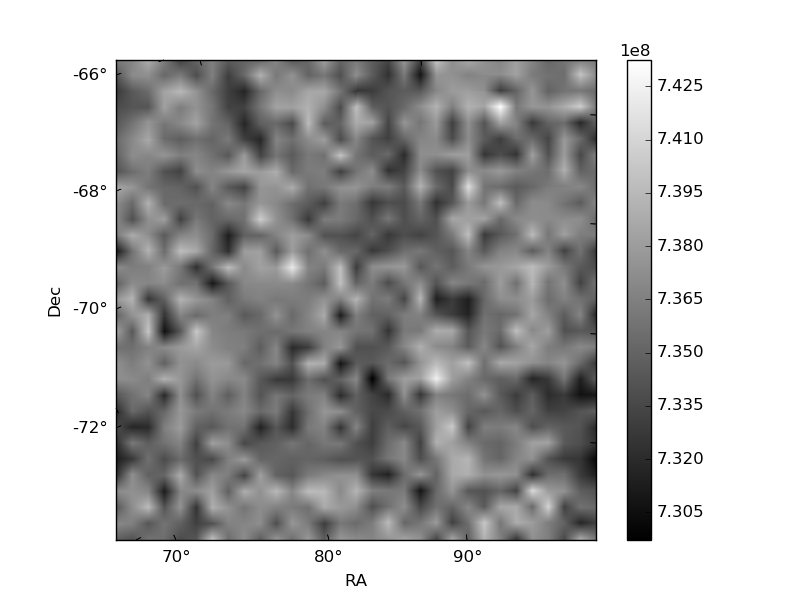
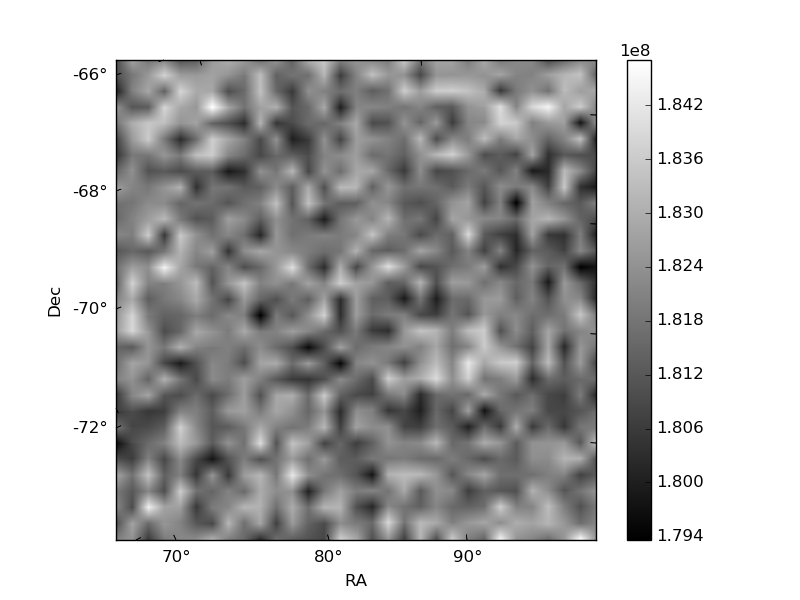
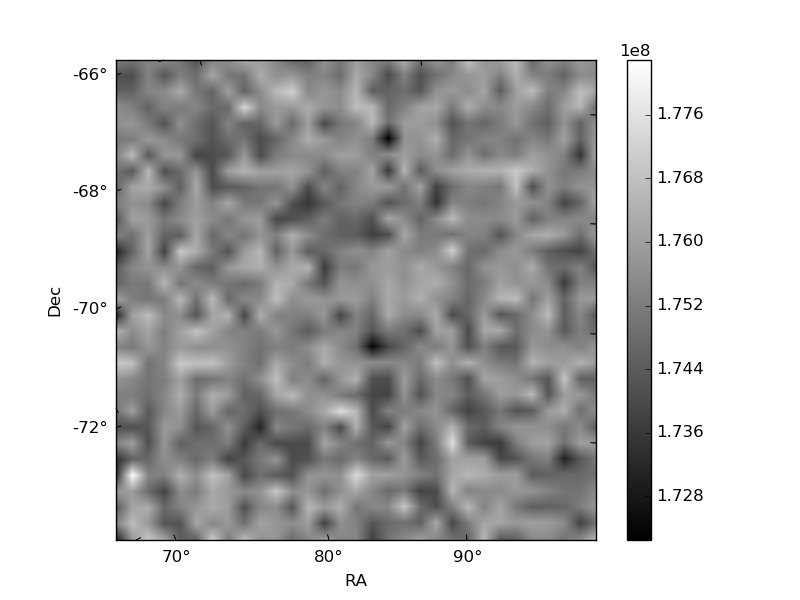
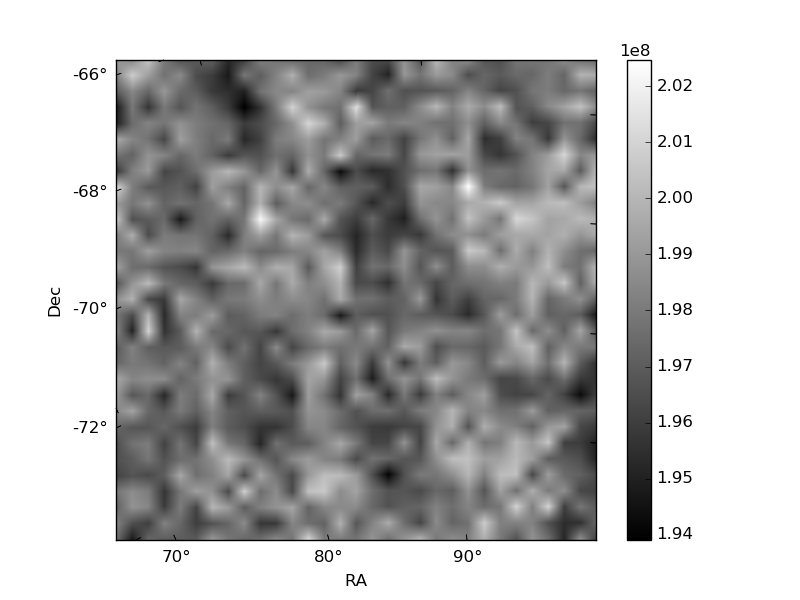
Histogram calculated using DETX and DETY for each event in the final _common_clean file
| Quadrant A | 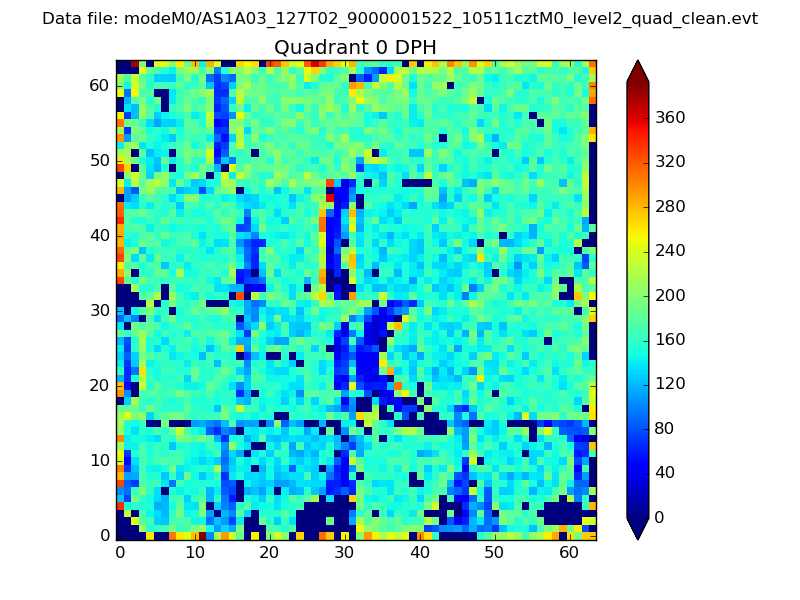 |
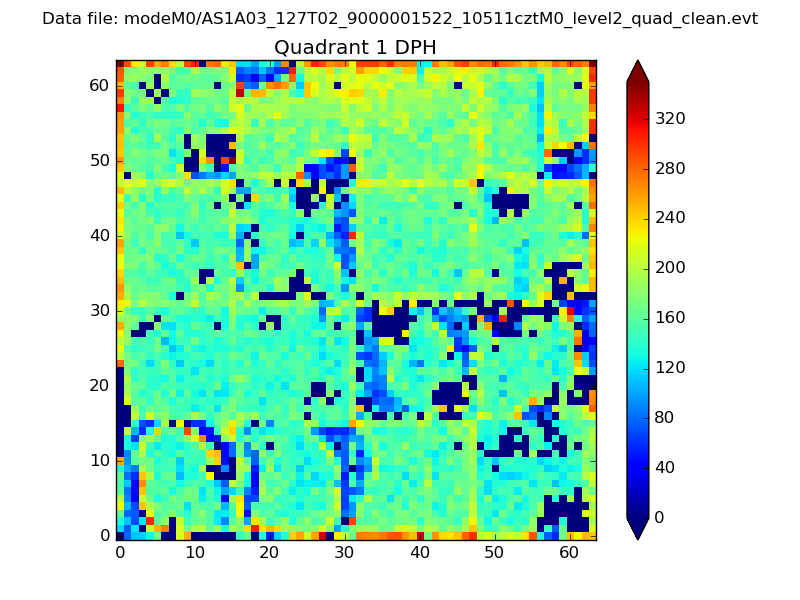 |
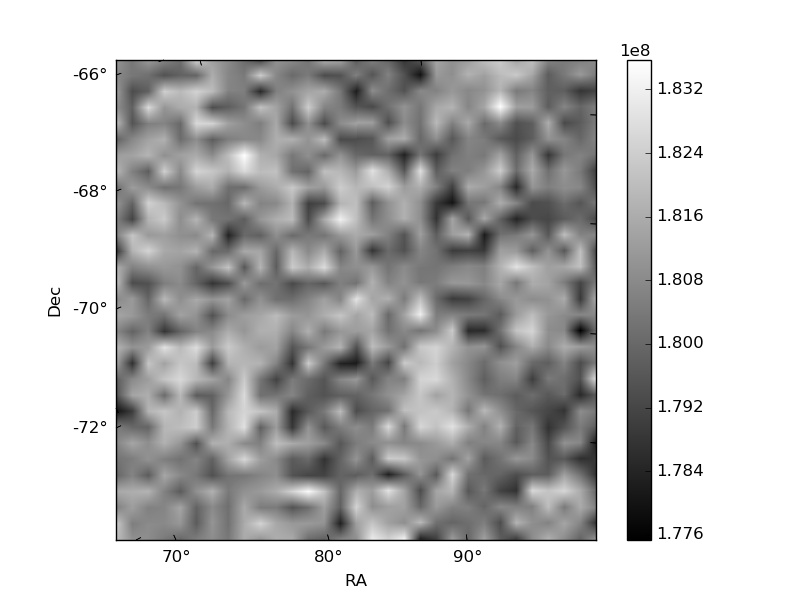
Quadrant B |
|---|---|---|---|
| Quadrant D | 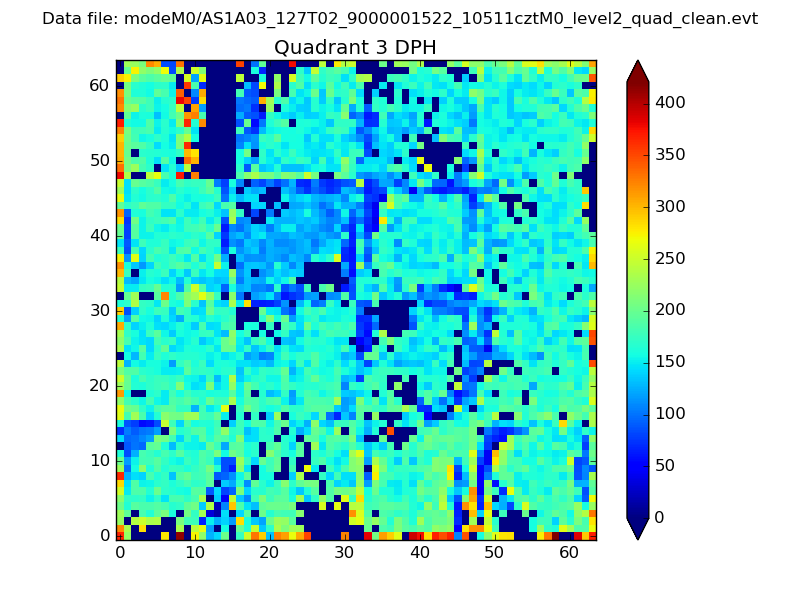 |
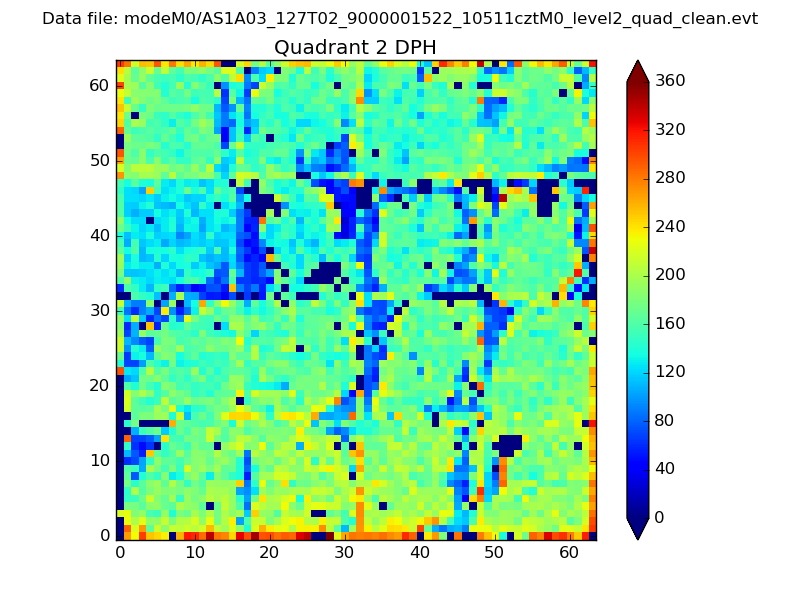 |
Quadrant C |
| Plot type | Count rate plots | Images |
|---|---|---|
| Comparison with Poisson distribution Blue bars denote a histogram of data divided into 1 sec bins. Red curve is a Poisson curve with rate = median count rate of data. |
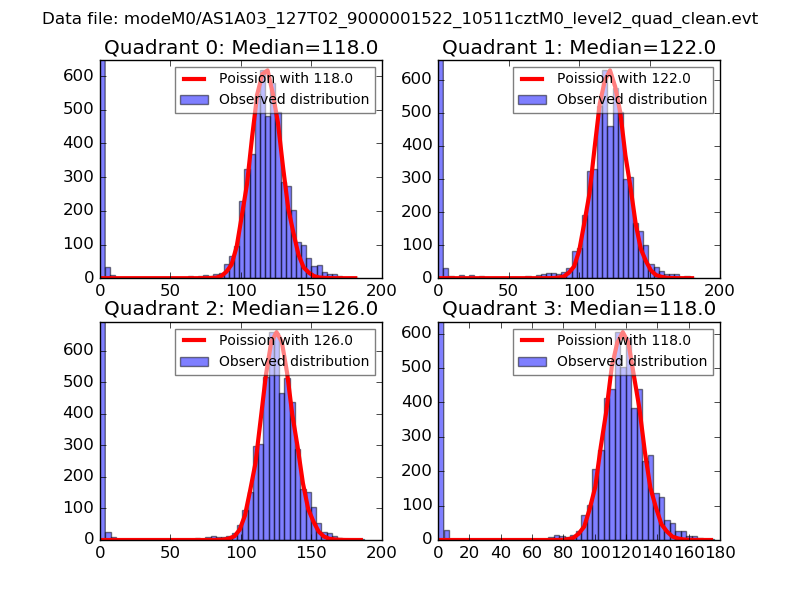 |
 |
| Quadrant-wise count rates Data is divided into 100 sec bins |
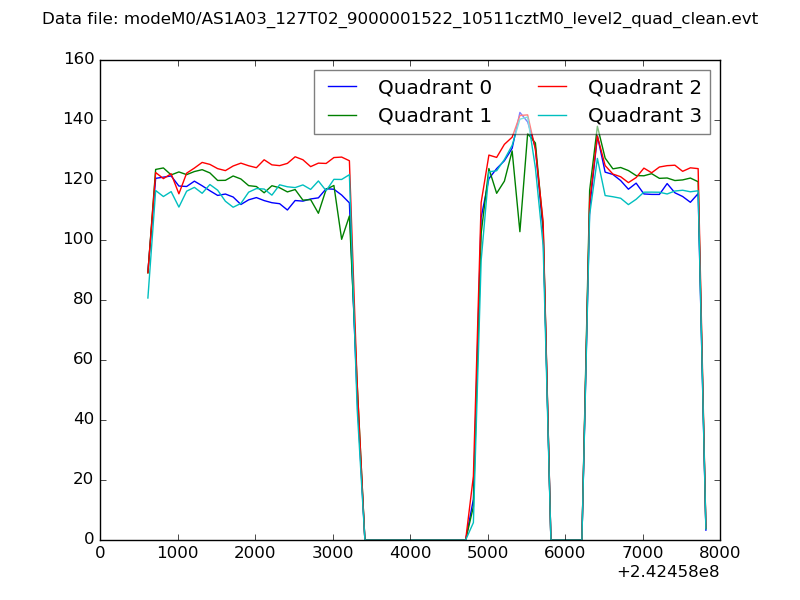 |
|
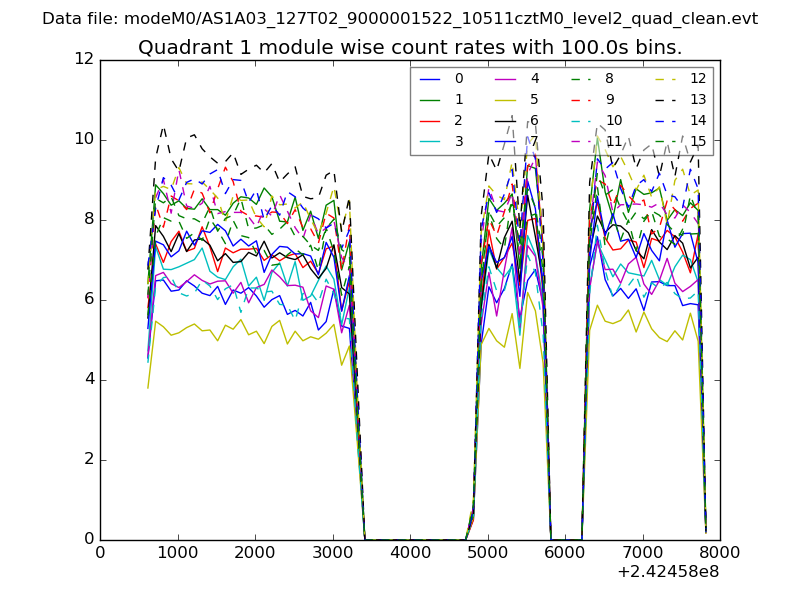
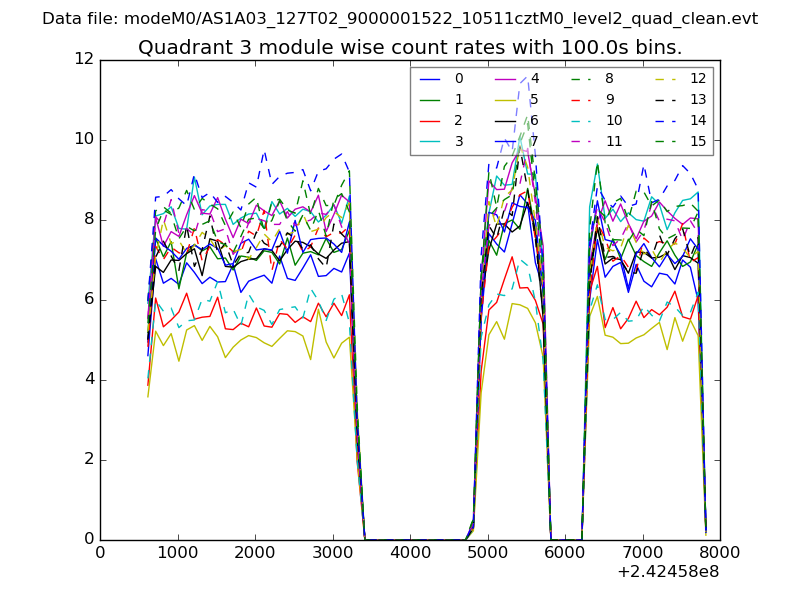
| Module-wise count rates for Quadrant A Data is divided into 100 sec bins |
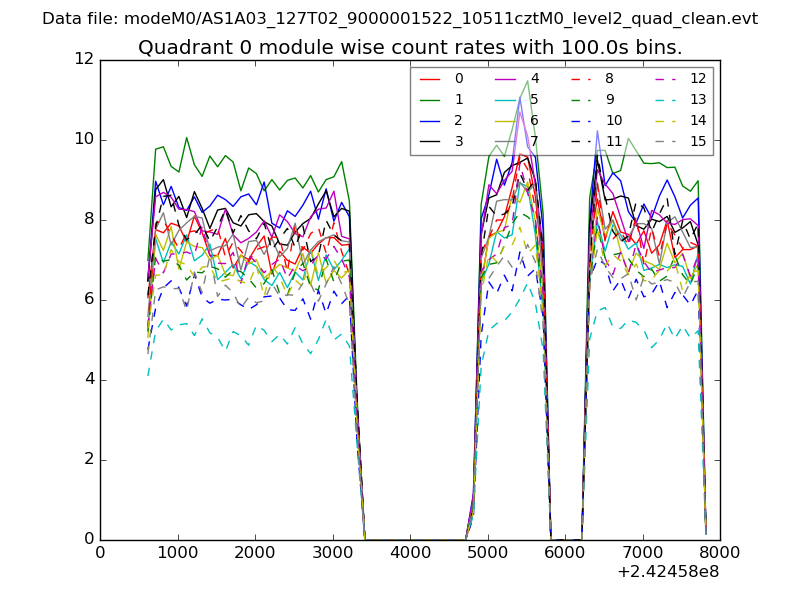 |
 |
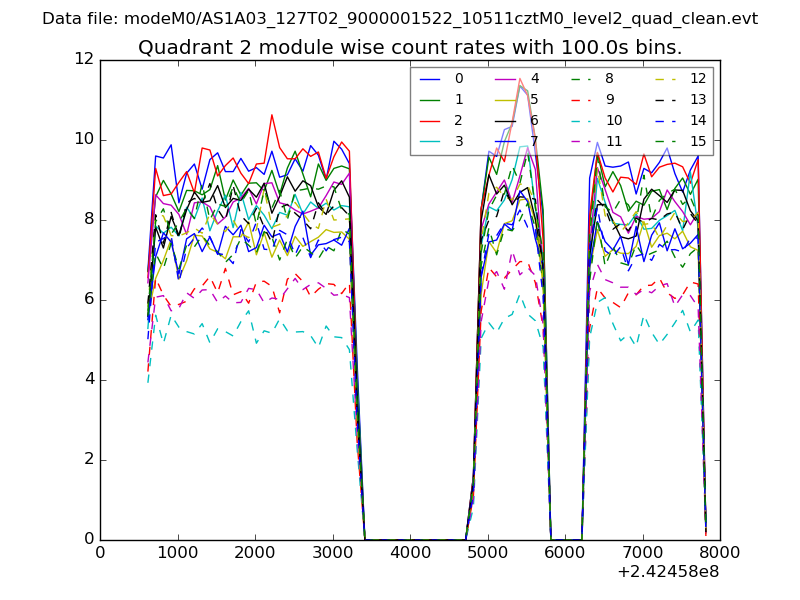
| Module-wise count rates for Quadrant B Data is divided into 100 sec bins |
 |
 |
| Module-wise count rates for Quadrant C Data is divided into 100 sec bins |
 |
 |
| Module-wise count rates for Quadrant D Data is divided into 100 sec bins |
 |
 |
| Parameter | Plot |
|---|---|
| CZT HV Monitor | 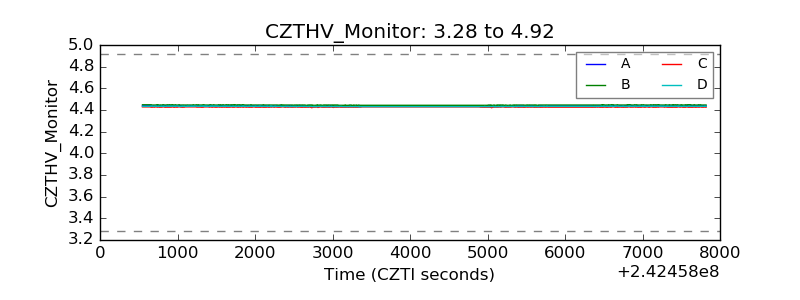 |
| D_VDD | 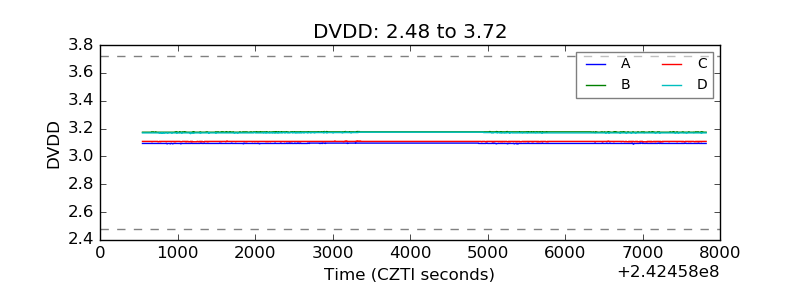 |
| Temperature 1 | 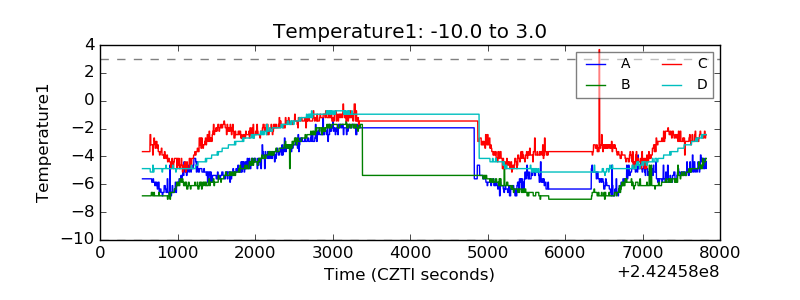 |
| Veto HV Monitor | 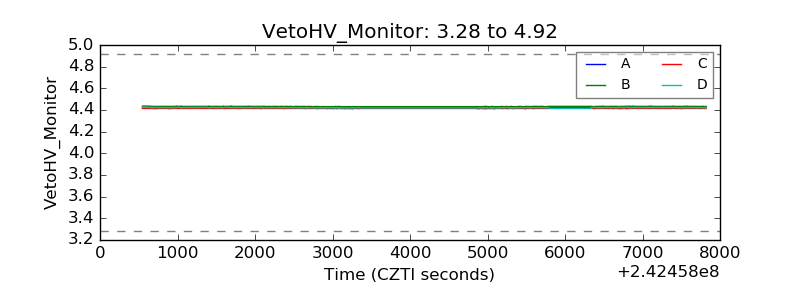 |
| Veto LLD | 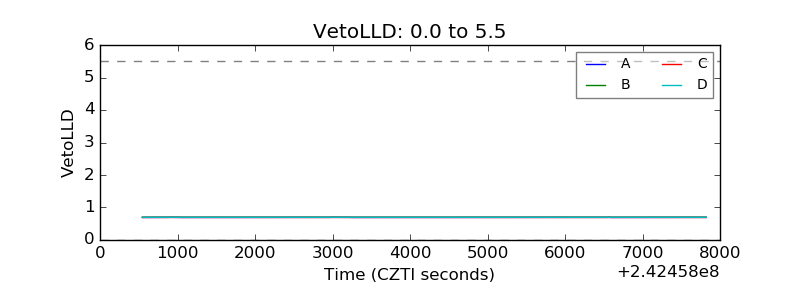 |
| Alpha Counter | 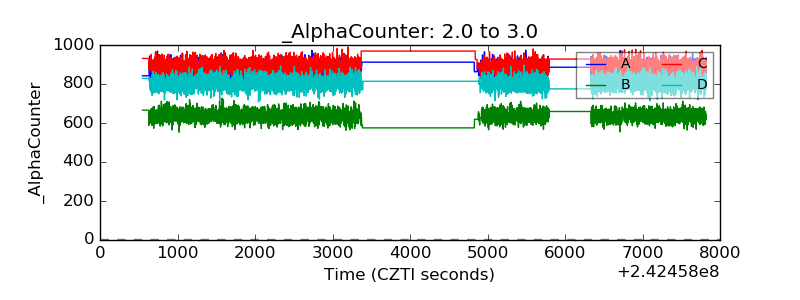 |
| _CPM_Rate | 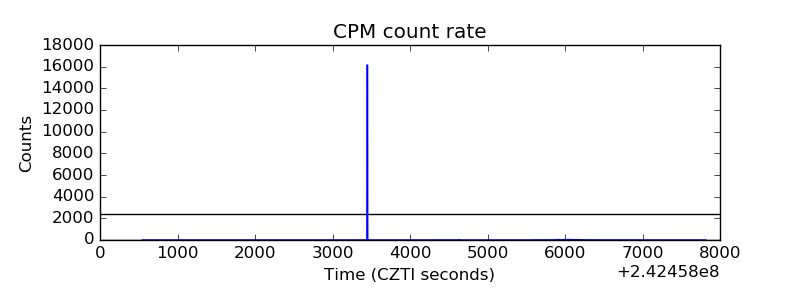 |
| CZT Counter | 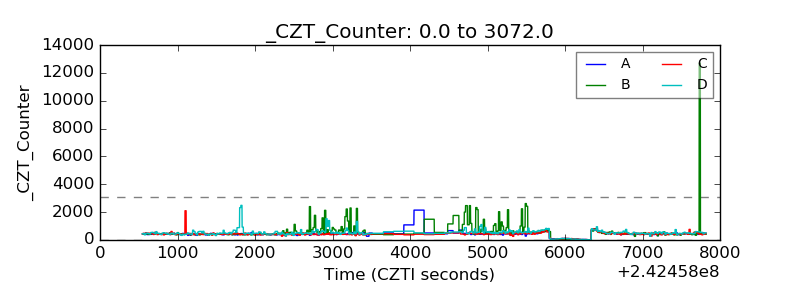 |
| +2.5 Volts monitor | 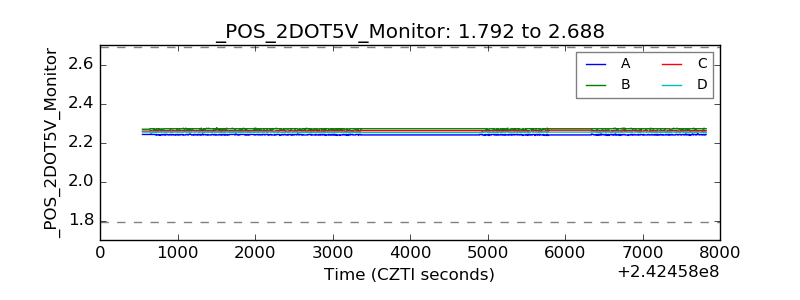 |
| +5 Volts monitor | 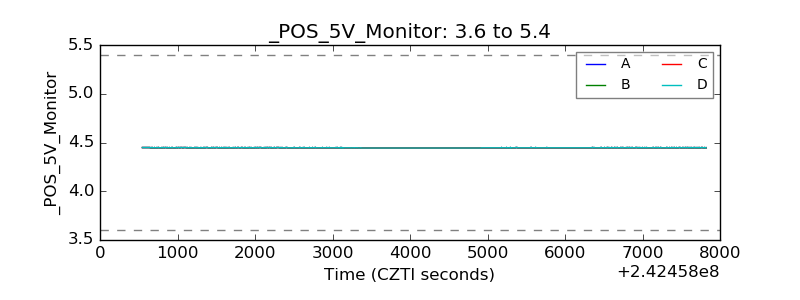 |
| _ROLL_ROT | 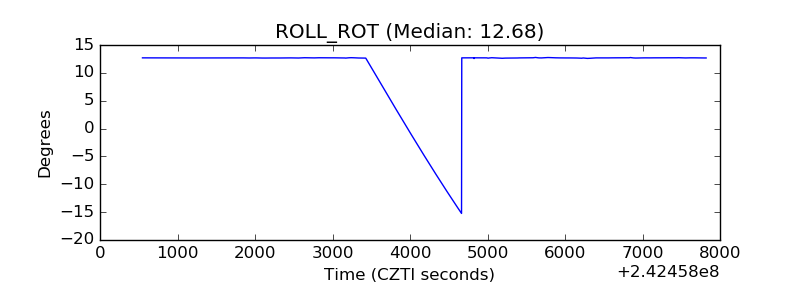 |
| _Roll_DEC |  |
| _Roll_RA | 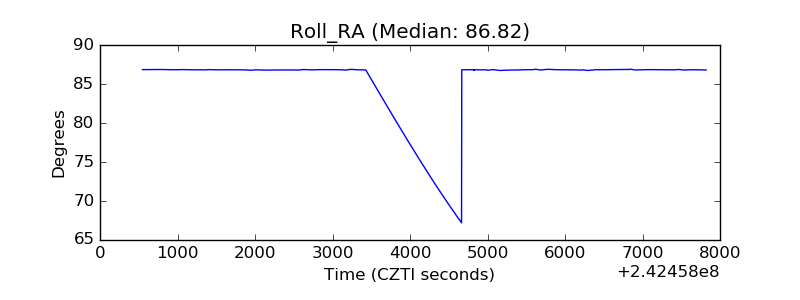 |
| Veto Counter | 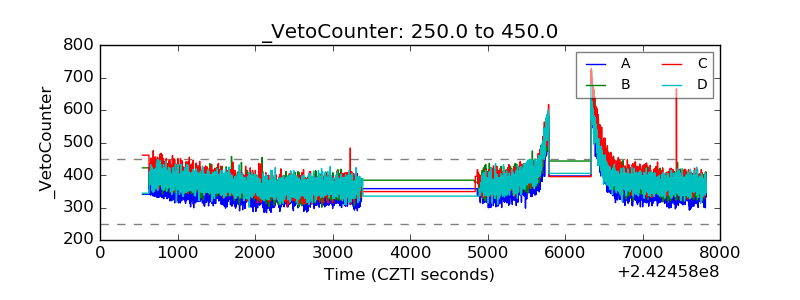 |