| Param | Original file | Final file |
|---|---|---|
| Filename | modeM0/AS1A03_127T02_9000001522_10517cztM0_level2.evt | modeM0/AS1A03_127T02_9000001522_10517cztM0_level2_quad_clean.evt |
| Size (bytes) | 995,477,760 | 192,764,160 |
| Size | 949.4 MB | 183.8 MB |
| Events in quadrant A | 5,875,655 | 1,303,507 |
| Events in quadrant B | 6,310,010 | 1,328,577 |
| Events in quadrant C | 5,059,725 | 1,411,335 |
| Events in quadrant D | 12,155,649 | 1,029,133 |
| Mode M9 | |||
|---|---|---|---|
| Quadrant | BADHDUFLAG | Total packets | Discarded packets |
| A | 0 | 9 | 0 |
| B | 0 | 10 | 1 |
| C | 0 | 9 | 0 |
| D | 0 | 9 | 0 |
| Mode M0 | |||
|---|---|---|---|
| Quadrant | BADHDUFLAG | Total packets | Discarded packets |
| A | 0 | 30203 | 5088 |
| B | 0 | 33706 | 7553 |
| C | 0 | 28092 | 4815 |
| D | 0 | 59592 | 16383 |
| Mode SS | |||
|---|---|---|---|
| Quadrant | BADHDUFLAG | Total packets | Discarded packets |
| A | 0 | 274 | 54 |
| B | 0 | 274 | 36 |
| C | 0 | 273 | 36 |
| D | 0 | 274 | 54 |
| Quadrant | Total seconds | Saturated seconds | Saturation percentage |
|---|---|---|---|
| A | 11264 | 446 | 3.959517% |
| B | 11081 | 516 | 4.656619% |
| C | 11309 | 217 | 1.918826% |
| D | 10325 | 2565 | 24.842615% |
Noise dominated data is calculated using 1-second bins in cleaned event files. If a bin has >2000 counts, and if more than 50% of those come from <1% of pixels, then it is considered to be noise-dominated and hence unusable.
| Quadrant | # 1 sec bins | Bins with >0 counts | Bins with >2000 counts | High rate bins dominated by noise | Noise dominated (total time) | Noise dominated (detector-on time) | Marked lightcurve |
|---|---|---|---|---|---|---|---|
| A | 37554 | 12428 | 193 | 193 | 0.51% | 1.55% | 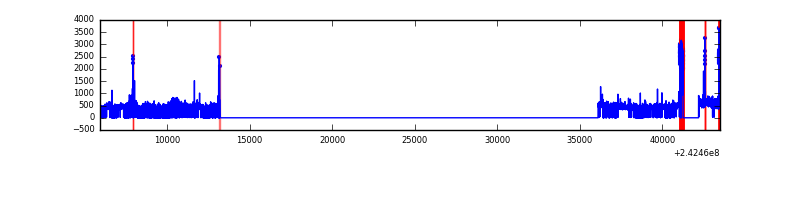 |
| B | 37554 | 12228 | 164 | 164 | 0.44% | 1.34% | 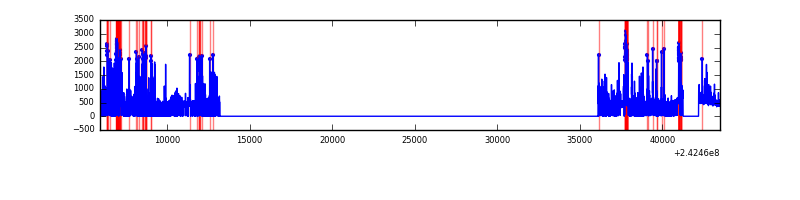 |
| C | 37552 | 12412 | 7 | 7 | 0.02% | 0.06% | 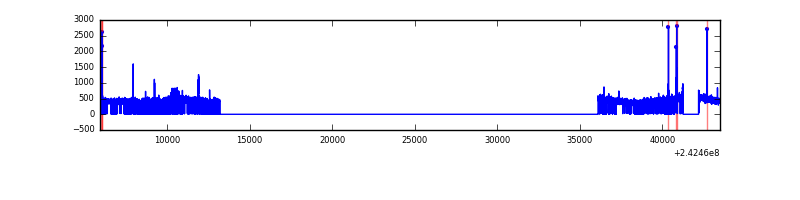 |
| D | 37553 | 11551 | 2274 | 2274 | 6.06% | 19.69% |  |
Top three noisy pixels from each quadrant. If the there are fewer than three noisy pixels in the level2.evt file, extra rows are filled as -1
| Pixel properties | Quadrant properties | ||||||
|---|---|---|---|---|---|---|---|
| Quadrant | DetID | PixID | Counts | Sigma | Mean | Median | Sigma |
| A | 15 | 239 | 536926 | 2077.41 | 1269 | 1238 | 257.9 |
| A | 13 | 251 | 234462 | 904.45 | 1269 | 1238 | 257.9 |
| A | 5 | 16 | 93081 | 356.17 | 1269 | 1238 | 257.9 |
| B | 4 | 239 | 1047740 | 4329.76 | 1270 | 1234 | 241.7 |
| B | 11 | 51 | 126461 | 518.11 | 1270 | 1234 | 241.7 |
| B | 0 | 214 | 65448 | 265.67 | 1270 | 1234 | 241.7 |
| C | 14 | 234 | 68435 | 229.28 | 1278 | 1280 | 292.9 |
| C | 13 | 61 | 9573 | 28.31 | 1278 | 1280 | 292.9 |
| C | 1 | 3 | 6698 | 18.5 | 1278 | 1280 | 292.9 |
| D | 2 | 16 | 5541609 | 23369.4 | 1005 | 975 | 237.1 |
| D | 1 | 20 | 1440229 | 6070.52 | 1005 | 975 | 237.1 |
| D | 8 | 195 | 520896 | 2192.93 | 1005 | 975 | 237.1 |
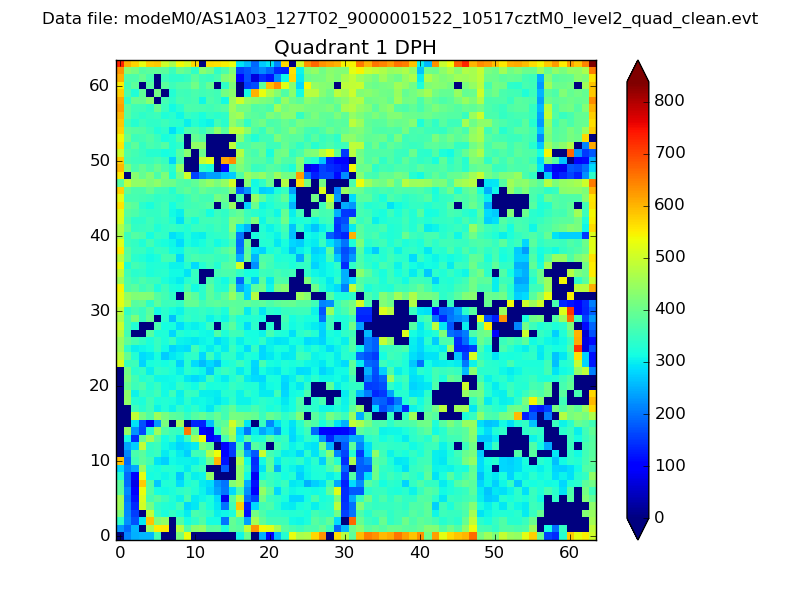
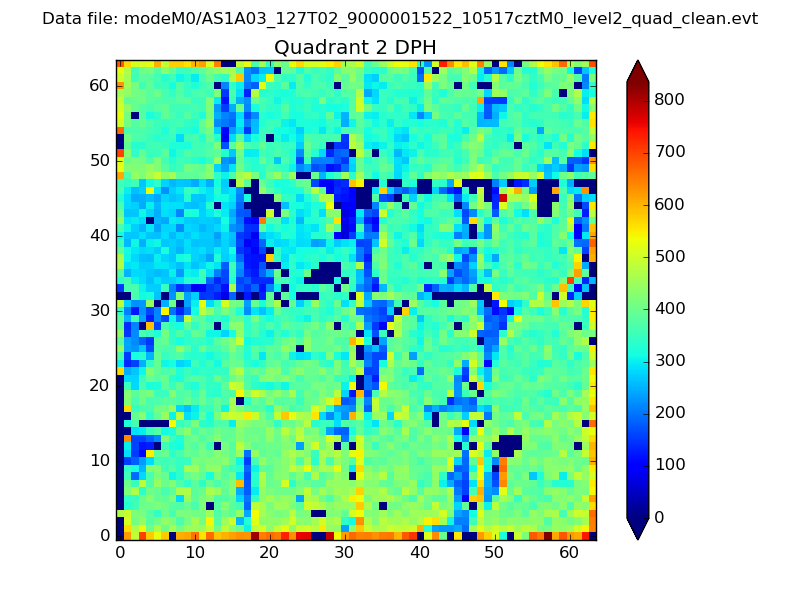
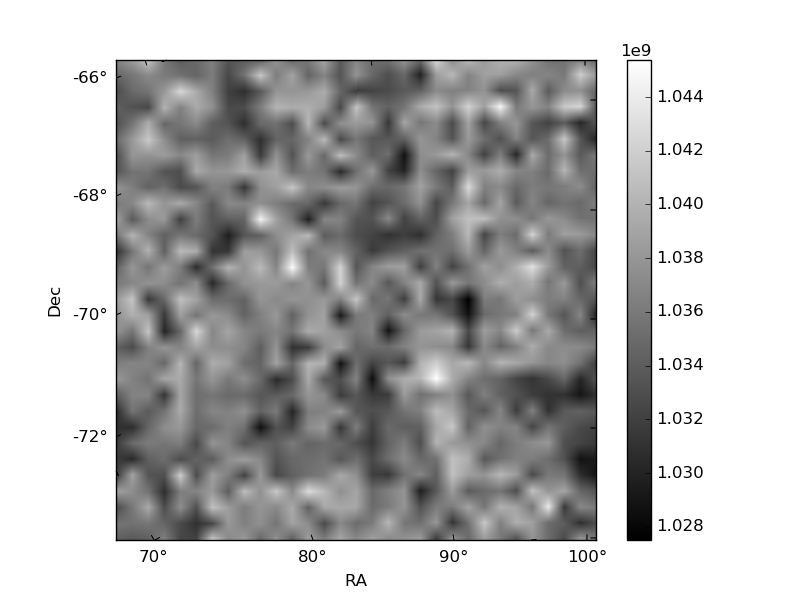
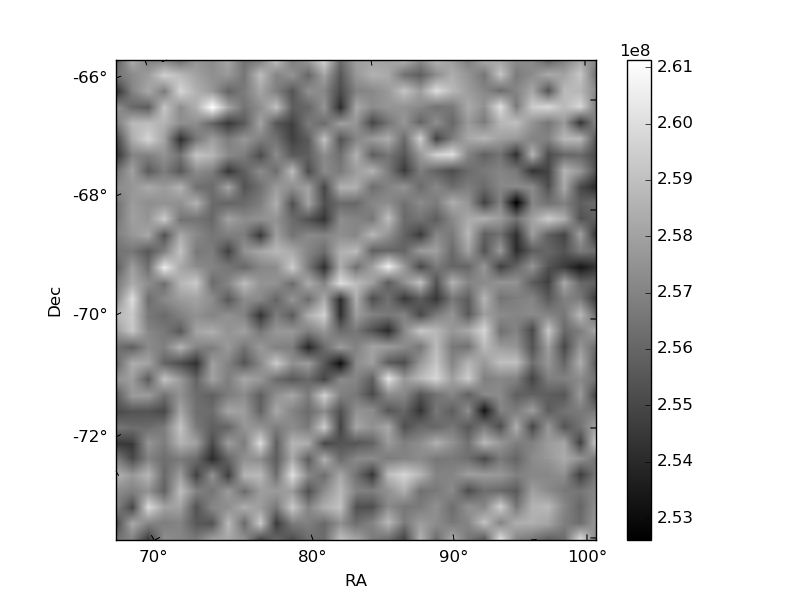
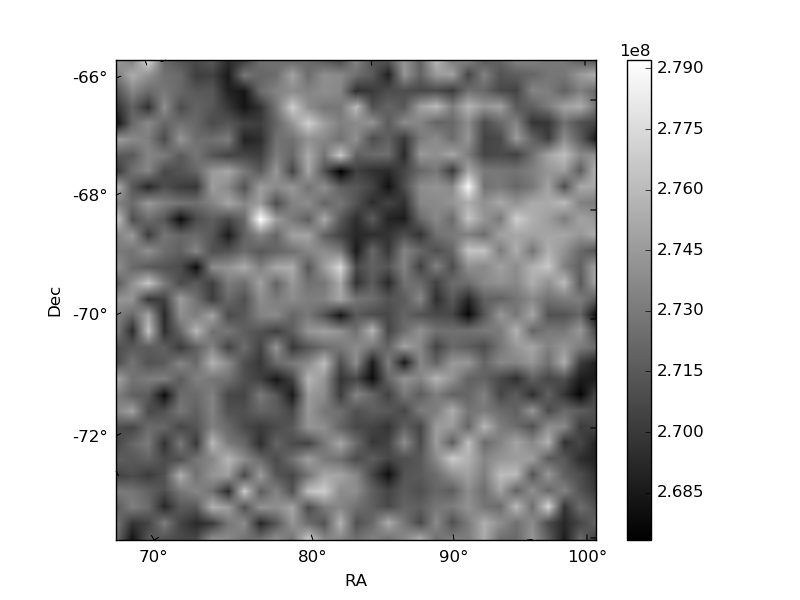
Histogram calculated using DETX and DETY for each event in the final _common_clean file
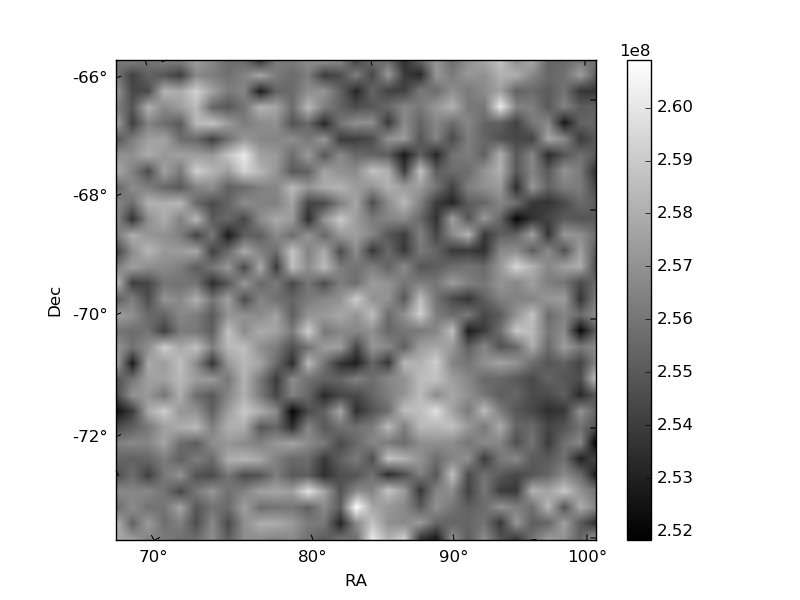
| Quadrant A | 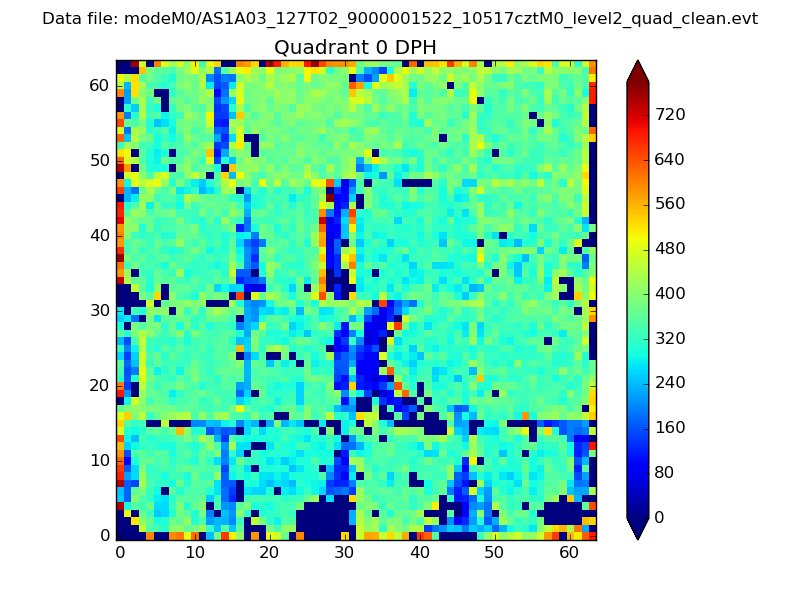 |
 |
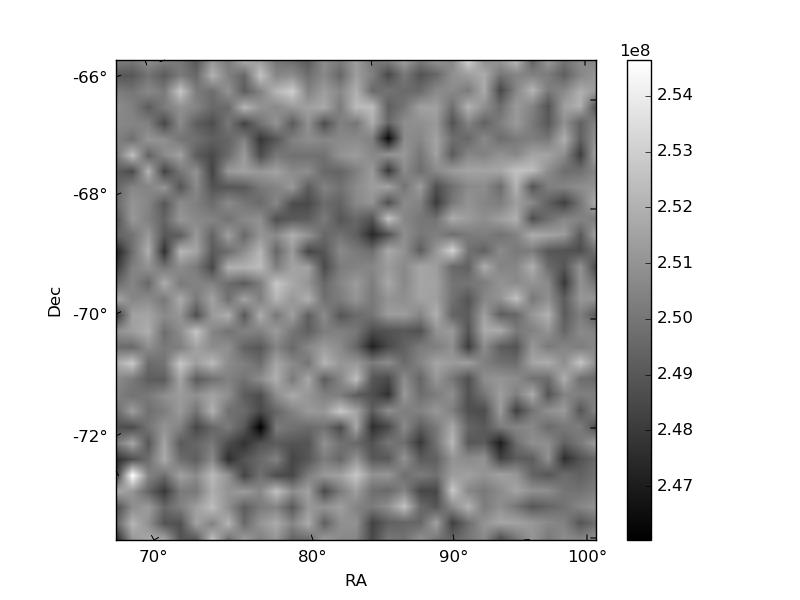
Quadrant B |
|---|---|---|---|
| Quadrant D | 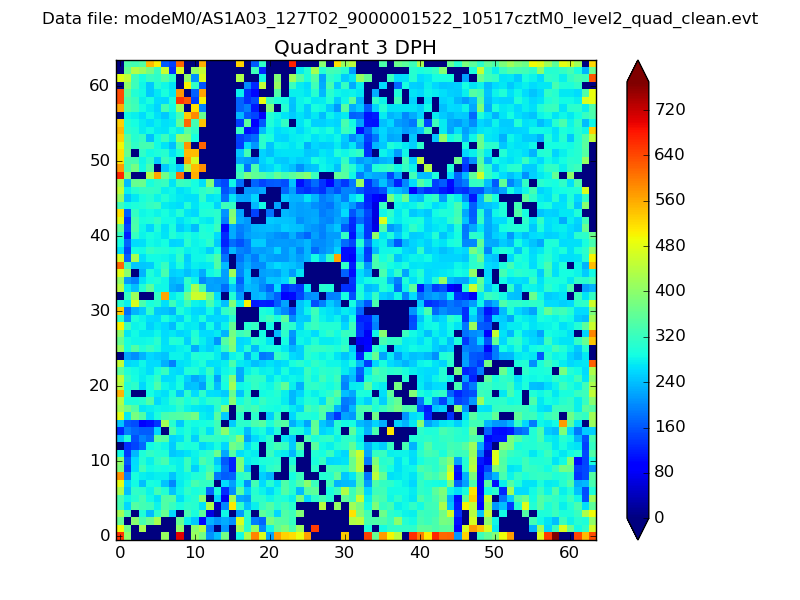 |
 |
Quadrant C |
| Plot type | Count rate plots | Images |
|---|---|---|
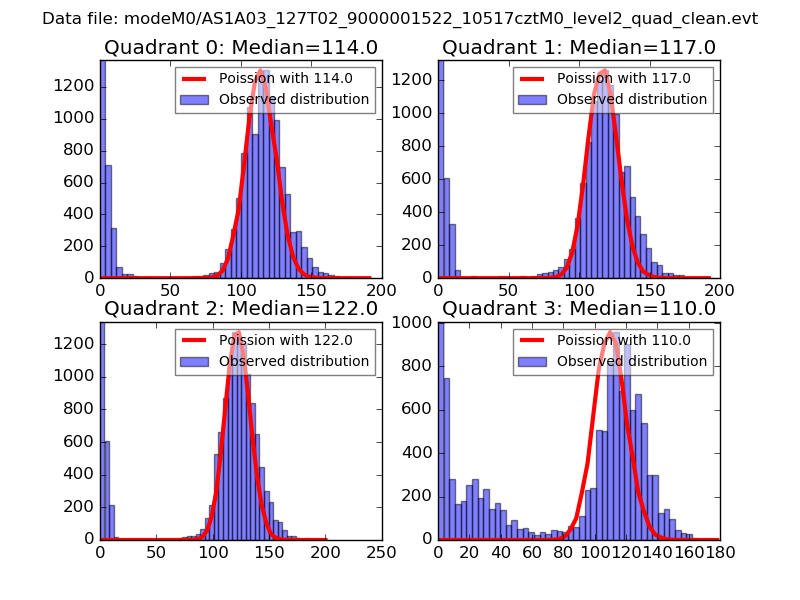
| Comparison with Poisson distribution Blue bars denote a histogram of data divided into 1 sec bins. Red curve is a Poisson curve with rate = median count rate of data. |
 |
 |
| Quadrant-wise count rates Data is divided into 100 sec bins |
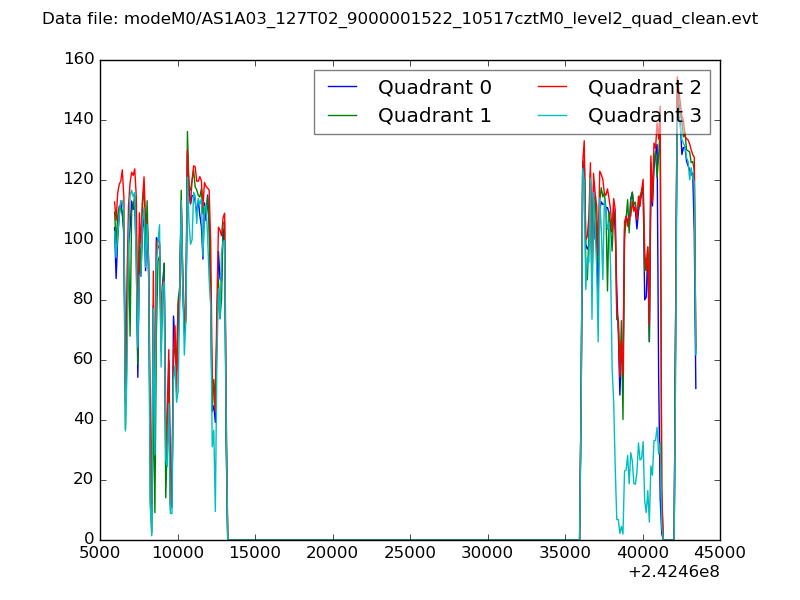 |
|
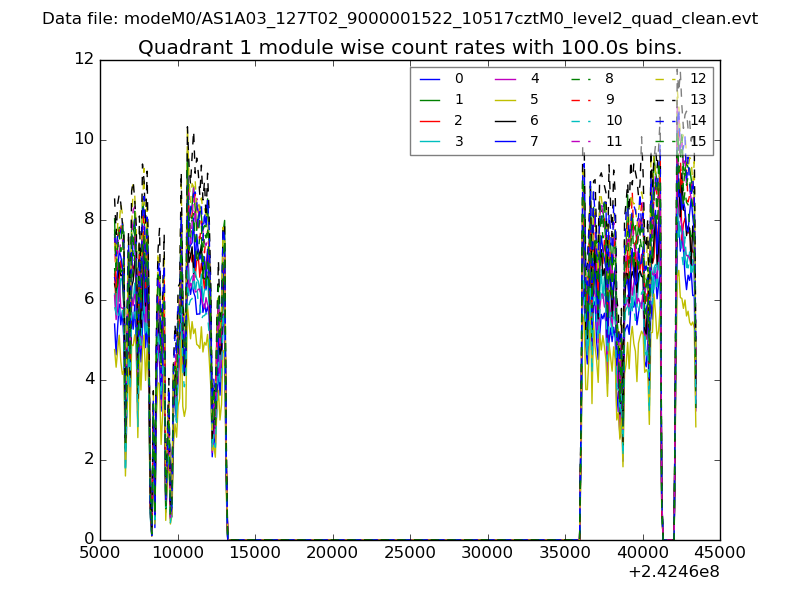
| Module-wise count rates for Quadrant A Data is divided into 100 sec bins |
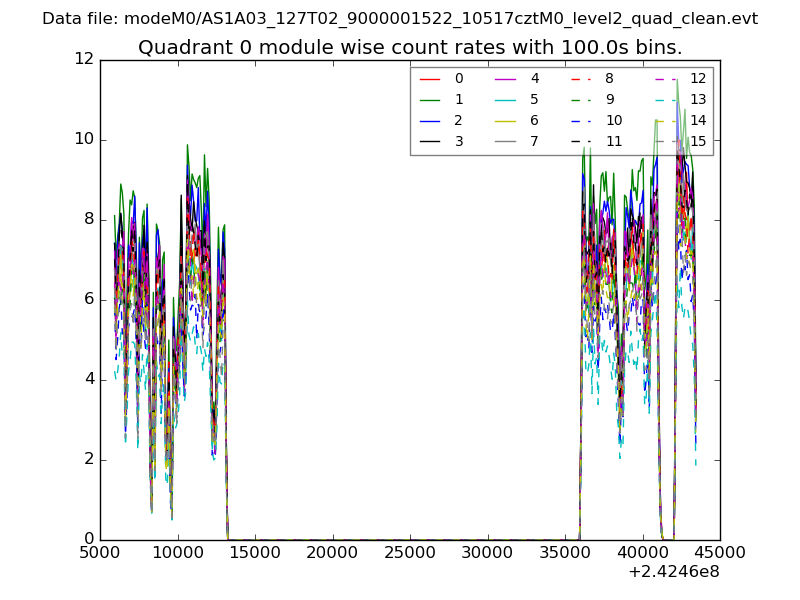 |
 |
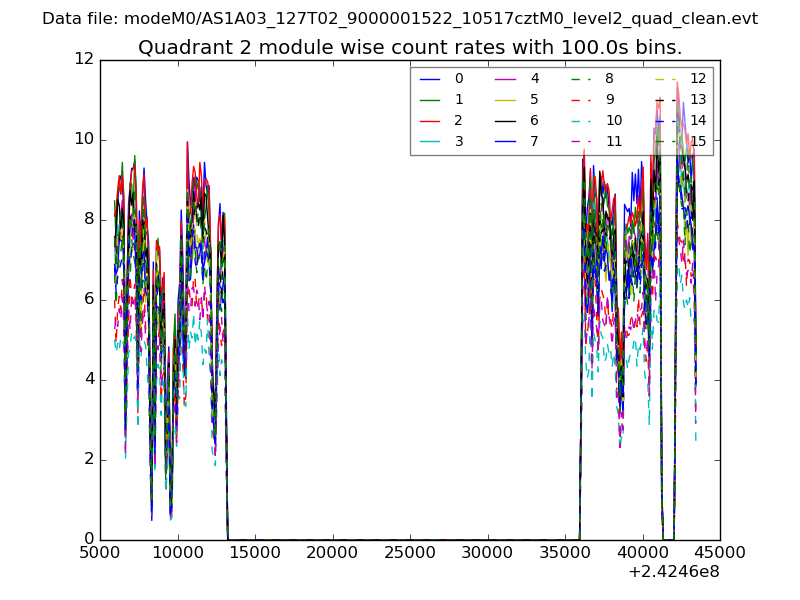
| Module-wise count rates for Quadrant B Data is divided into 100 sec bins |
 |
 |
| Module-wise count rates for Quadrant C Data is divided into 100 sec bins |
 |
 |
| Module-wise count rates for Quadrant D Data is divided into 100 sec bins |
 |
 |
| Parameter | Plot |
|---|---|
| CZT HV Monitor | 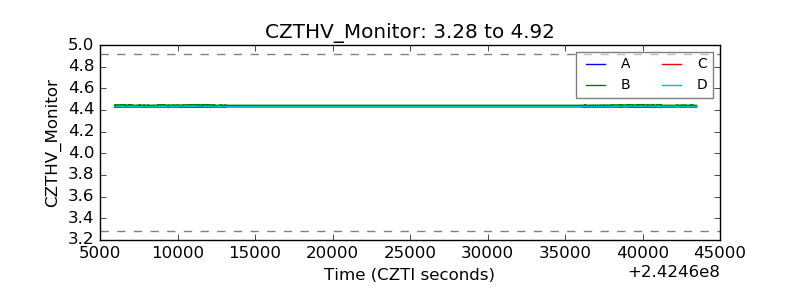 |
| D_VDD |  |
| Temperature 1 | 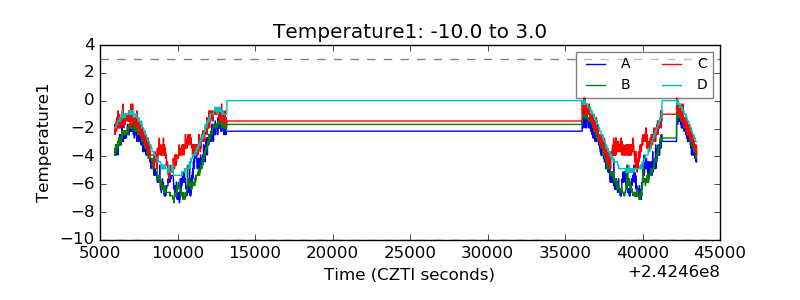 |
| Veto HV Monitor | 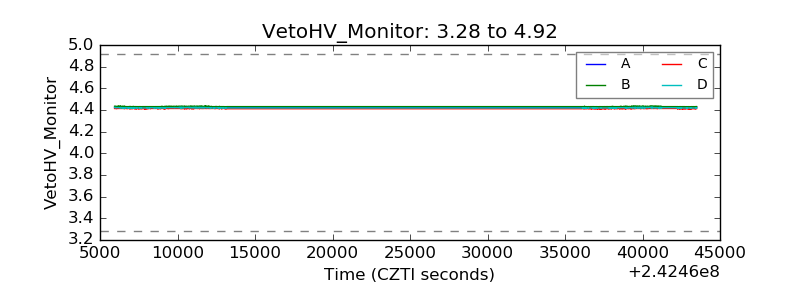 |
| Veto LLD |  |
| Alpha Counter | 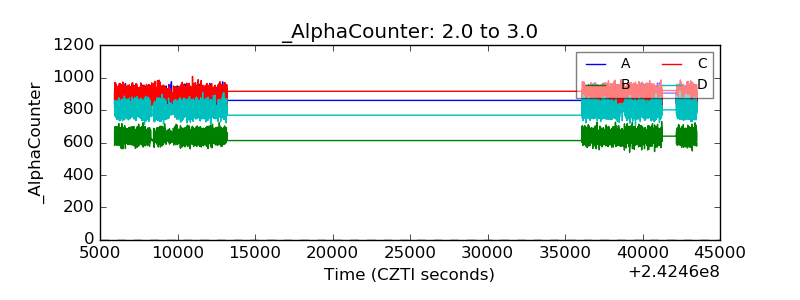 |
| _CPM_Rate | 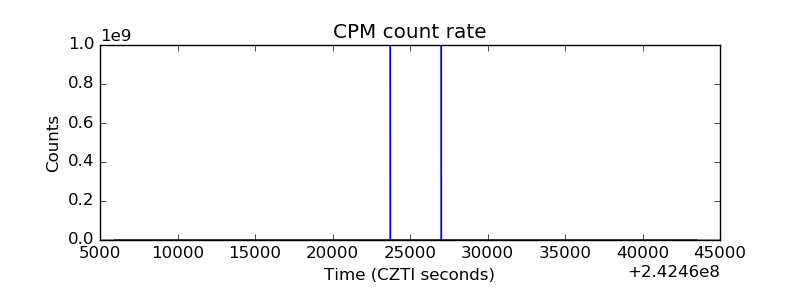 |
| CZT Counter | 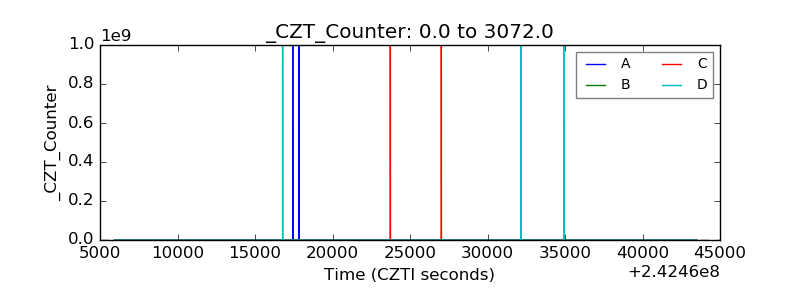 |
| +2.5 Volts monitor |  |
| +5 Volts monitor |  |
| _ROLL_ROT | 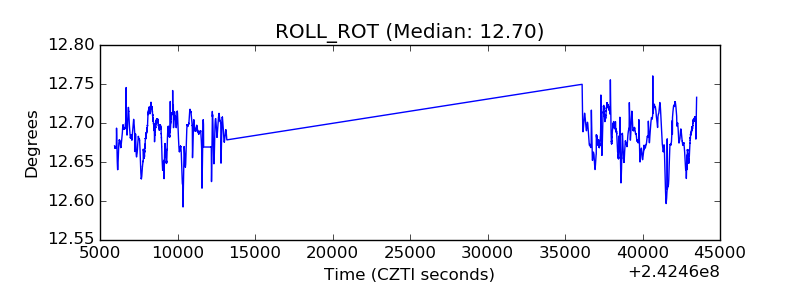 |
| _Roll_DEC | 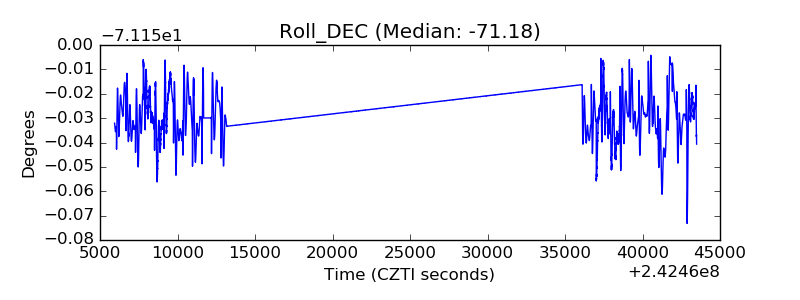 |
| _Roll_RA | 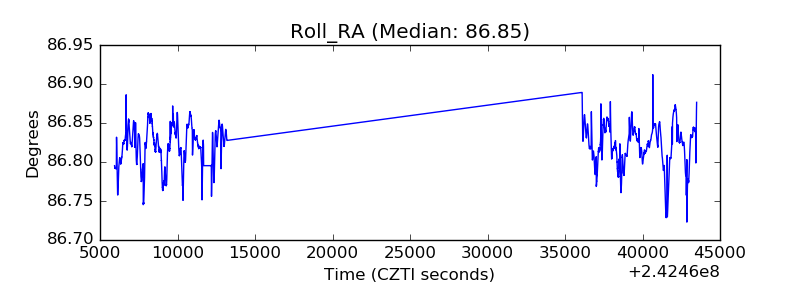 |
| Veto Counter |  |