| Param | Original file | Final file |
|---|---|---|
| Filename | modeM0/AS1A03_127T02_9000001522_10518cztM0_level2.evt | modeM0/AS1A03_127T02_9000001522_10518cztM0_level2_quad_clean.evt |
| Size (bytes) | 1,776,798,720 | 408,939,840 |
| Size | 1.7 GB | 390.0 MB |
| Events in quadrant A | 11,255,605 | 2,683,288 |
| Events in quadrant B | 14,584,660 | 2,688,129 |
| Events in quadrant C | 10,249,044 | 2,820,906 |
| Events in quadrant D | 16,165,521 | 2,608,120 |
| Mode M9 | |||
|---|---|---|---|
| Quadrant | BADHDUFLAG | Total packets | Discarded packets |
| A | 0 | 14 | 0 |
| B | 0 | 14 | 0 |
| C | 0 | 14 | 0 |
| D | 0 | 14 | 0 |
| Mode M0 | |||
|---|---|---|---|
| Quadrant | BADHDUFLAG | Total packets | Discarded packets |
| A | 0 | 48786 | 6 |
| B | 0 | 58561 | 11 |
| C | 0 | 47369 | 7 |
| D | 0 | 63125 | 14 |
| Mode SS | |||
|---|---|---|---|
| Quadrant | BADHDUFLAG | Total packets | Discarded packets |
| A | 0 | 468 | 0 |
| B | 0 | 468 | 0 |
| C | 0 | 468 | 0 |
| D | 0 | 468 | 0 |
| Quadrant | Total seconds | Saturated seconds | Saturation percentage |
|---|---|---|---|
| A | 23038 | 547 | 2.374338% |
| B | 23035 | 1617 | 7.019753% |
| C | 23037 | 393 | 1.705951% |
| D | 23037 | 1394 | 6.051135% |
Noise dominated data is calculated using 1-second bins in cleaned event files. If a bin has >2000 counts, and if more than 50% of those come from <1% of pixels, then it is considered to be noise-dominated and hence unusable.
| Quadrant | # 1 sec bins | Bins with >0 counts | Bins with >2000 counts | High rate bins dominated by noise | Noise dominated (total time) | Noise dominated (detector-on time) | Marked lightcurve |
|---|---|---|---|---|---|---|---|
| A | 31716 | 23042 | 68 | 68 | 0.21% | 0.30% | 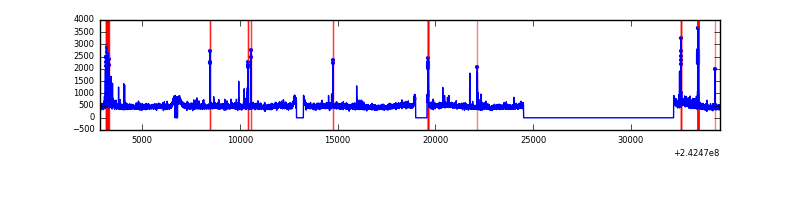 |
| B | 31716 | 23042 | 879 | 879 | 2.77% | 3.81% | 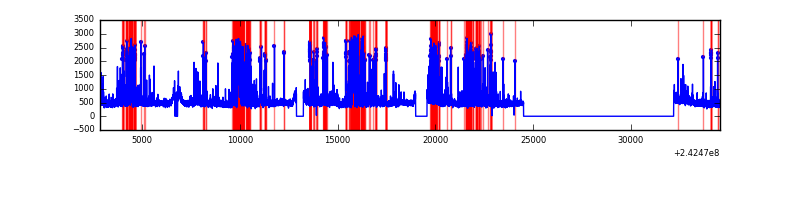 |
| C | 31716 | 23042 | 13 | 13 | 0.04% | 0.06% | 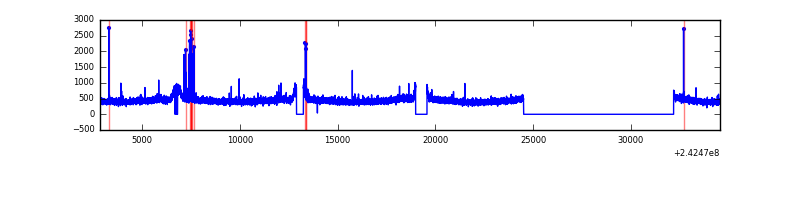 |
| D | 31716 | 23042 | 890 | 890 | 2.81% | 3.86% | 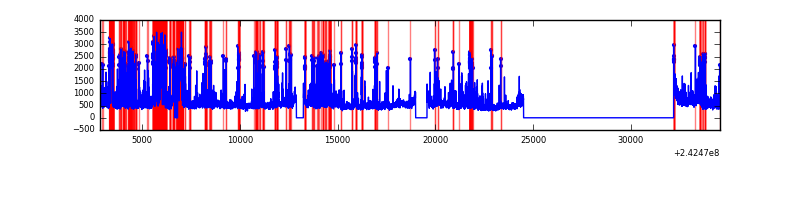 |
Top three noisy pixels from each quadrant. If the there are fewer than three noisy pixels in the level2.evt file, extra rows are filled as -1
| Pixel properties | Quadrant properties | ||||||
|---|---|---|---|---|---|---|---|
| Quadrant | DetID | PixID | Counts | Sigma | Mean | Median | Sigma |
| A | 13 | 251 | 379291 | 710.1 | 2615 | 2549 | 530.5 |
| A | 15 | 239 | 277623 | 518.47 | 2615 | 2549 | 530.5 |
| A | 5 | 16 | 276284 | 515.95 | 2615 | 2549 | 530.5 |
| B | 4 | 239 | 3613016 | 7364.65 | 2598 | 2525 | 490.2 |
| B | 11 | 51 | 357701 | 724.48 | 2598 | 2525 | 490.2 |
| B | 0 | 214 | 211915 | 427.11 | 2598 | 2525 | 490.2 |
| C | 14 | 234 | 125235 | 207.1 | 2591 | 2599 | 592.2 |
| C | 13 | 61 | 19168 | 27.98 | 2591 | 2599 | 592.2 |
| C | 1 | 3 | 8724 | 10.34 | 2591 | 2599 | 592.2 |
| D | 1 | 52 | 1575424 | 2663.05 | 2492 | 2419 | 590.7 |
| D | 8 | 195 | 1332351 | 2251.54 | 2492 | 2419 | 590.7 |
| D | 1 | 20 | 924322 | 1560.76 | 2492 | 2419 | 590.7 |
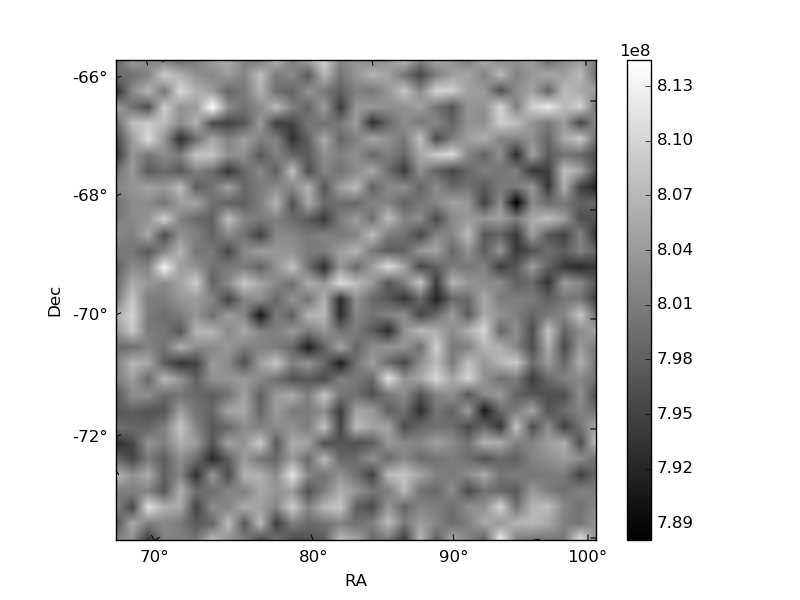
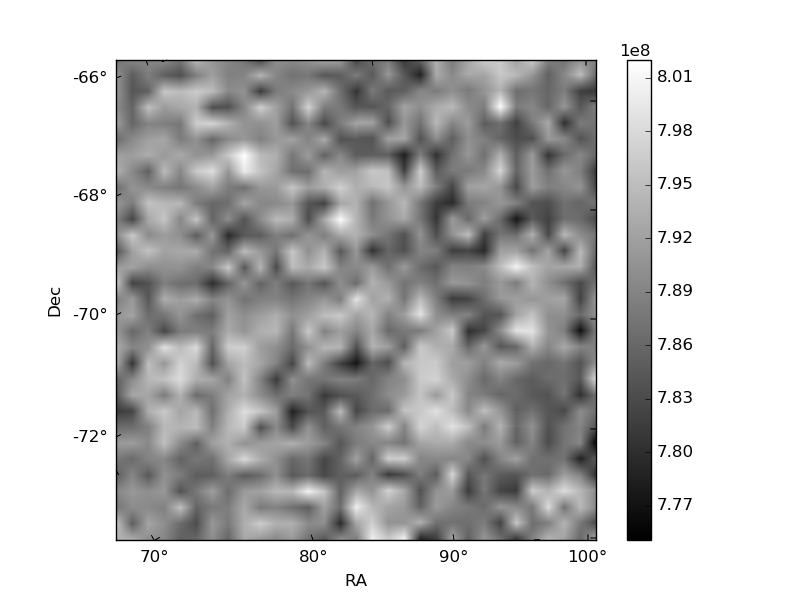
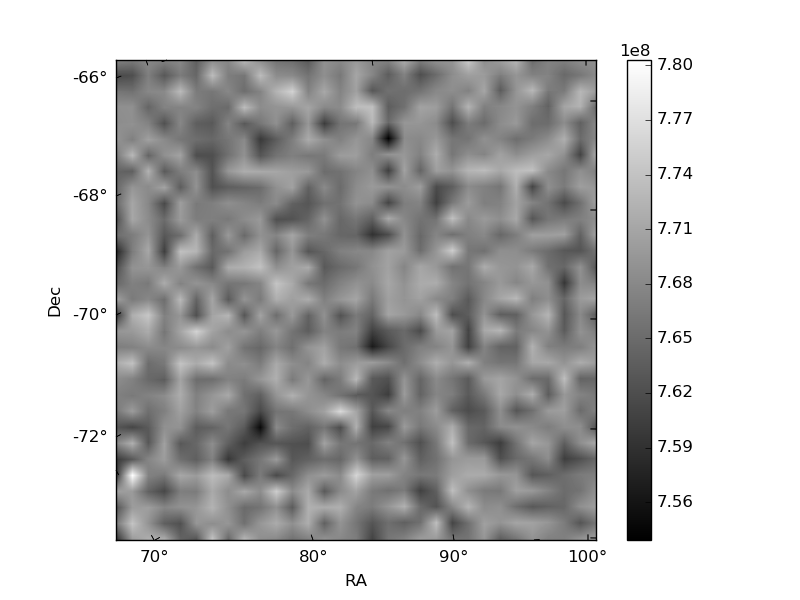
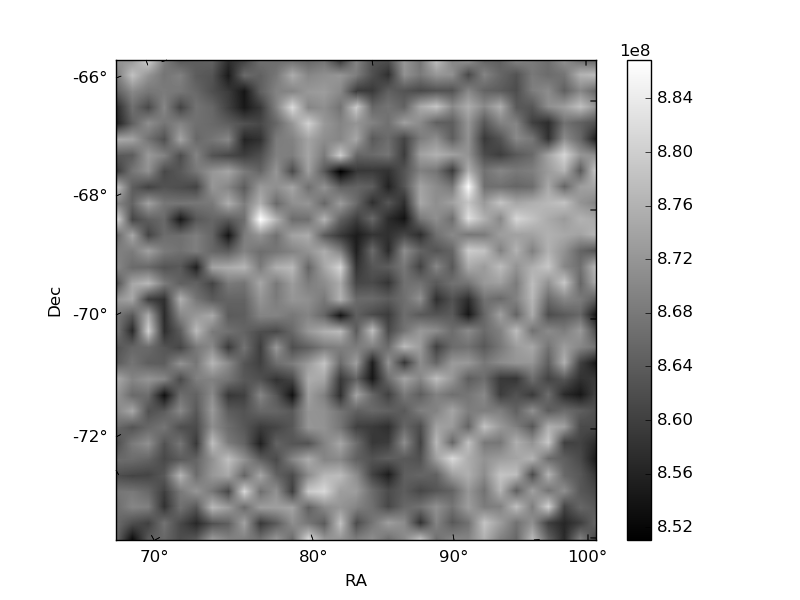
Histogram calculated using DETX and DETY for each event in the final _common_clean file
| Quadrant A | 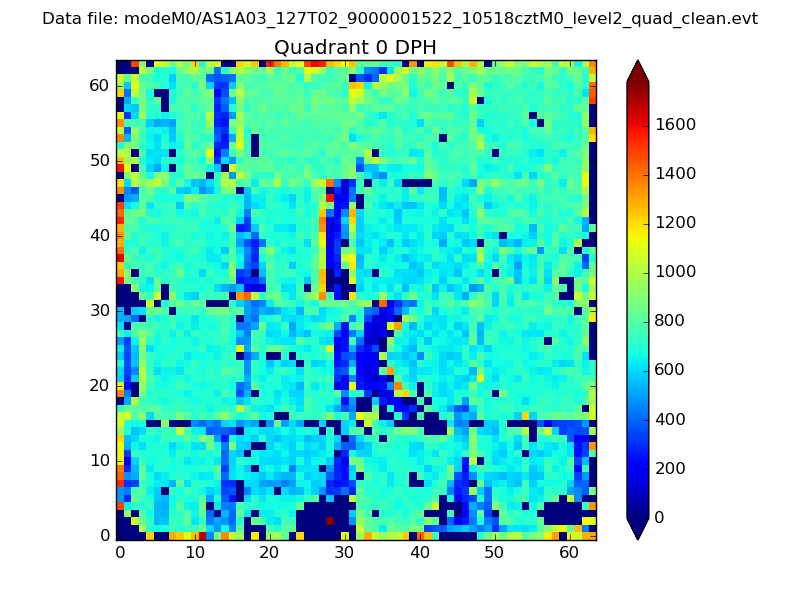 |
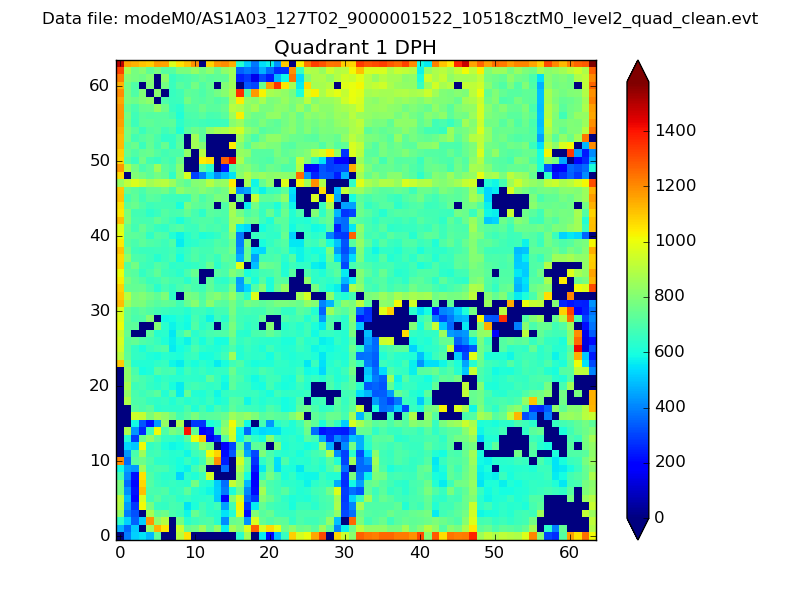 |
Quadrant B |
|---|---|---|---|
| Quadrant D | 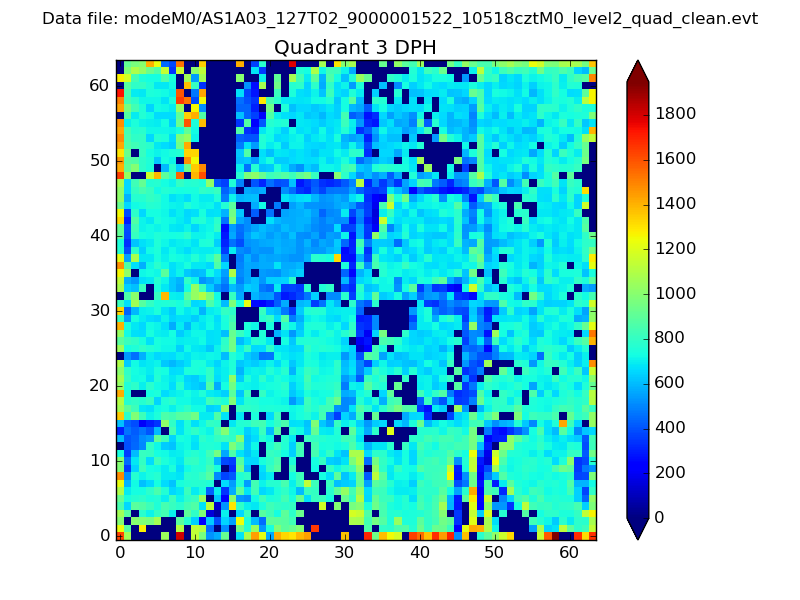 |
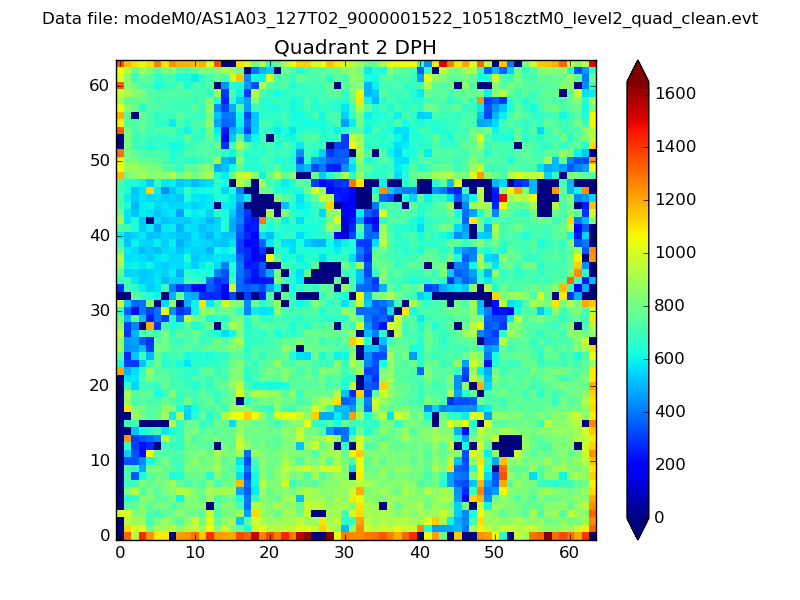 |
Quadrant C |
| Plot type | Count rate plots | Images |
|---|---|---|
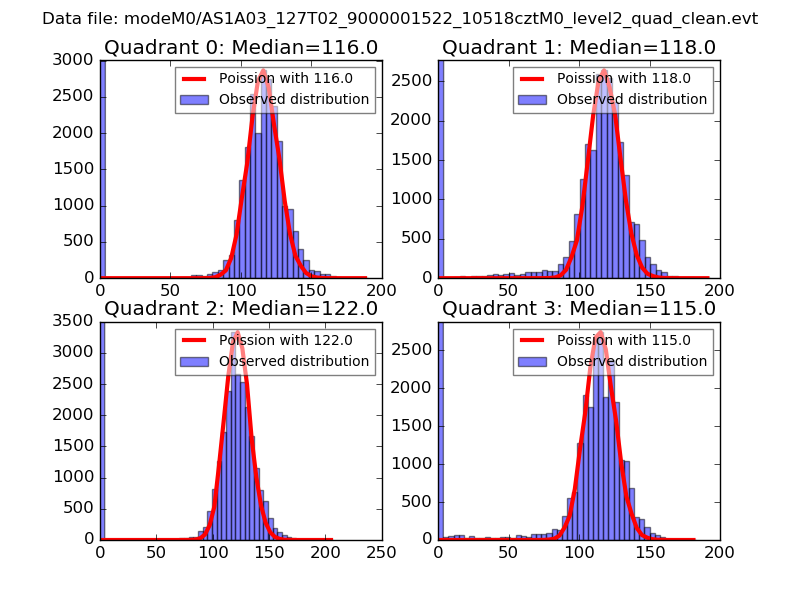
| Comparison with Poisson distribution Blue bars denote a histogram of data divided into 1 sec bins. Red curve is a Poisson curve with rate = median count rate of data. |
 |
 |
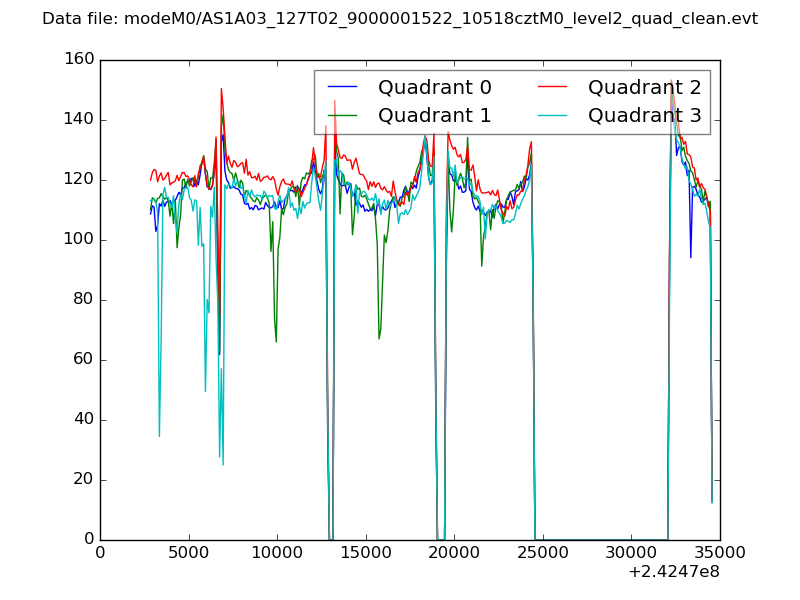
| Quadrant-wise count rates Data is divided into 100 sec bins |
 |
|
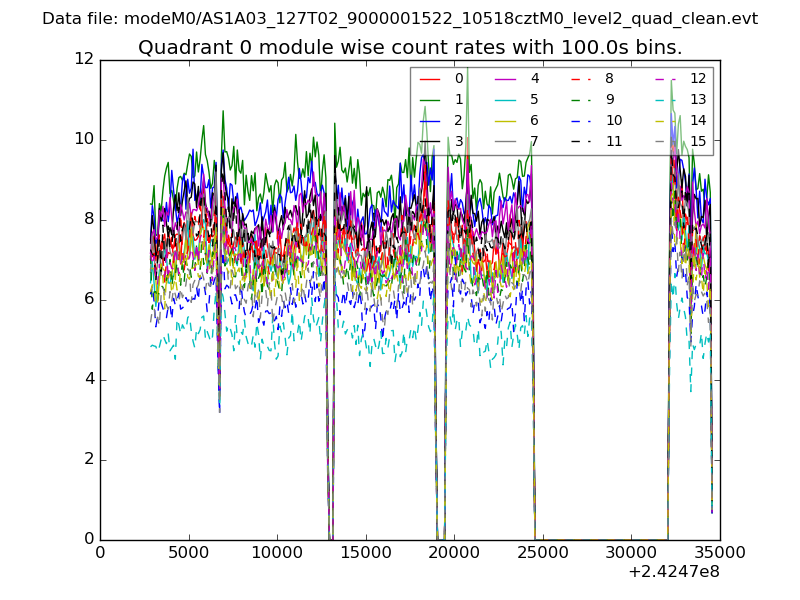
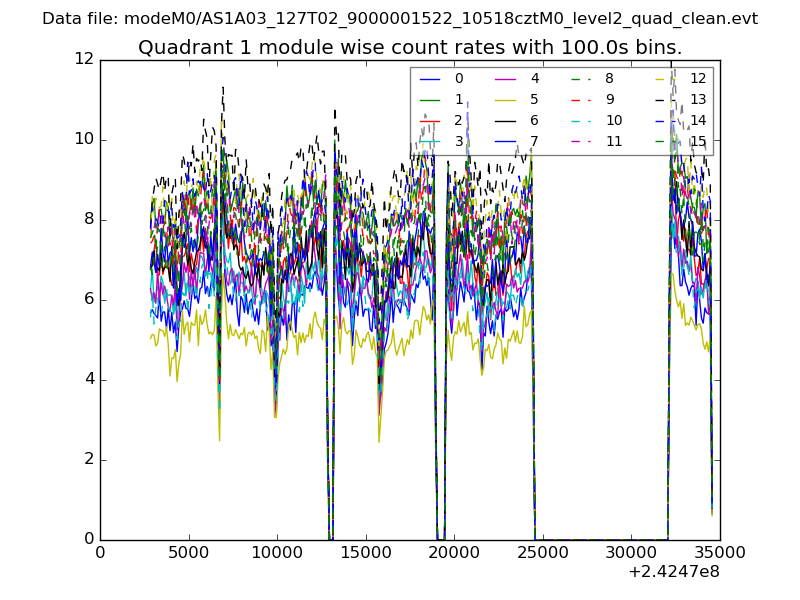
| Module-wise count rates for Quadrant A Data is divided into 100 sec bins |
 |
 |
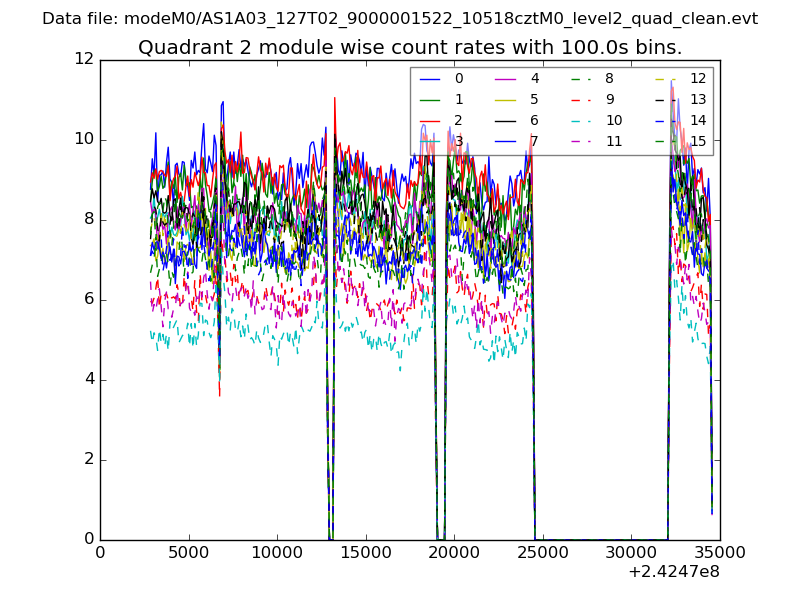
| Module-wise count rates for Quadrant B Data is divided into 100 sec bins |
 |
 |
| Module-wise count rates for Quadrant C Data is divided into 100 sec bins |
 |
 |
| Module-wise count rates for Quadrant D Data is divided into 100 sec bins |
 |
 |
| Parameter | Plot |
|---|---|
| CZT HV Monitor | 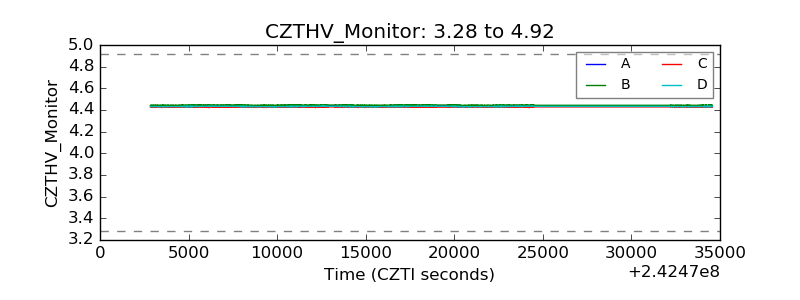 |
| D_VDD | 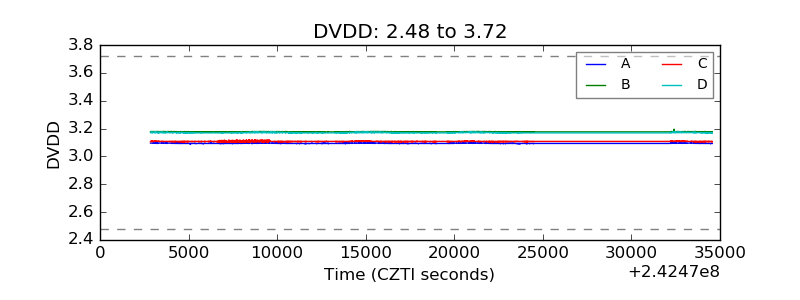 |
| Temperature 1 |  |
| Veto HV Monitor | 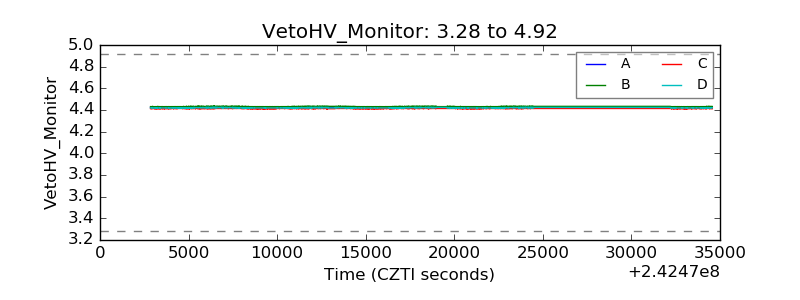 |
| Veto LLD | 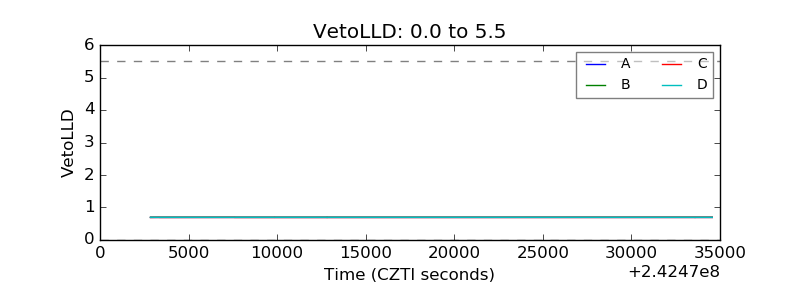 |
| Alpha Counter | 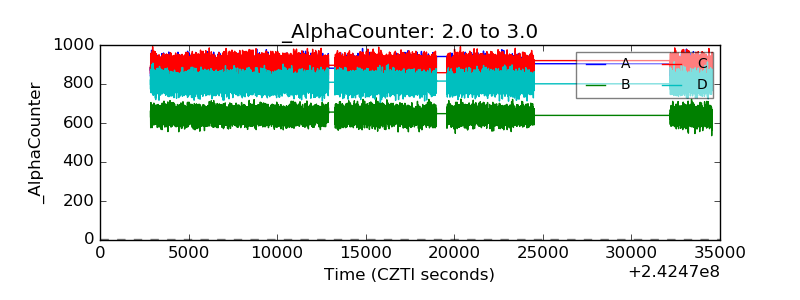 |
| _CPM_Rate | 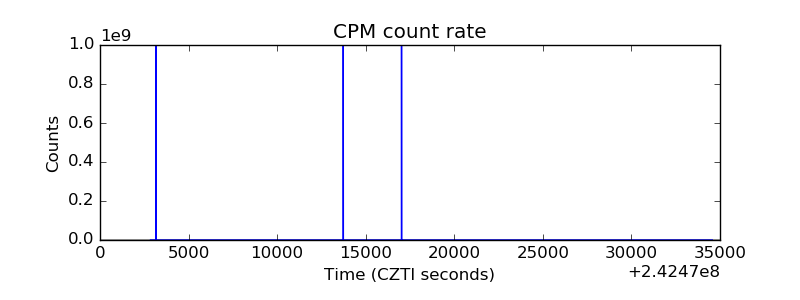 |
| CZT Counter | 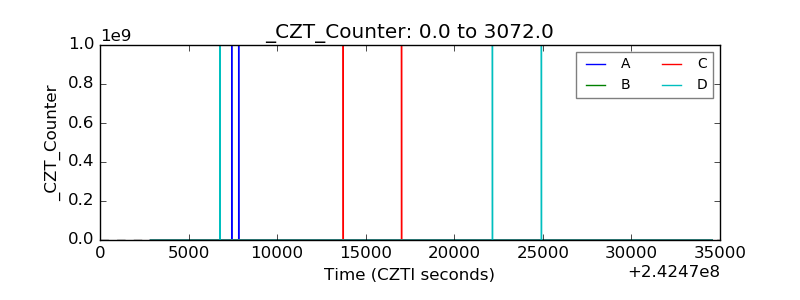 |
| +2.5 Volts monitor |  |
| +5 Volts monitor |  |
| _ROLL_ROT |  |
| _Roll_DEC |  |
| _Roll_RA | 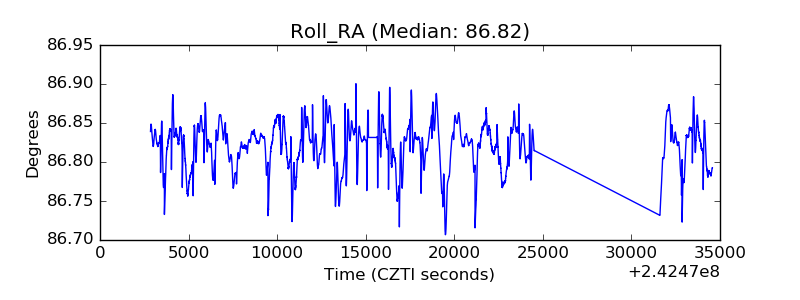 |
| Veto Counter | 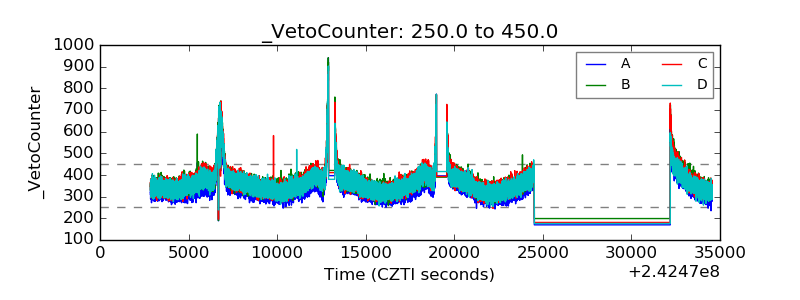 |