| Param | Original file | Final file |
|---|---|---|
| Filename | modeM0/AS1A03_127T02_9000001522_10520cztM0_level2.evt | modeM0/AS1A03_127T02_9000001522_10520cztM0_level2_quad_clean.evt |
| Size (bytes) | 1,224,515,520 | 230,411,520 |
| Size | 1.1 GB | 219.7 MB |
| Events in quadrant A | 6,805,841 | 1,544,792 |
| Events in quadrant B | 7,750,653 | 1,585,846 |
| Events in quadrant C | 5,815,791 | 1,641,544 |
| Events in quadrant D | 15,816,634 | 1,288,813 |
| Mode M9 | |||
|---|---|---|---|
| Quadrant | BADHDUFLAG | Total packets | Discarded packets |
| A | 0 | 20 | 0 |
| B | 0 | 20 | 0 |
| C | 0 | 20 | 0 |
| D | 0 | 21 | 0 |
| Mode M0 | |||
|---|---|---|---|
| Quadrant | BADHDUFLAG | Total packets | Discarded packets |
| A | 0 | 29069 | 3 |
| B | 0 | 31887 | 3 |
| C | 0 | 26986 | 3 |
| D | 0 | 56183 | 3 |
| Mode SS | |||
|---|---|---|---|
| Quadrant | BADHDUFLAG | Total packets | Discarded packets |
| A | 0 | 270 | 0 |
| B | 0 | 270 | 0 |
| C | 0 | 270 | 0 |
| D | 0 | 270 | 0 |
| Quadrant | Total seconds | Saturated seconds | Saturation percentage |
|---|---|---|---|
| A | 13263 | 278 | 2.096057% |
| B | 13263 | 499 | 3.762346% |
| C | 13263 | 48 | 0.361909% |
| D | 13263 | 3377 | 25.461811% |
Noise dominated data is calculated using 1-second bins in cleaned event files. If a bin has >2000 counts, and if more than 50% of those come from <1% of pixels, then it is considered to be noise-dominated and hence unusable.
| Quadrant | # 1 sec bins | Bins with >0 counts | Bins with >2000 counts | High rate bins dominated by noise | Noise dominated (total time) | Noise dominated (detector-on time) | Marked lightcurve |
|---|---|---|---|---|---|---|---|
| A | 14988 | 13264 | 210 | 210 | 1.40% | 1.58% | 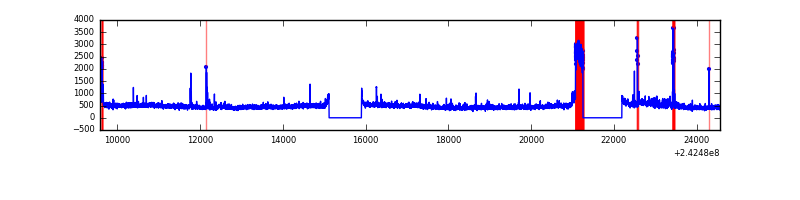 |
| B | 14988 | 13264 | 293 | 293 | 1.95% | 2.21% | 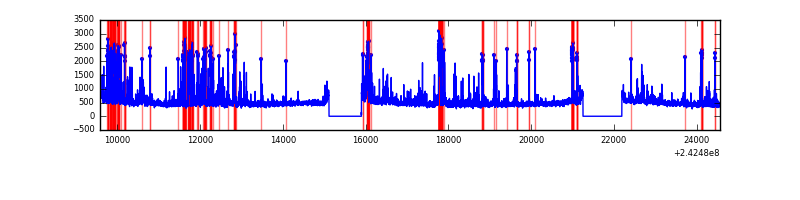 |
| C | 14988 | 13264 | 5 | 5 | 0.03% | 0.04% | 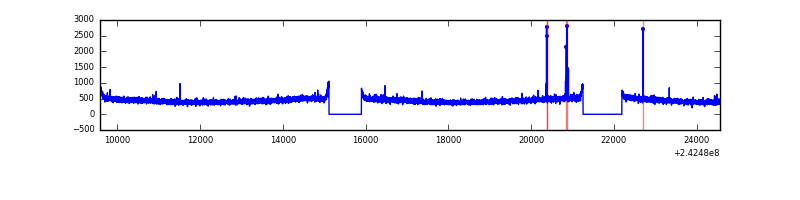 |
| D | 14988 | 13264 | 3324 | 3324 | 22.18% | 25.06% | 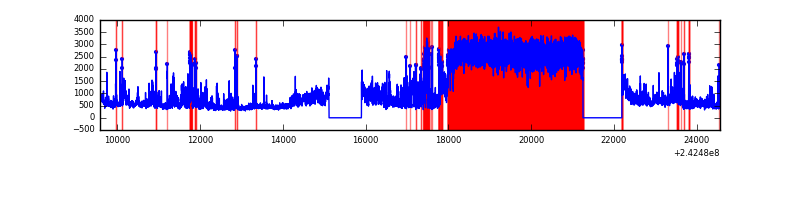 |
Top three noisy pixels from each quadrant. If the there are fewer than three noisy pixels in the level2.evt file, extra rows are filled as -1
| Pixel properties | Quadrant properties | ||||||
|---|---|---|---|---|---|---|---|
| Quadrant | DetID | PixID | Counts | Sigma | Mean | Median | Sigma |
| A | 15 | 239 | 601186 | 1999.66 | 1478 | 1444 | 299.9 |
| A | 13 | 251 | 328022 | 1088.88 | 1478 | 1444 | 299.9 |
| A | 14 | 254 | 49600 | 160.56 | 1478 | 1444 | 299.9 |
| B | 4 | 239 | 1457814 | 5118.45 | 1502 | 1464 | 284.5 |
| B | 11 | 51 | 194479 | 678.37 | 1502 | 1464 | 284.5 |
| B | 0 | 214 | 98259 | 340.19 | 1502 | 1464 | 284.5 |
| C | 14 | 234 | 38658 | 109.73 | 1479 | 1484 | 338.8 |
| C | 13 | 61 | 11010 | 28.12 | 1479 | 1484 | 338.8 |
| C | 1 | 3 | 7092 | 16.55 | 1479 | 1484 | 338.8 |
| D | 2 | 16 | 7979204 | 27108.3 | 1239 | 1203 | 294.3 |
| D | 1 | 20 | 1754932 | 5958.96 | 1239 | 1203 | 294.3 |
| D | 8 | 195 | 633784 | 2149.43 | 1239 | 1203 | 294.3 |
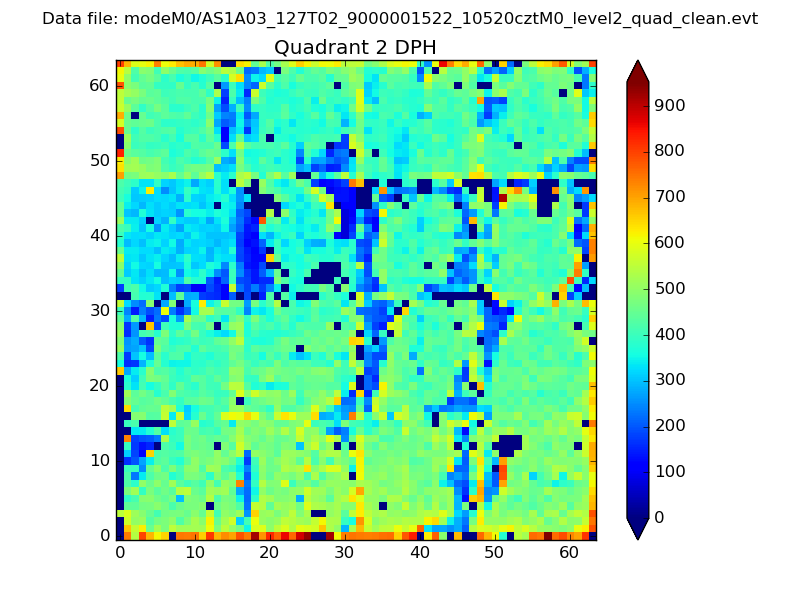
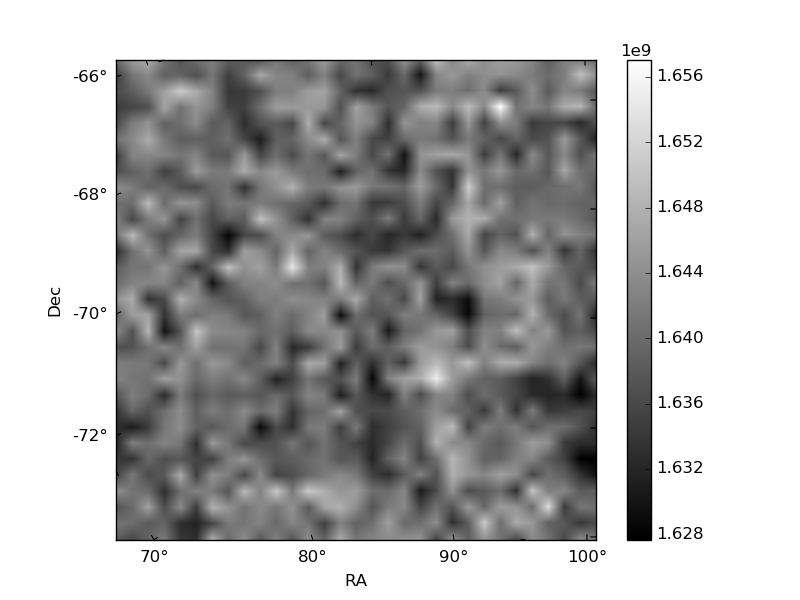
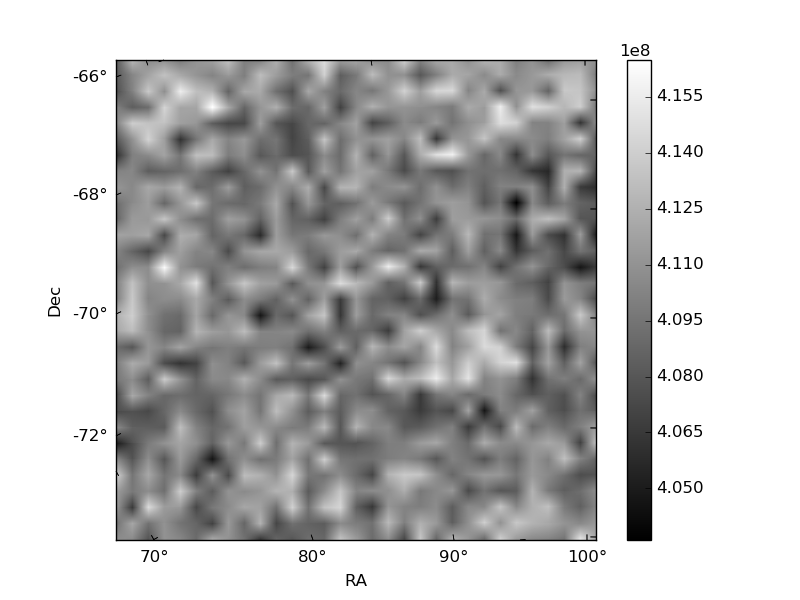
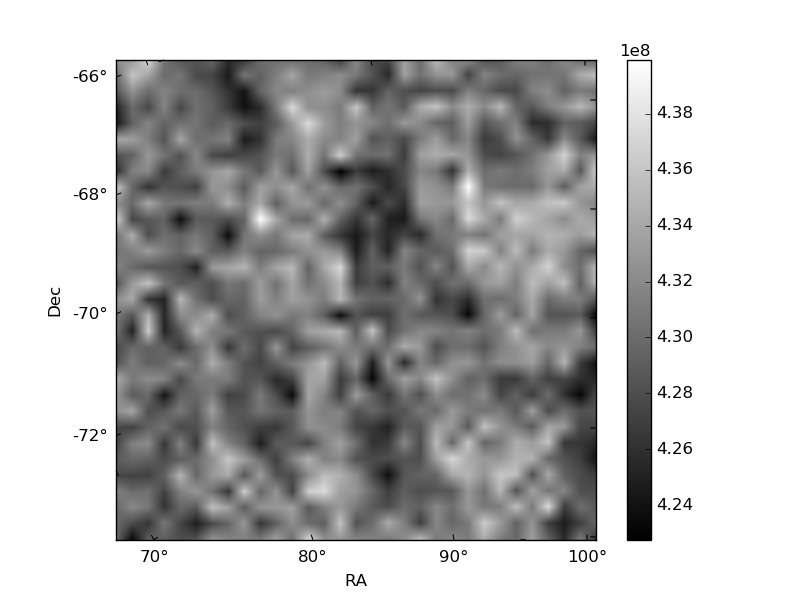
Histogram calculated using DETX and DETY for each event in the final _common_clean file
| Quadrant A | 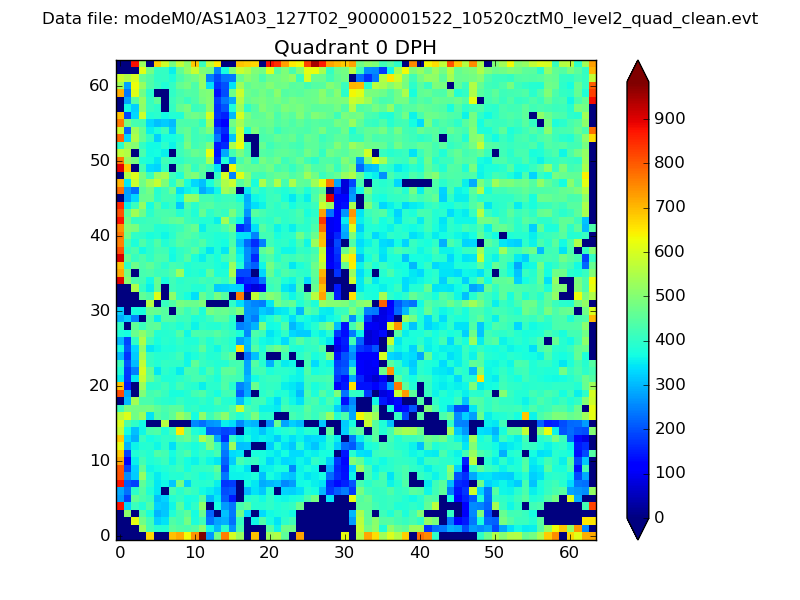 |
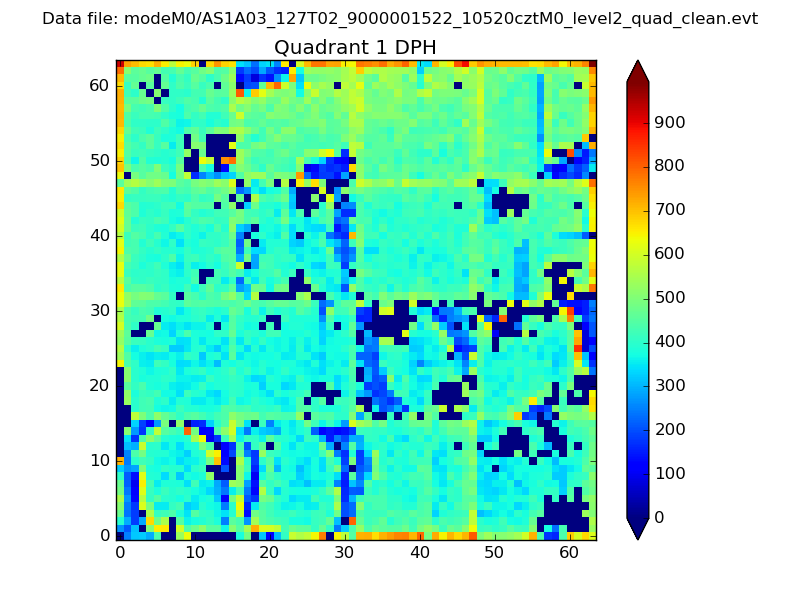 |
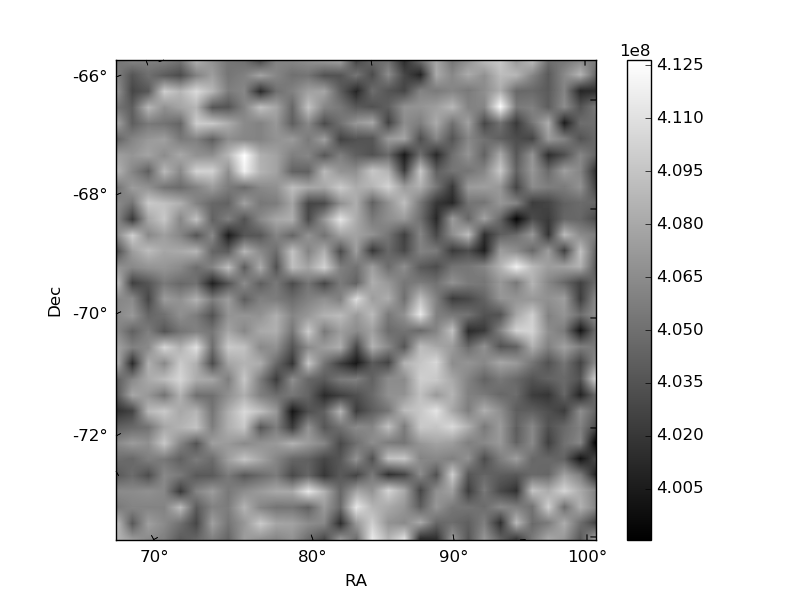
Quadrant B |
|---|---|---|---|
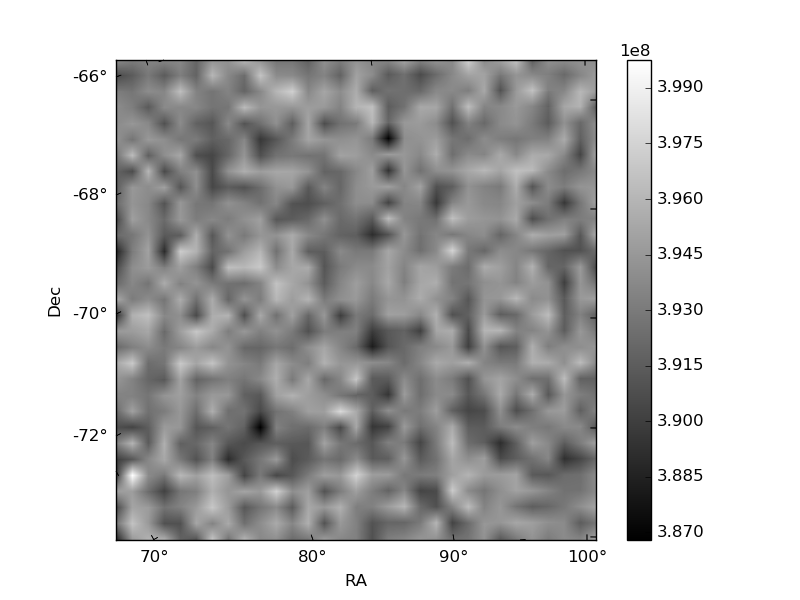
| Quadrant D | 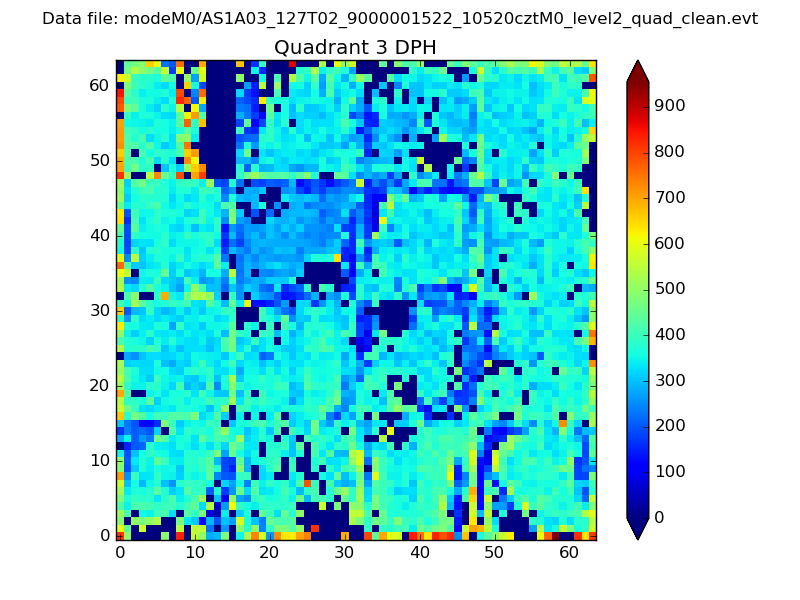 |
 |
Quadrant C |
| Plot type | Count rate plots | Images |
|---|---|---|
| Comparison with Poisson distribution Blue bars denote a histogram of data divided into 1 sec bins. Red curve is a Poisson curve with rate = median count rate of data. |
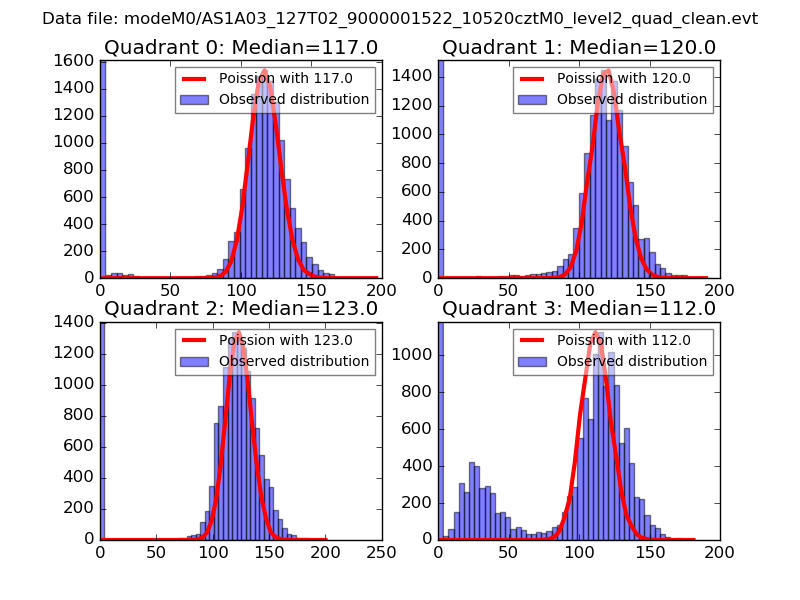 |
 |
| Quadrant-wise count rates Data is divided into 100 sec bins |
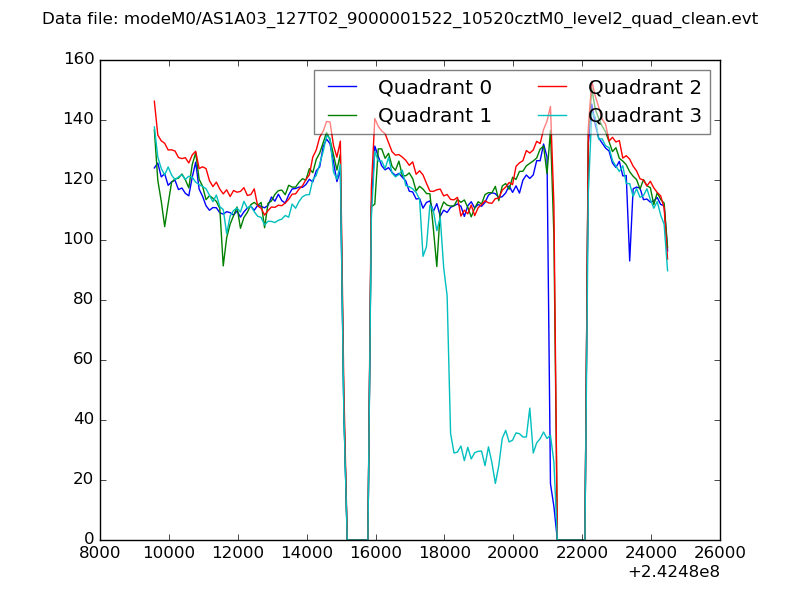 |
|
| Module-wise count rates for Quadrant A Data is divided into 100 sec bins |
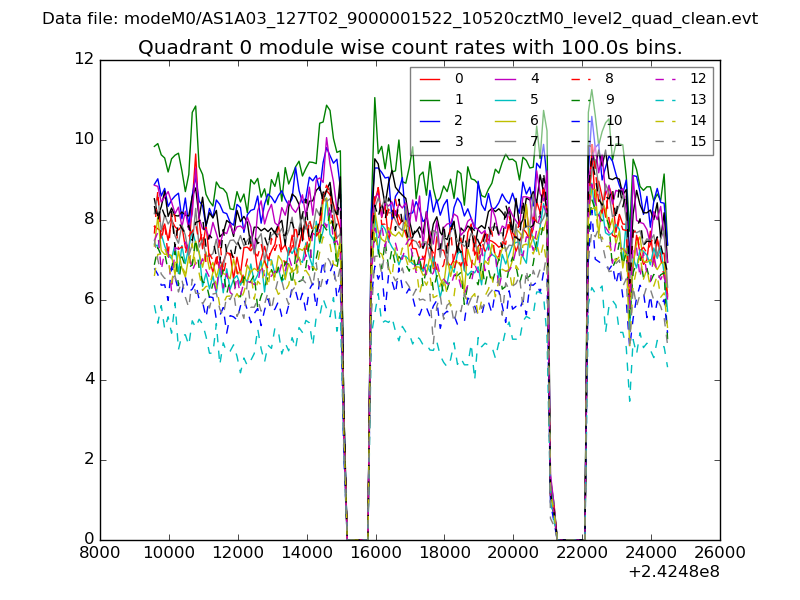 |
 |
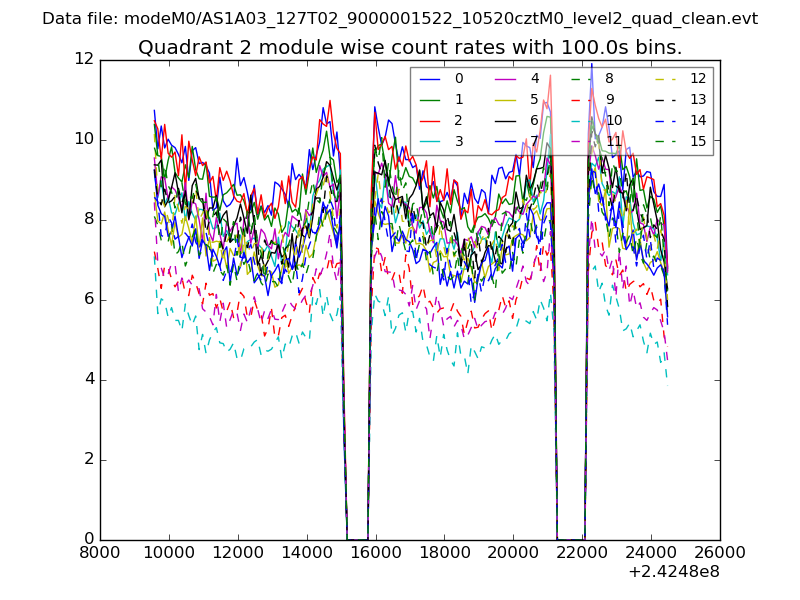
| Module-wise count rates for Quadrant B Data is divided into 100 sec bins |
 |
 |
| Module-wise count rates for Quadrant C Data is divided into 100 sec bins |
 |
 |
| Module-wise count rates for Quadrant D Data is divided into 100 sec bins |
 |
 |
| Parameter | Plot |
|---|---|
| CZT HV Monitor | 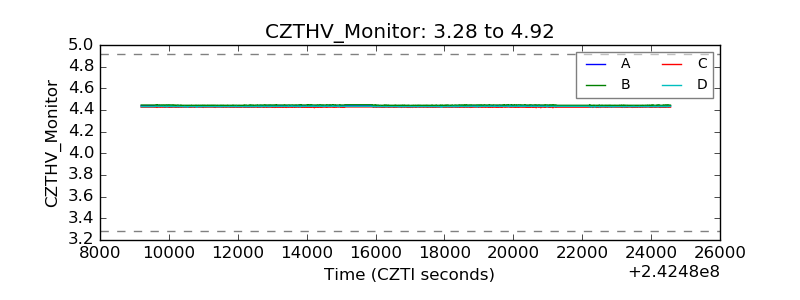 |
| D_VDD | 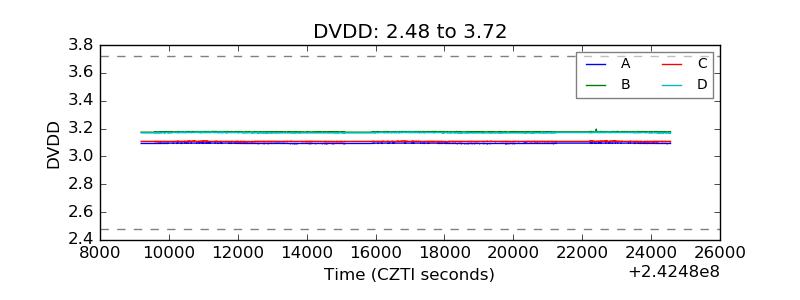 |
| Temperature 1 | 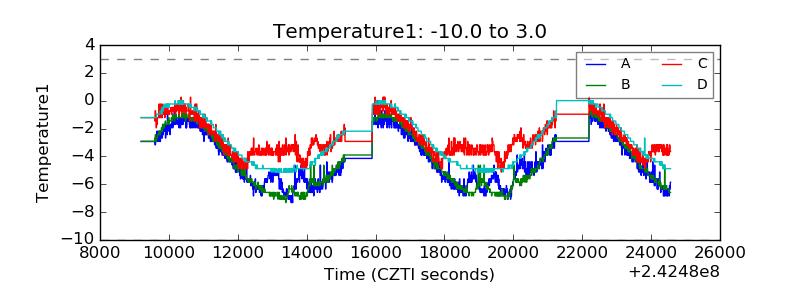 |
| Veto HV Monitor | 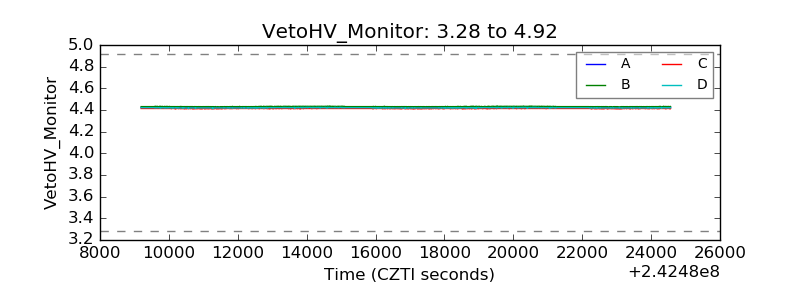 |
| Veto LLD |  |
| Alpha Counter | 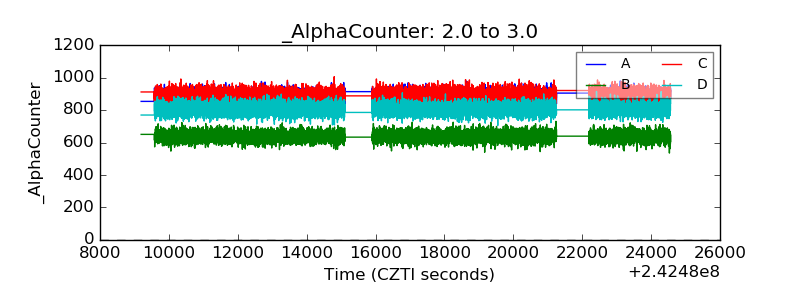 |
| _CPM_Rate | 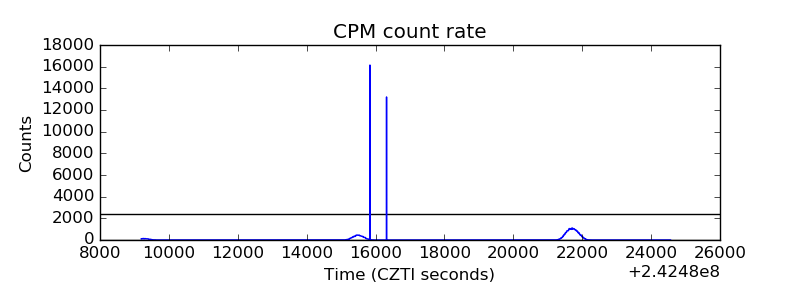 |
| CZT Counter | 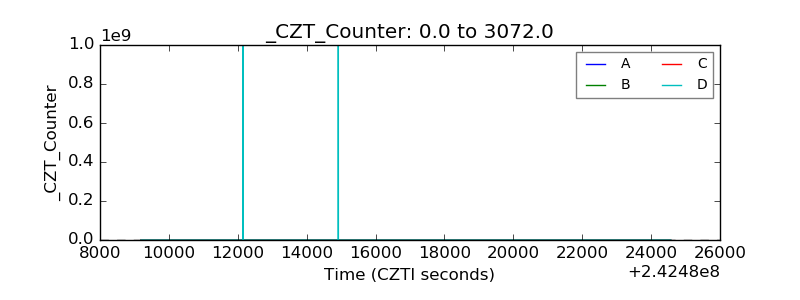 |
| +2.5 Volts monitor |  |
| +5 Volts monitor |  |
| _ROLL_ROT | 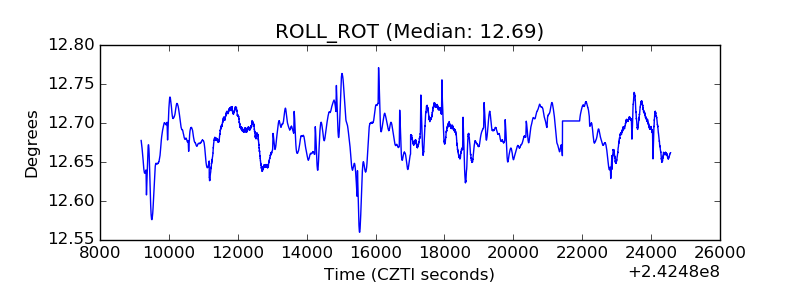 |
| _Roll_DEC | 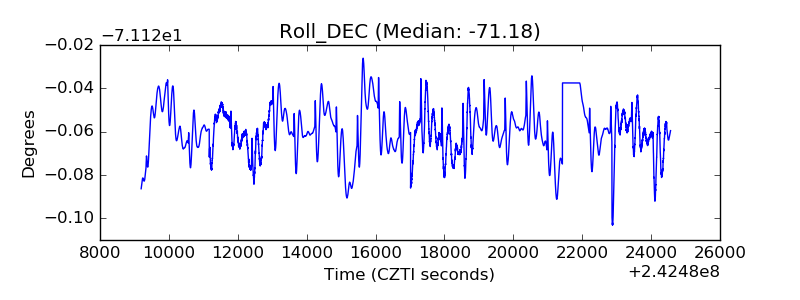 |
| _Roll_RA | 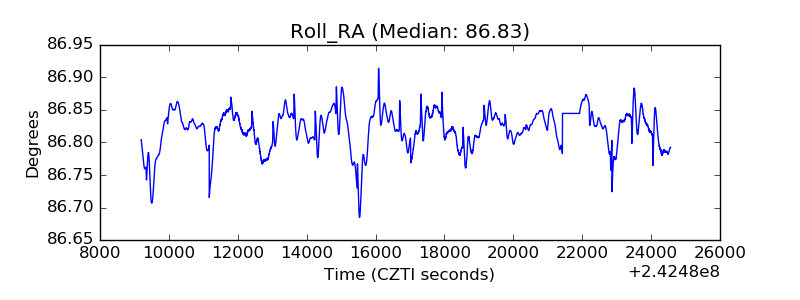 |
| Veto Counter |  |