| Param | Original file | Final file |
|---|---|---|
| Filename | modeM0/AS1A03_033T01_9000001524_10518cztM0_level2.evt | modeM0/AS1A03_033T01_9000001524_10518cztM0_level2_quad_clean.evt |
| Size (bytes) | 204,318,720 | 34,344,000 |
| Size | 194.9 MB | 32.8 MB |
| Events in quadrant A | 1,414,784 | 211,359 |
| Events in quadrant B | 1,723,283 | 216,840 |
| Events in quadrant C | 1,322,073 | 214,597 |
| Events in quadrant D | 1,541,285 | 202,587 |
| Mode M0 | |||
|---|---|---|---|
| Quadrant | BADHDUFLAG | Total packets | Discarded packets |
| A | 0 | 5872 | 2 |
| B | 0 | 6846 | 1 |
| C | 0 | 5721 | 1 |
| D | 0 | 6311 | 1 |
| Mode M9 | |||
|---|---|---|---|
| Quadrant | BADHDUFLAG | Total packets | Discarded packets |
| A | 0 | 10 | 0 |
| B | 0 | 10 | 0 |
| C | 0 | 10 | 0 |
| D | 0 | 10 | 0 |
| Mode SS | |||
|---|---|---|---|
| Quadrant | BADHDUFLAG | Total packets | Discarded packets |
| A | 0 | 56 | 0 |
| B | 0 | 56 | 0 |
| C | 0 | 56 | 0 |
| D | 0 | 56 | 0 |
| Quadrant | Total seconds | Saturated seconds | Saturation percentage |
|---|---|---|---|
| A | 2713 | 34 | 1.253225% |
| B | 2713 | 133 | 4.902322% |
| C | 2713 | 38 | 1.400663% |
| D | 2713 | 48 | 1.769259% |
Noise dominated data is calculated using 1-second bins in cleaned event files. If a bin has >2000 counts, and if more than 50% of those come from <1% of pixels, then it is considered to be noise-dominated and hence unusable.
| Quadrant | # 1 sec bins | Bins with >0 counts | Bins with >2000 counts | High rate bins dominated by noise | Noise dominated (total time) | Noise dominated (detector-on time) | Marked lightcurve |
|---|---|---|---|---|---|---|---|
| A | 3778 | 2714 | 8 | 8 | 0.21% | 0.29% | 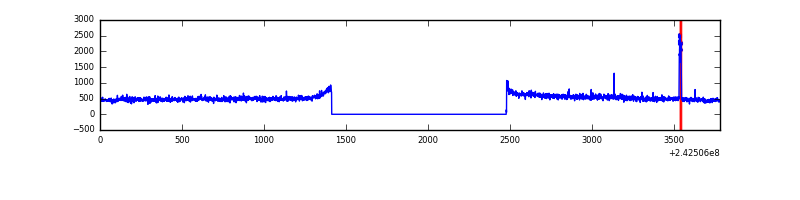 |
| B | 3778 | 2714 | 36 | 36 | 0.95% | 1.33% | 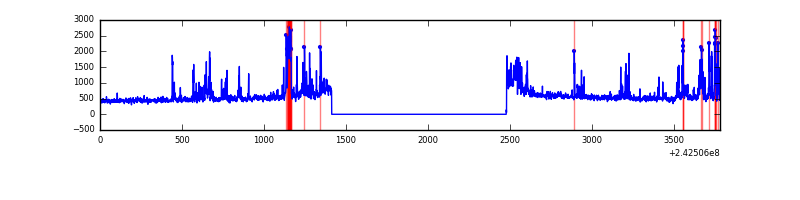 |
| C | 3778 | 2714 | 0 | 0 | 0.00% | 0.00% | 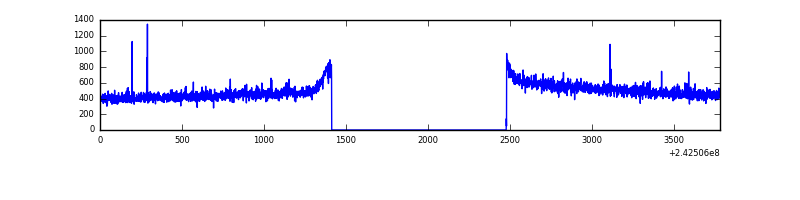 |
| D | 3778 | 2714 | 6 | 6 | 0.16% | 0.22% | 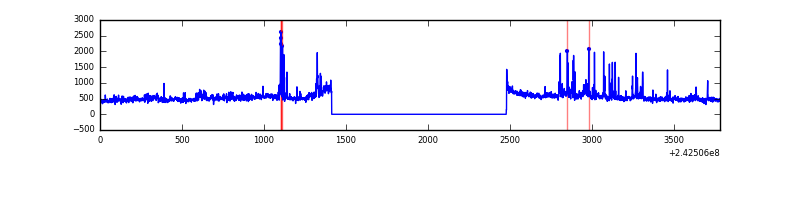 |
Top three noisy pixels from each quadrant. If the there are fewer than three noisy pixels in the level2.evt file, extra rows are filled as -1
| Pixel properties | Quadrant properties | ||||||
|---|---|---|---|---|---|---|---|
| Quadrant | DetID | PixID | Counts | Sigma | Mean | Median | Sigma |
| A | 13 | 251 | 58682 | 809.99 | 344 | 335 | 72.0 |
| A | 3 | 80 | 15450 | 209.83 | 344 | 335 | 72.0 |
| A | 11 | 29 | 6734 | 88.83 | 344 | 335 | 72.0 |
| B | 4 | 239 | 318289 | 4749.05 | 344 | 335 | 67.0 |
| B | 0 | 214 | 30957 | 457.38 | 344 | 335 | 67.0 |
| B | 4 | 81 | 9482 | 136.62 | 344 | 335 | 67.0 |
| C | 14 | 234 | 4759 | 56.35 | 337 | 337 | 78.5 |
| C | 13 | 61 | 2604 | 28.89 | 337 | 337 | 78.5 |
| C | 8 | 222 | 837 | 6.37 | 337 | 337 | 78.5 |
| D | 2 | 16 | 95996 | 1185.55 | 335 | 325 | 80.7 |
| D | 8 | 195 | 88220 | 1089.19 | 335 | 325 | 80.7 |
| D | 13 | 104 | 32991 | 404.79 | 335 | 325 | 80.7 |
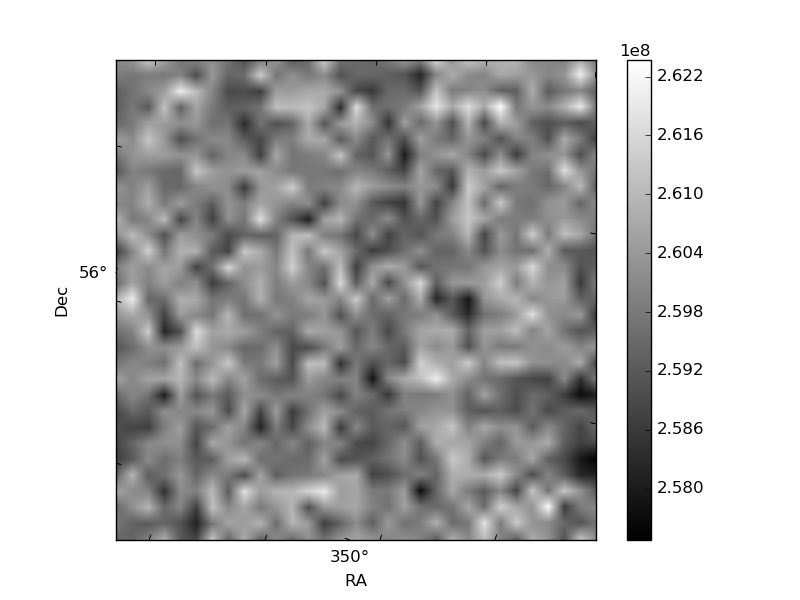
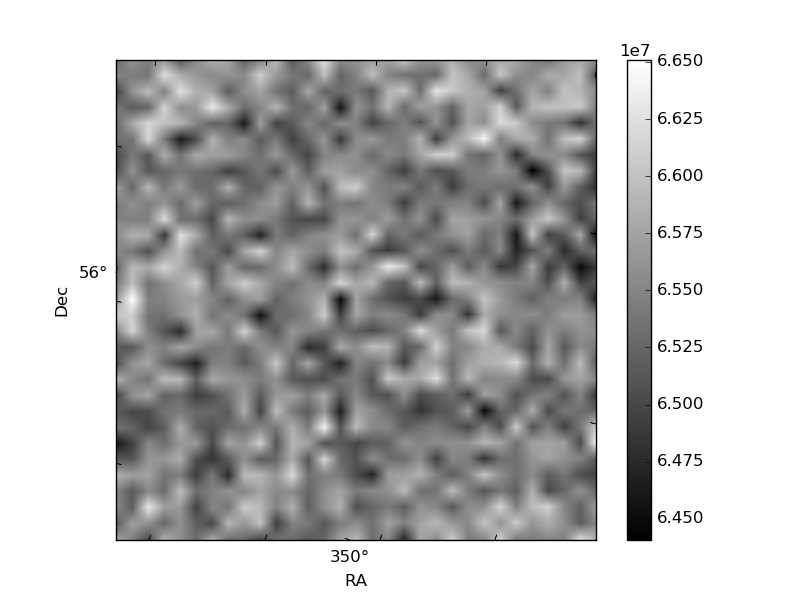
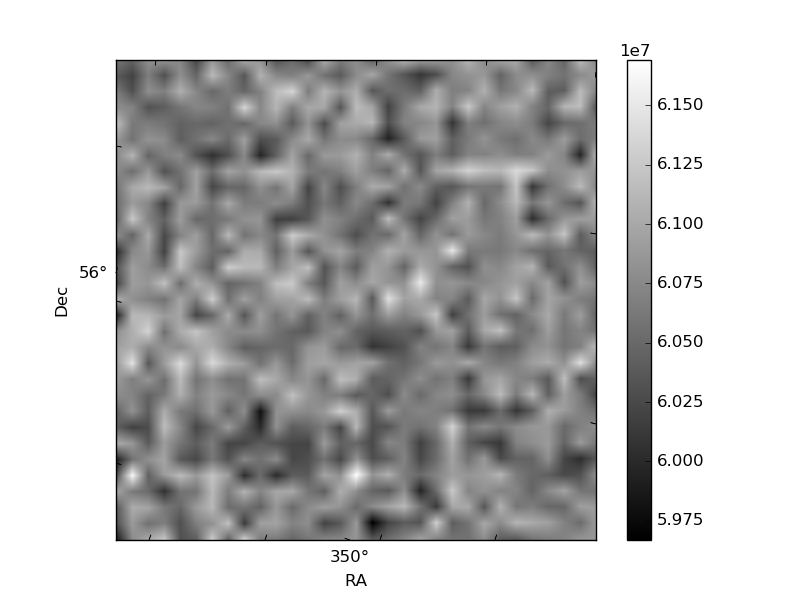
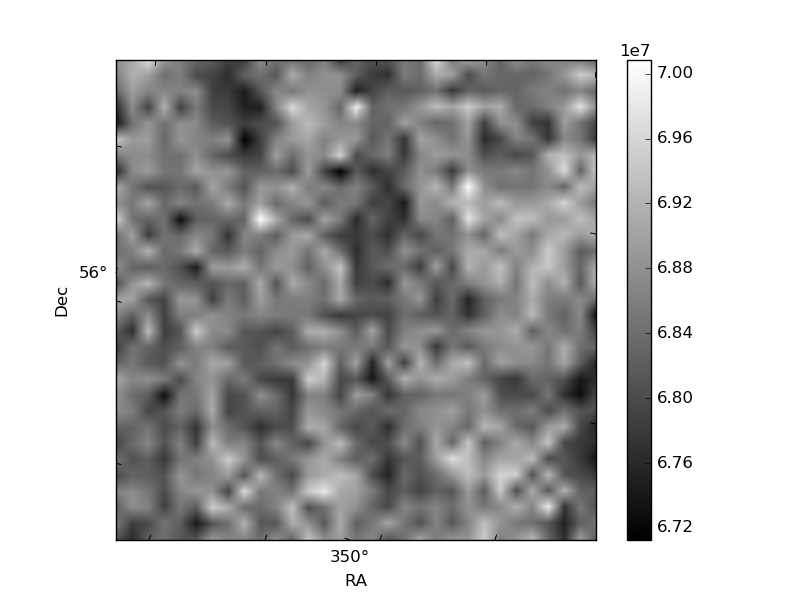
Histogram calculated using DETX and DETY for each event in the final _common_clean file
| Quadrant A | 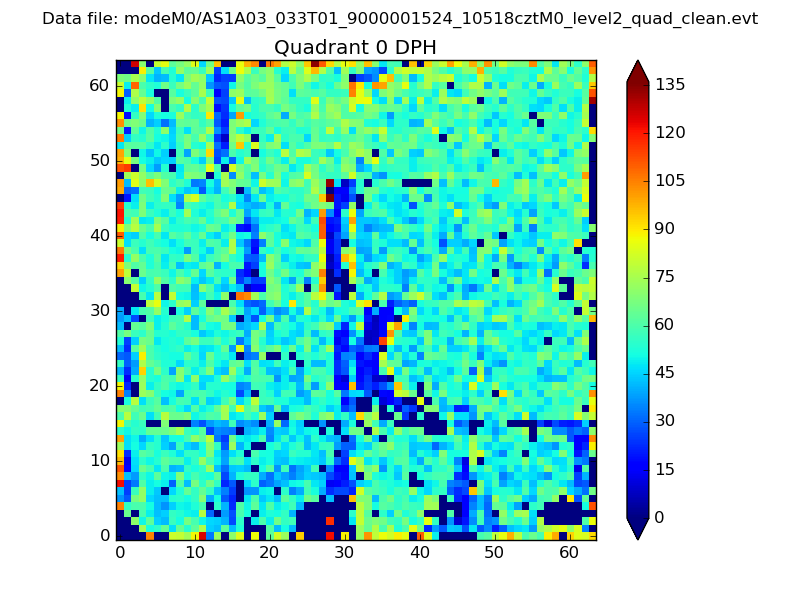 |
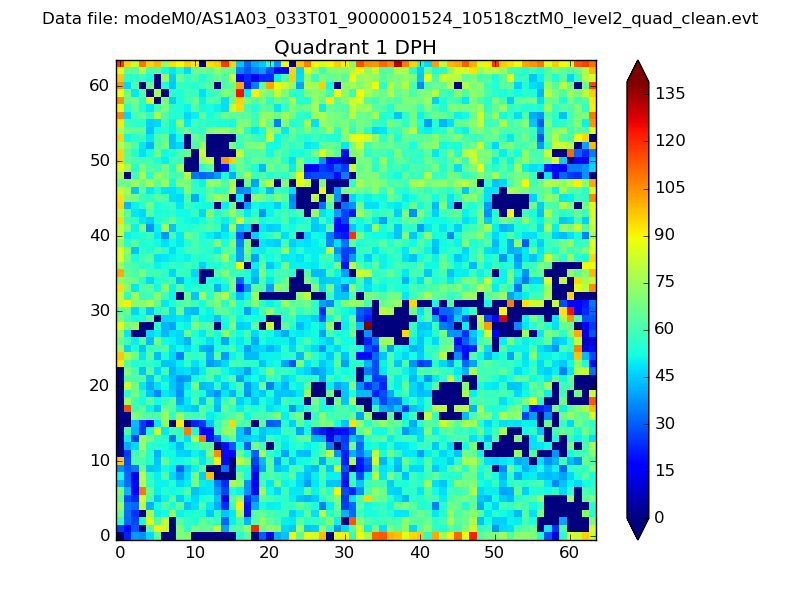 |
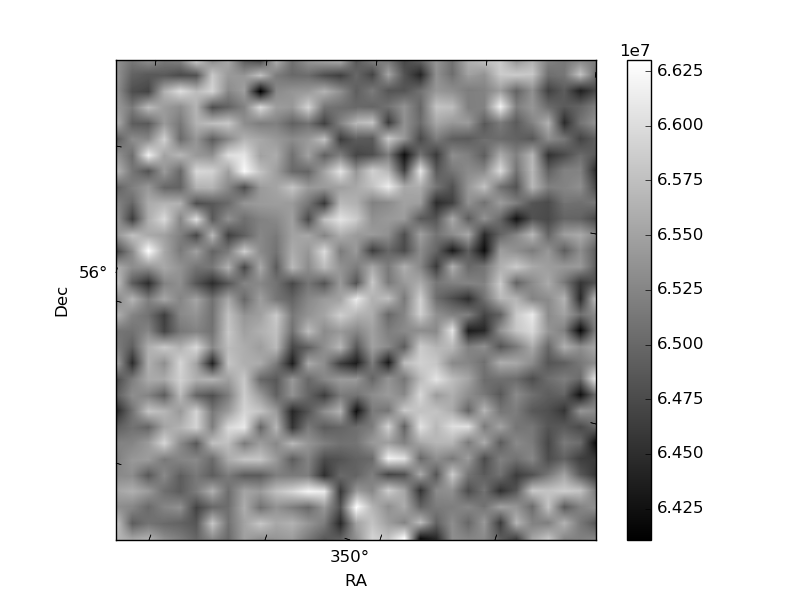
Quadrant B |
|---|---|---|---|
| Quadrant D | 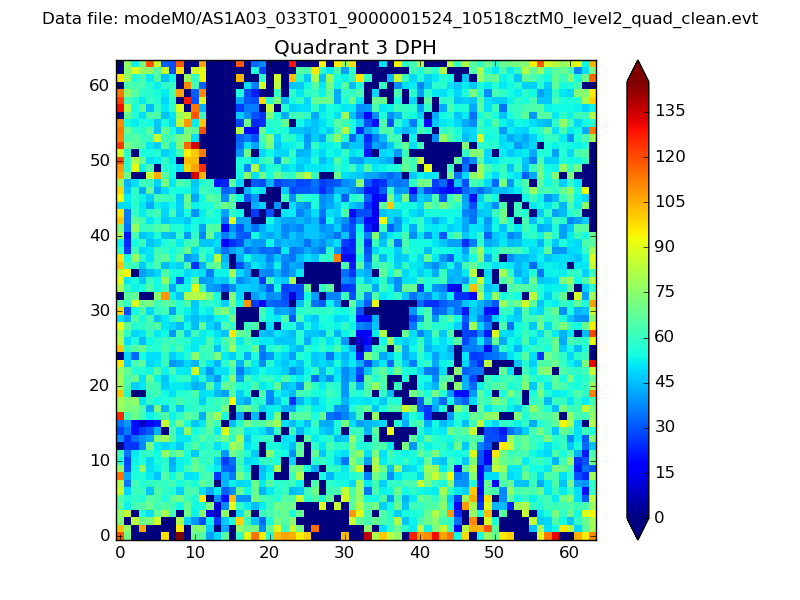 |
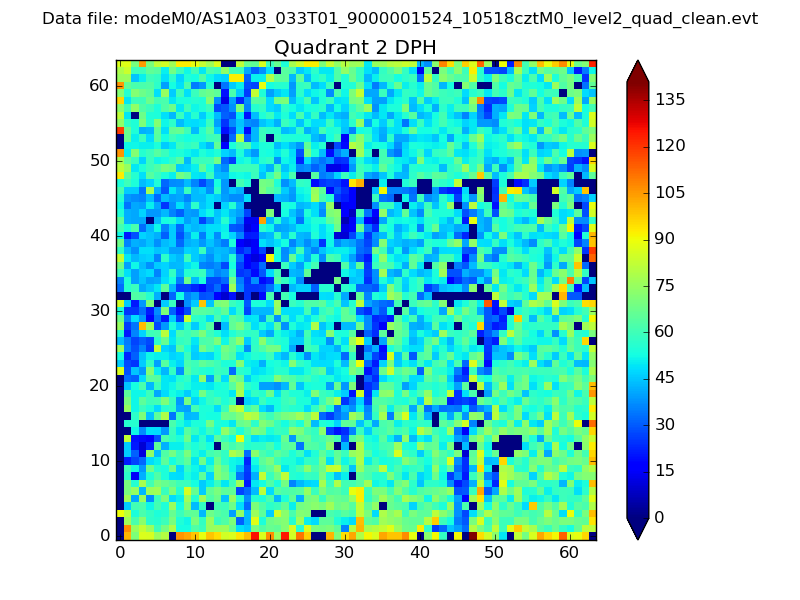 |
Quadrant C |
| Plot type | Count rate plots | Images |
|---|---|---|
| Comparison with Poisson distribution Blue bars denote a histogram of data divided into 1 sec bins. Red curve is a Poisson curve with rate = median count rate of data. |
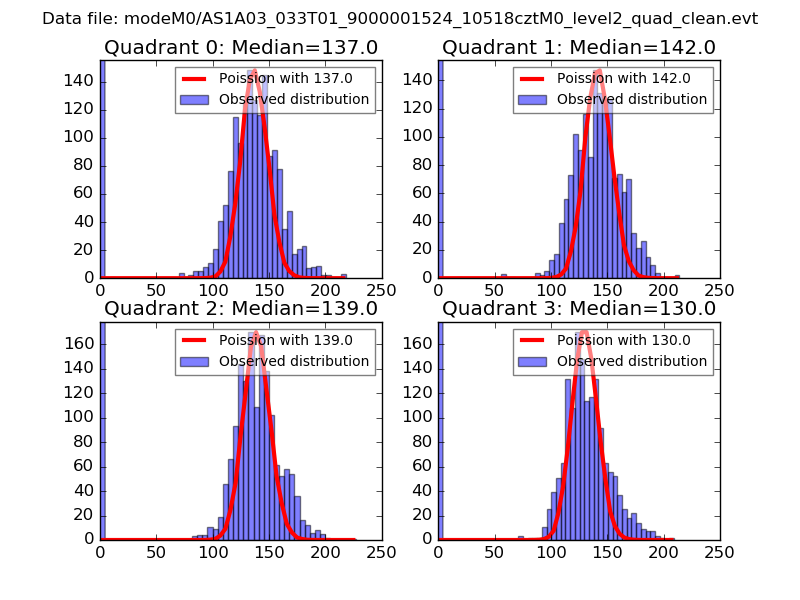 |
 |
| Quadrant-wise count rates Data is divided into 100 sec bins |
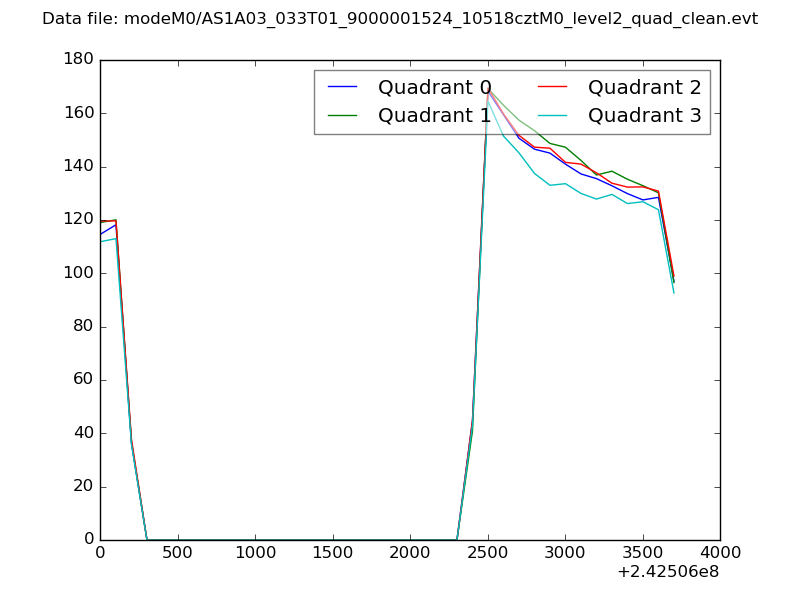 |
|
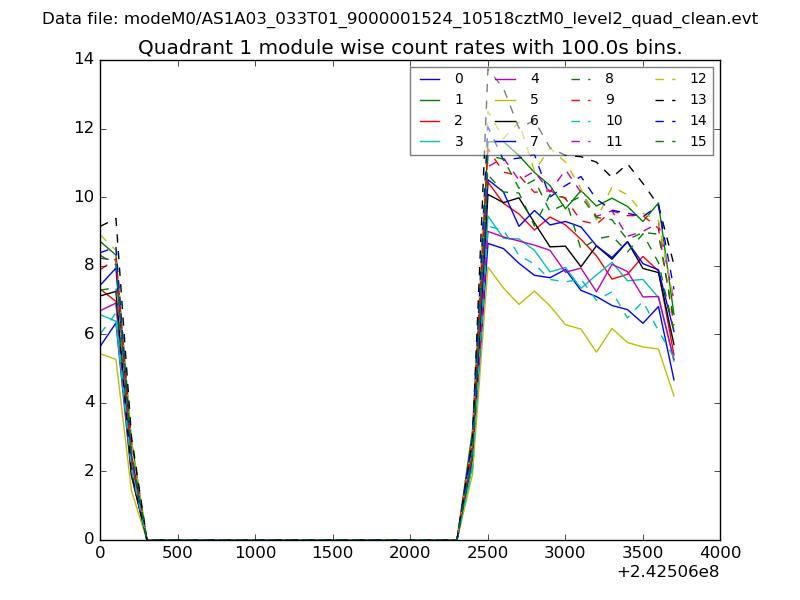
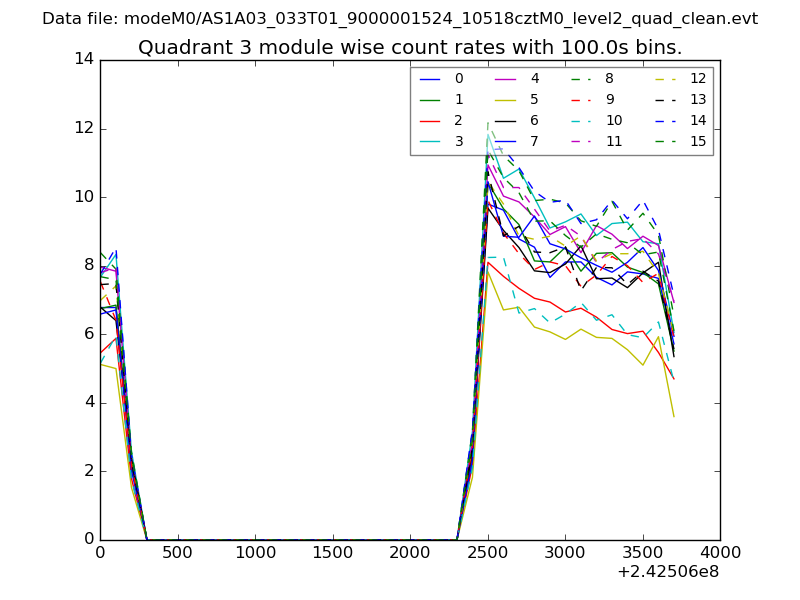
| Module-wise count rates for Quadrant A Data is divided into 100 sec bins |
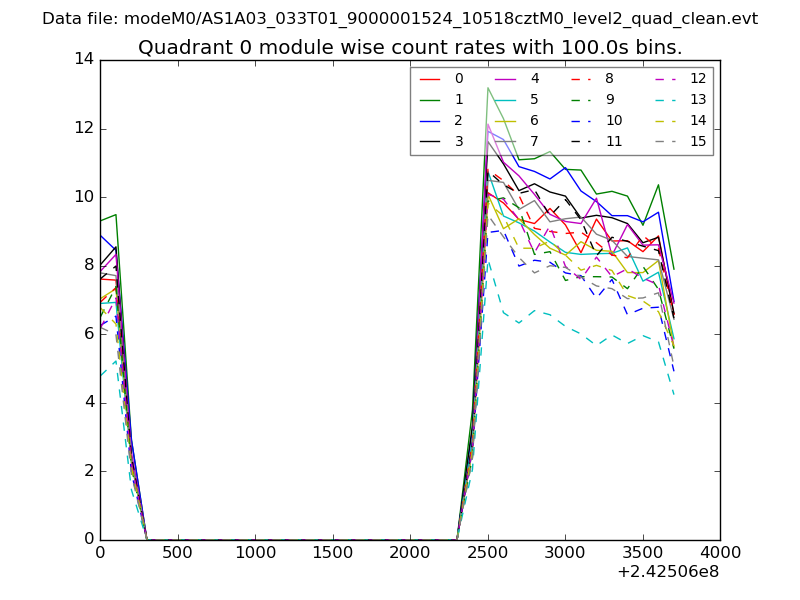 |
 |
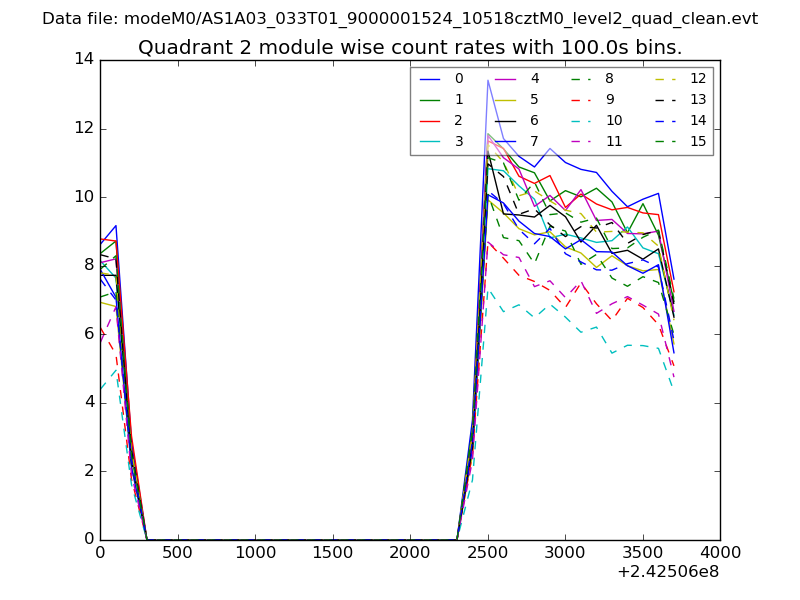
| Module-wise count rates for Quadrant B Data is divided into 100 sec bins |
 |
 |
| Module-wise count rates for Quadrant C Data is divided into 100 sec bins |
 |
 |
| Module-wise count rates for Quadrant D Data is divided into 100 sec bins |
 |
 |
| Parameter | Plot |
|---|---|
| CZT HV Monitor | 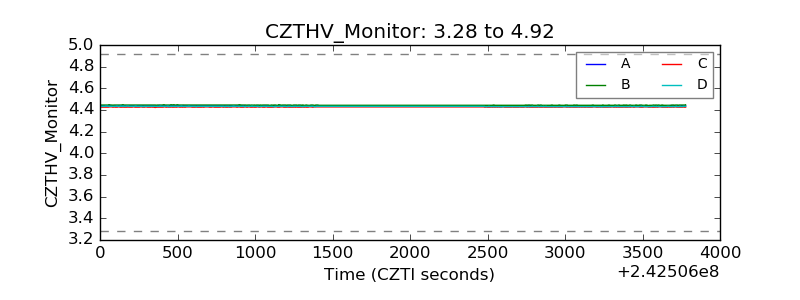 |
| D_VDD | 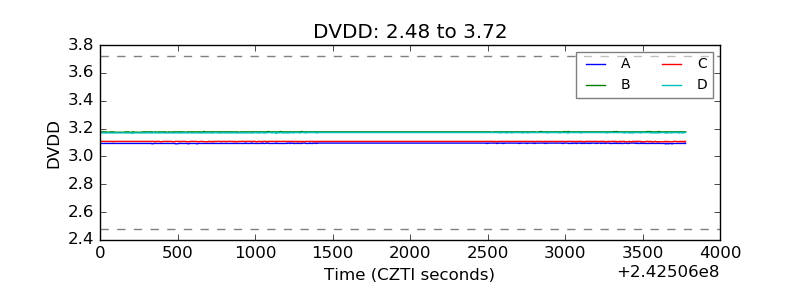 |
| Temperature 1 | 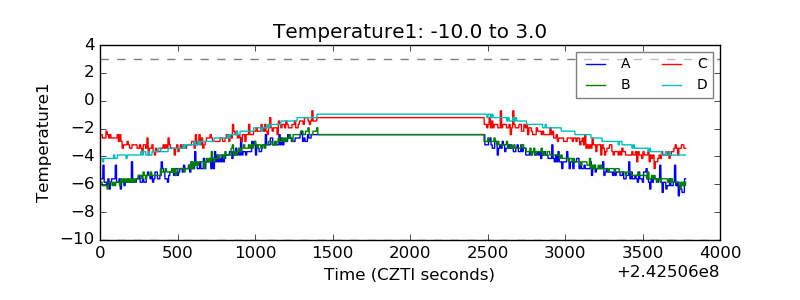 |
| Veto HV Monitor | 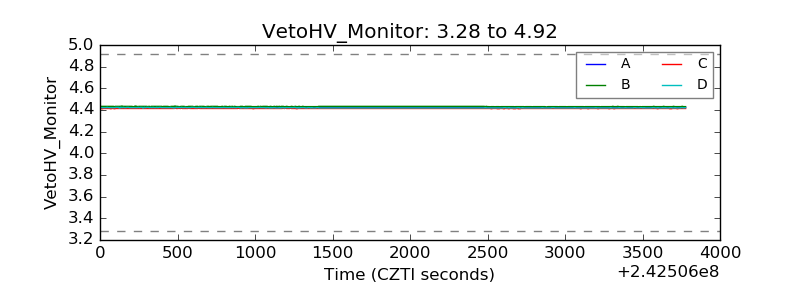 |
| Veto LLD | 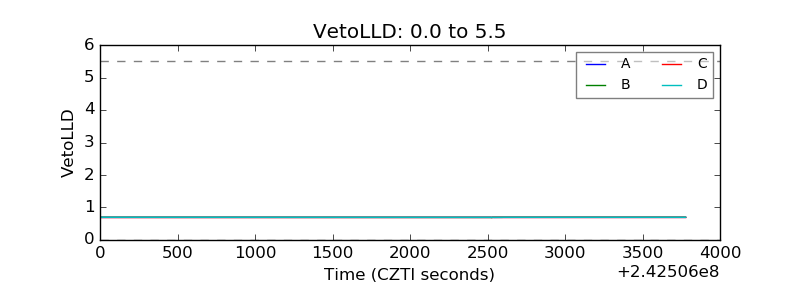 |
| Alpha Counter | 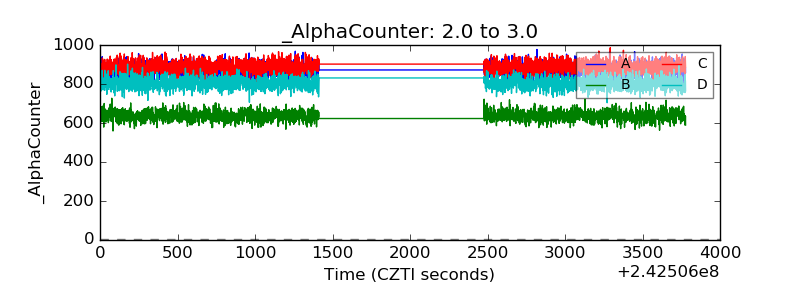 |
| _CPM_Rate | 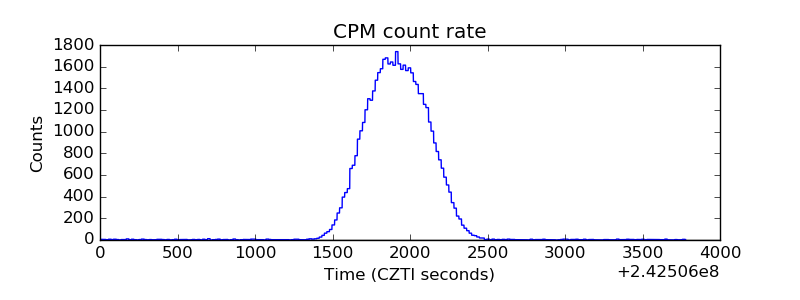 |
| CZT Counter | 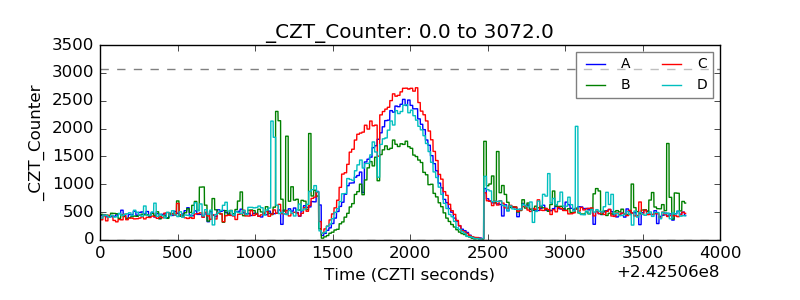 |
| +2.5 Volts monitor |  |
| +5 Volts monitor |  |
| _ROLL_ROT | 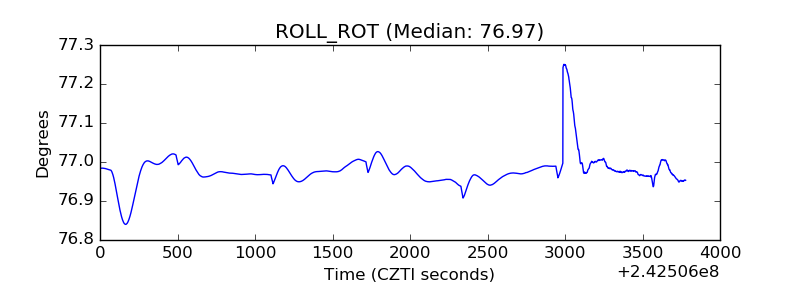 |
| _Roll_DEC | 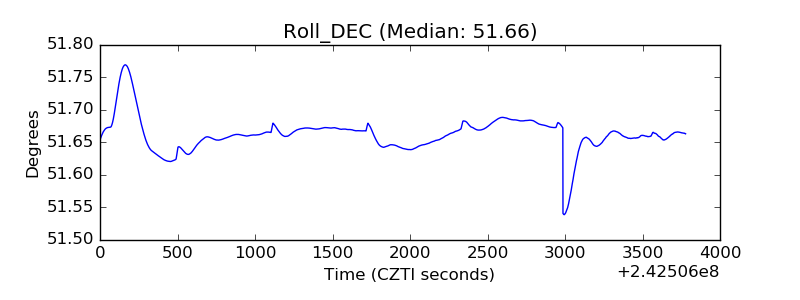 |
| _Roll_RA | 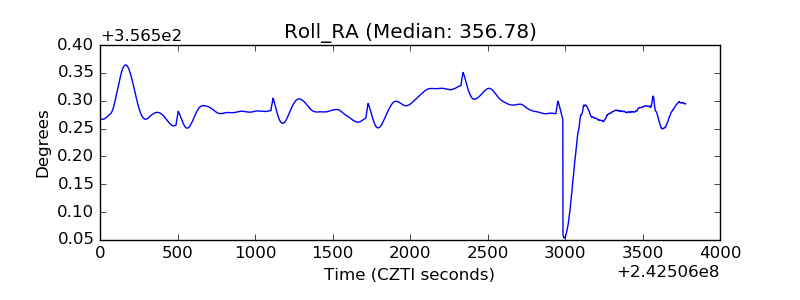 |
| Veto Counter | 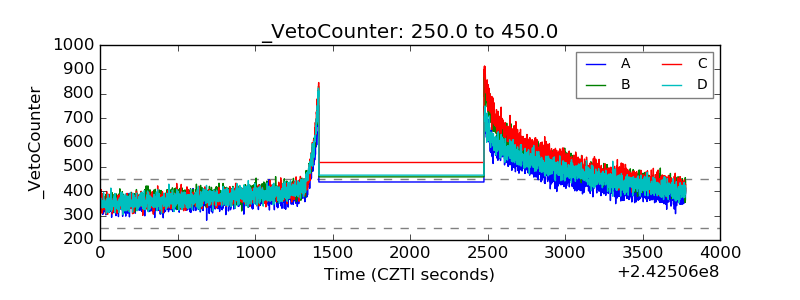 |