| Param | Original file | Final file |
|---|---|---|
| Filename | modeM0/AS1A03_033T01_9000001524_10521cztM0_level2.evt | modeM0/AS1A03_033T01_9000001524_10521cztM0_level2_quad_clean.evt |
| Size (bytes) | 298,123,200 | 68,567,040 |
| Size | 284.3 MB | 65.4 MB |
| Events in quadrant A | 2,270,213 | 470,211 |
| Events in quadrant B | 1,760,742 | 372,454 |
| Events in quadrant C | 2,233,297 | 485,651 |
| Events in quadrant D | 2,445,936 | 421,311 |
| Mode M0 | |||
|---|---|---|---|
| Quadrant | BADHDUFLAG | Total packets | Discarded packets |
| A | 0 | 24905 | 15003 |
| B | 0 | 30736 | 23206 |
| C | 0 | 25808 | 15880 |
| D | 0 | 28357 | 18291 |
| Mode M9 | |||
|---|---|---|---|
| Quadrant | BADHDUFLAG | Total packets | Discarded packets |
| A | 0 | 32 | 11 |
| B | 0 | 34 | 13 |
| C | 0 | 34 | 13 |
| D | 0 | 31 | 9 |
| Mode SS | |||
|---|---|---|---|
| Quadrant | BADHDUFLAG | Total packets | Discarded packets |
| A | 0 | 254 | 136 |
| B | 0 | 254 | 138 |
| C | 0 | 254 | 136 |
| D | 0 | 242 | 126 |
| Quadrant | Total seconds | Saturated seconds | Saturation percentage |
|---|---|---|---|
| A | 4907 | 3 | 0.061137% |
| B | 3714 | 5 | 0.134626% |
| C | 4915 | 9 | 0.183113% |
| D | 4842 | 3 | 0.061958% |
Noise dominated data is calculated using 1-second bins in cleaned event files. If a bin has >2000 counts, and if more than 50% of those come from <1% of pixels, then it is considered to be noise-dominated and hence unusable.
| Quadrant | # 1 sec bins | Bins with >0 counts | Bins with >2000 counts | High rate bins dominated by noise | Noise dominated (total time) | Noise dominated (detector-on time) | Marked lightcurve |
|---|---|---|---|---|---|---|---|
| A | 7567 | 5819 | 0 | 0 | 0.00% | 0.00% |  |
| B | 7566 | 4594 | 0 | 0 | 0.00% | 0.00% | 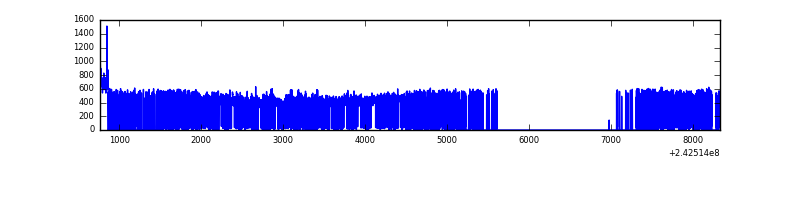 |
| C | 7567 | 5832 | 1 | 1 | 0.01% | 0.02% | 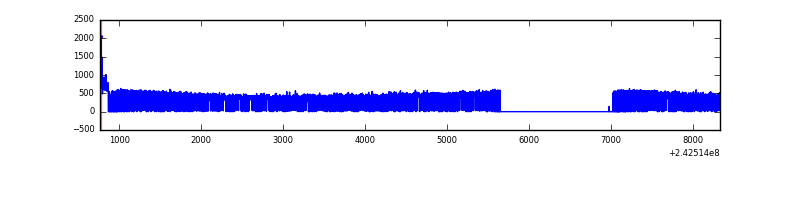 |
| D | 7566 | 5313 | 0 | 0 | 0.00% | 0.00% | 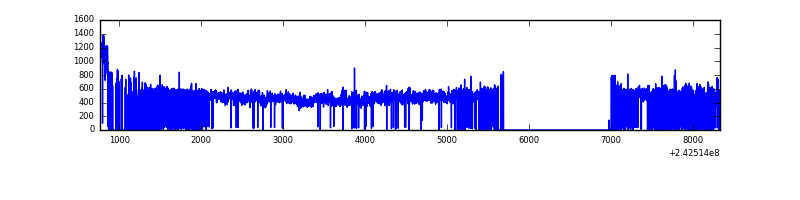 |
Top three noisy pixels from each quadrant. If the there are fewer than three noisy pixels in the level2.evt file, extra rows are filled as -1
| Pixel properties | Quadrant properties | ||||||
|---|---|---|---|---|---|---|---|
| Quadrant | DetID | PixID | Counts | Sigma | Mean | Median | Sigma |
| A | 3 | 80 | 30492 | 261.66 | 570 | 559 | 114.4 |
| A | 13 | 251 | 18319 | 155.25 | 570 | 559 | 114.4 |
| A | 15 | 239 | 11429 | 95.02 | 570 | 559 | 114.4 |
| B | 4 | 239 | 36088 | 444.94 | 427 | 418 | 80.2 |
| B | 0 | 214 | 25115 | 308.07 | 427 | 418 | 80.2 |
| B | 11 | 51 | 18971 | 231.43 | 427 | 418 | 80.2 |
| C | 14 | 234 | 8577 | 61.11 | 568 | 571 | 131.0 |
| C | 1 | 3 | 4231 | 27.94 | 568 | 571 | 131.0 |
| C | 13 | 61 | 4129 | 27.16 | 568 | 571 | 131.0 |
| D | 8 | 195 | 308291 | 2427.54 | 535 | 521 | 126.8 |
| D | 2 | 16 | 72037 | 564.08 | 535 | 521 | 126.8 |
| D | 2 | 234 | 16849 | 128.79 | 535 | 521 | 126.8 |
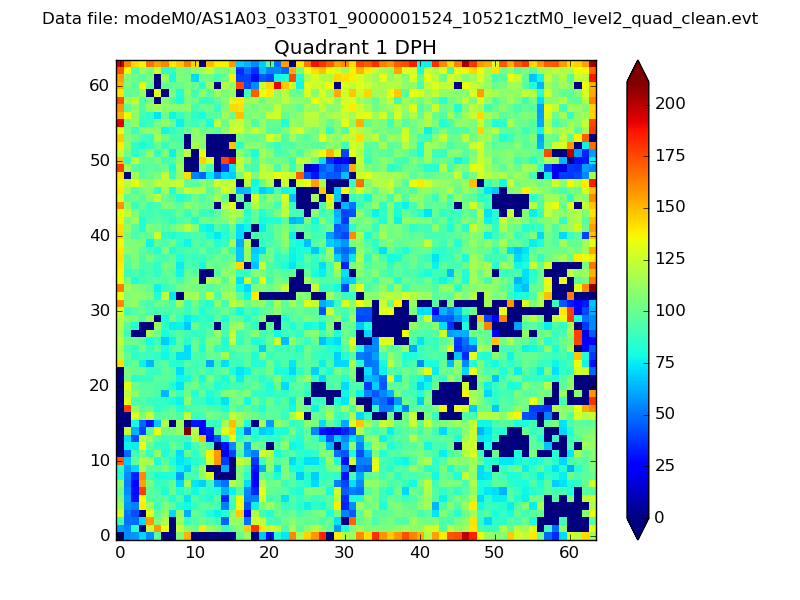
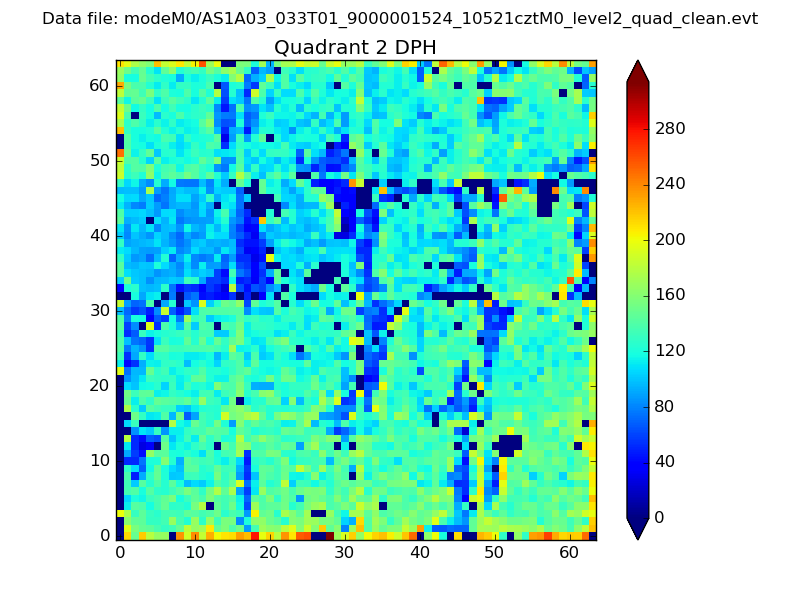
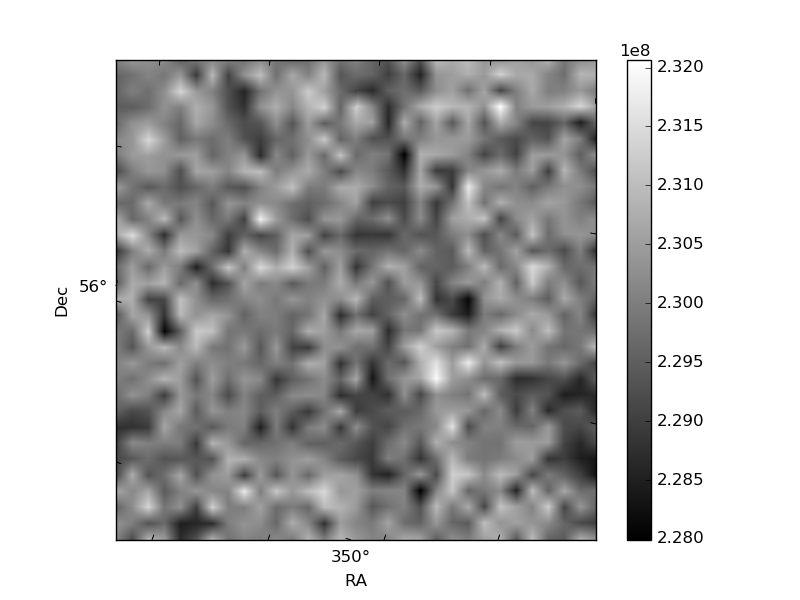
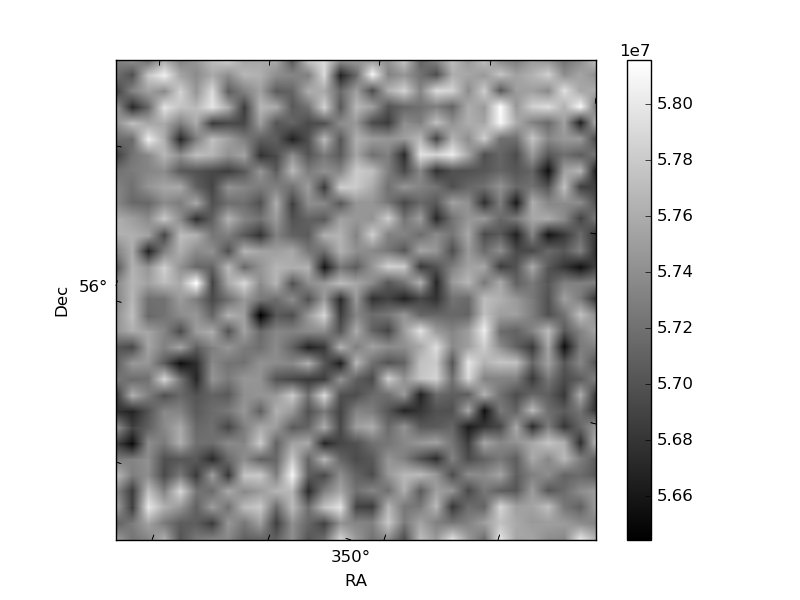
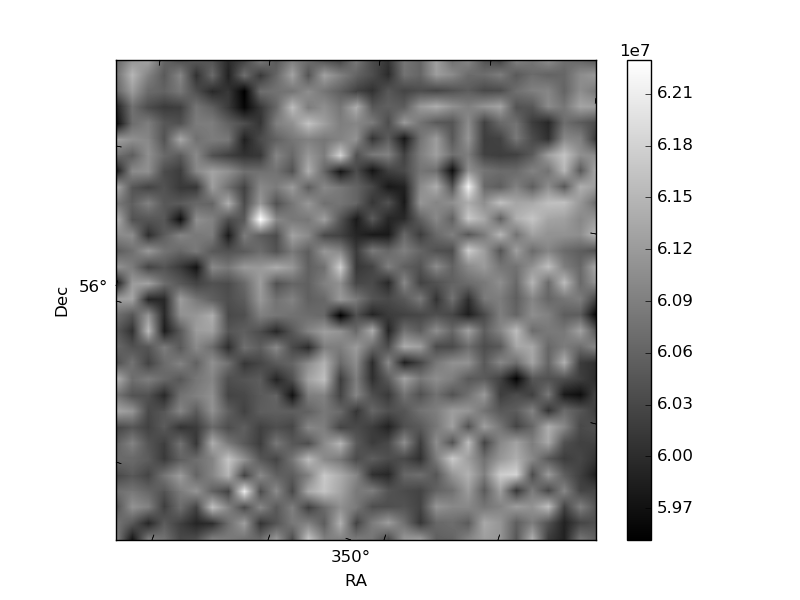
Histogram calculated using DETX and DETY for each event in the final _common_clean file
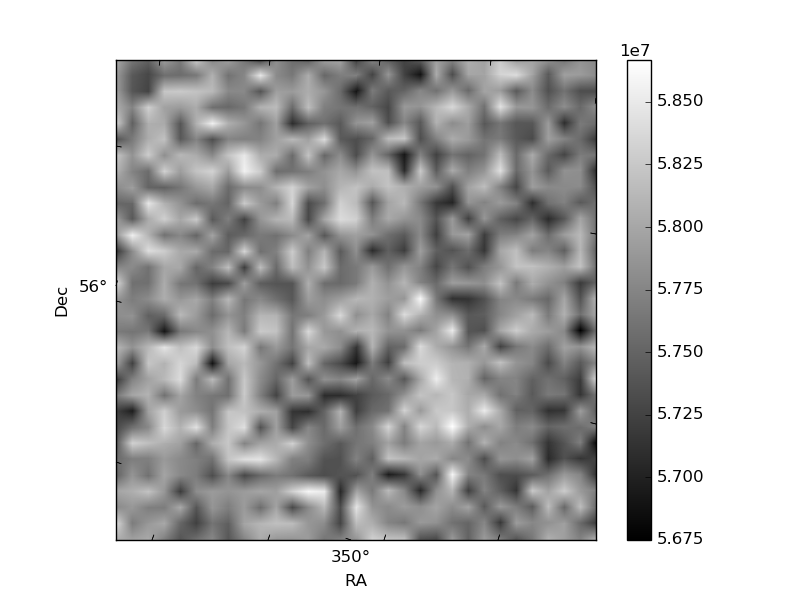
| Quadrant A | 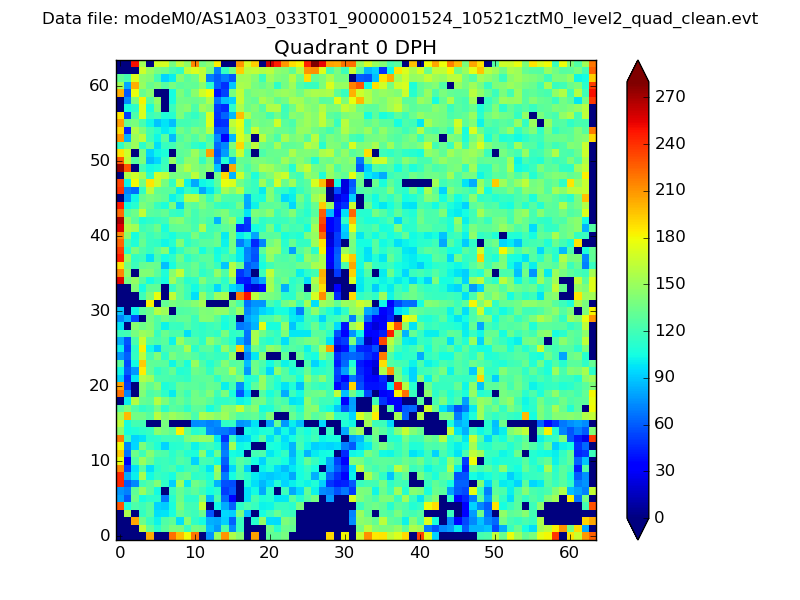 |
 |
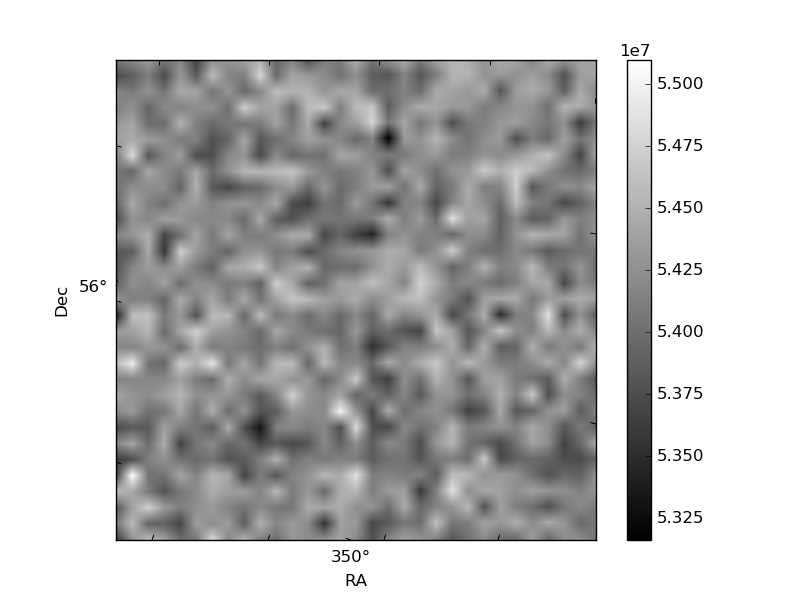
Quadrant B |
|---|---|---|---|
| Quadrant D | 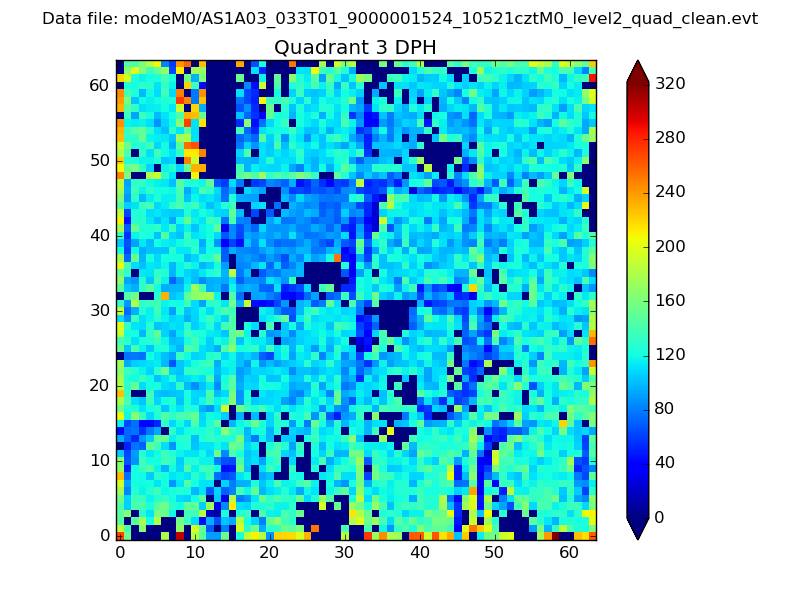 |
 |
Quadrant C |
| Plot type | Count rate plots | Images |
|---|---|---|
| Comparison with Poisson distribution Blue bars denote a histogram of data divided into 1 sec bins. Red curve is a Poisson curve with rate = median count rate of data. |
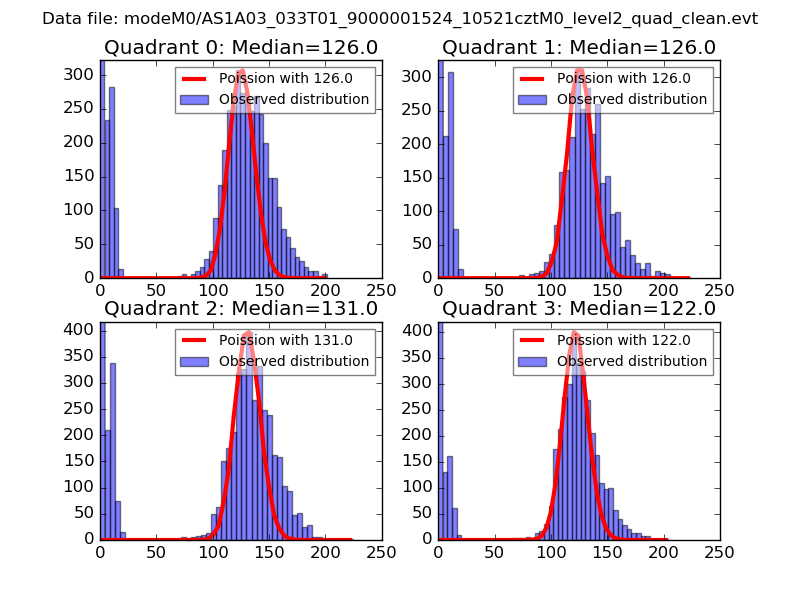 |
 |
| Quadrant-wise count rates Data is divided into 100 sec bins |
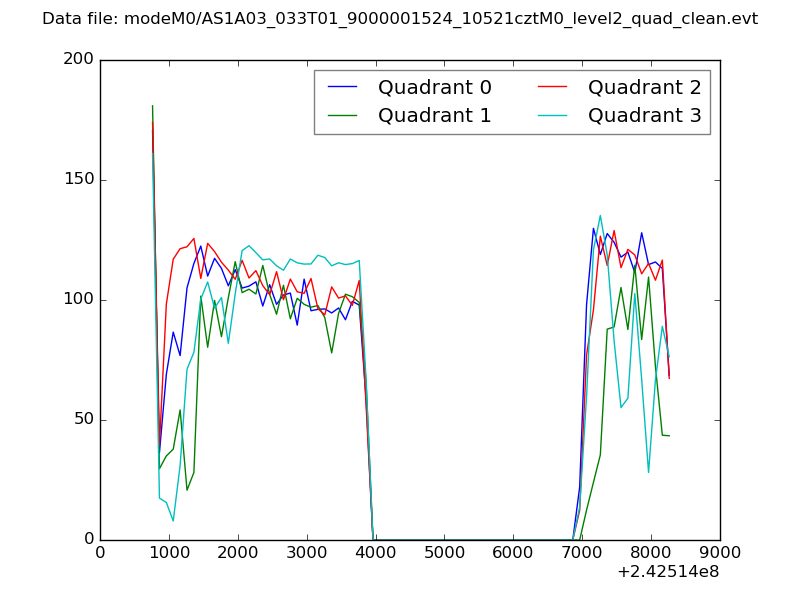 |
|
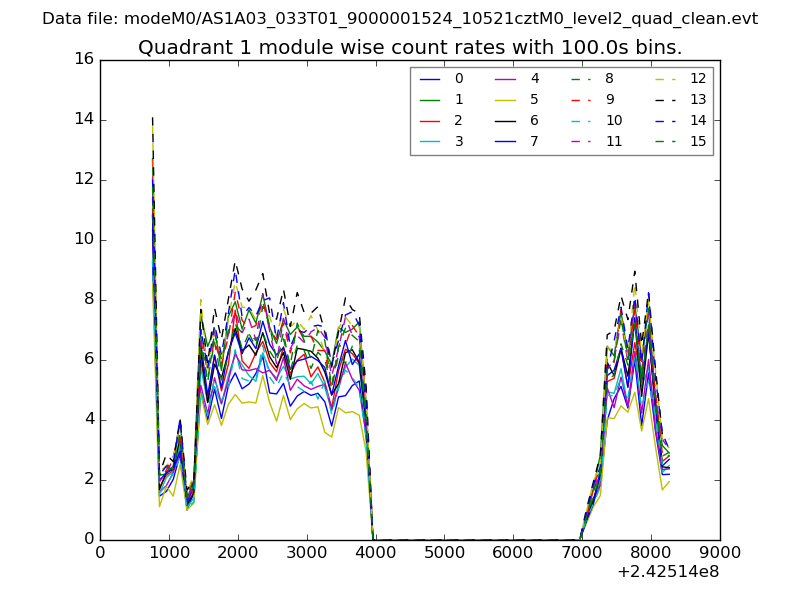
| Module-wise count rates for Quadrant A Data is divided into 100 sec bins |
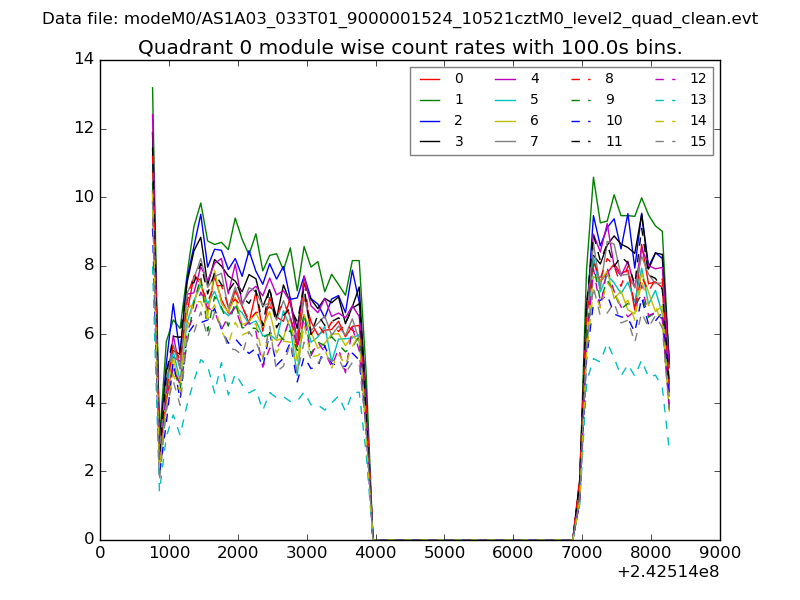 |
 |
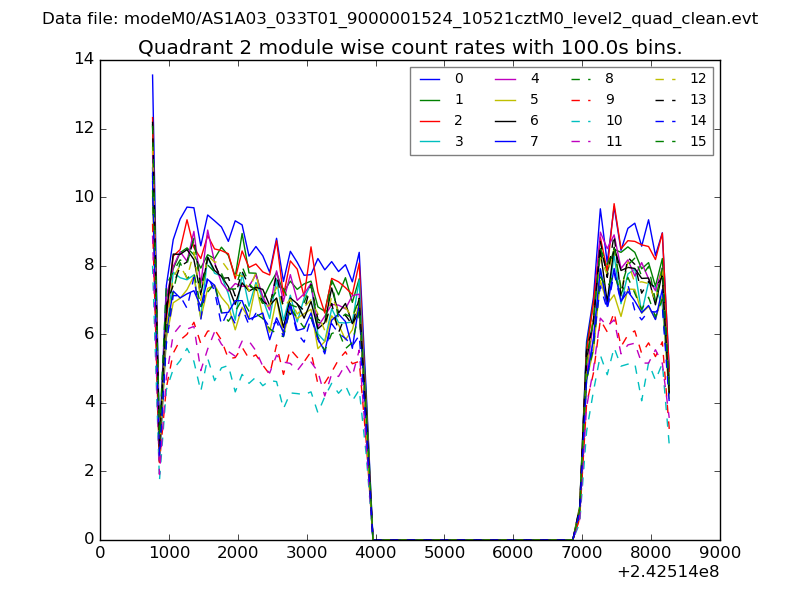
| Module-wise count rates for Quadrant B Data is divided into 100 sec bins |
 |
 |
| Module-wise count rates for Quadrant C Data is divided into 100 sec bins |
 |
 |
| Module-wise count rates for Quadrant D Data is divided into 100 sec bins |
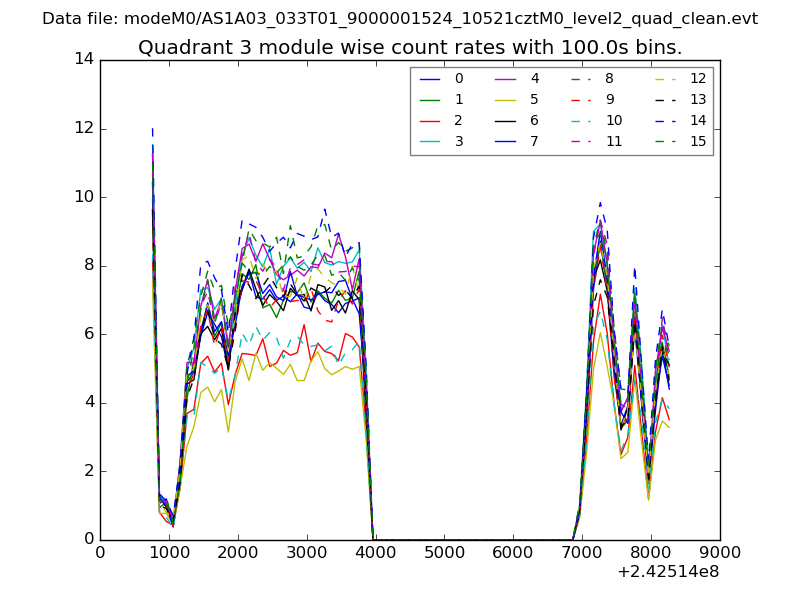 |
 |
| Parameter | Plot |
|---|---|
| CZT HV Monitor | 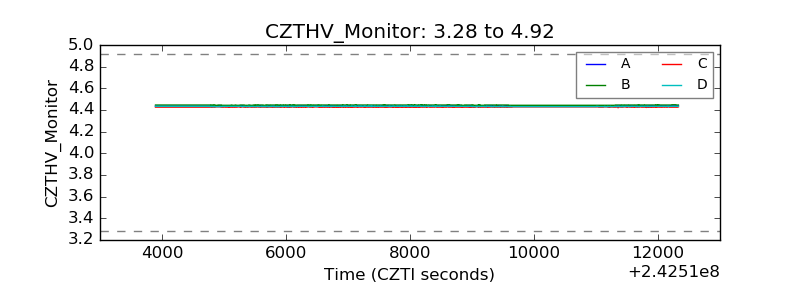 |
| D_VDD | 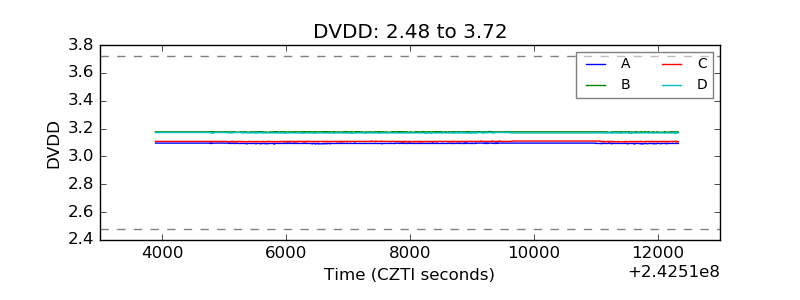 |
| Temperature 1 | 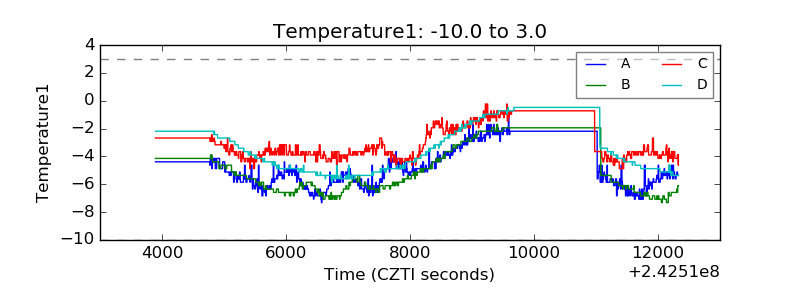 |
| Veto HV Monitor | 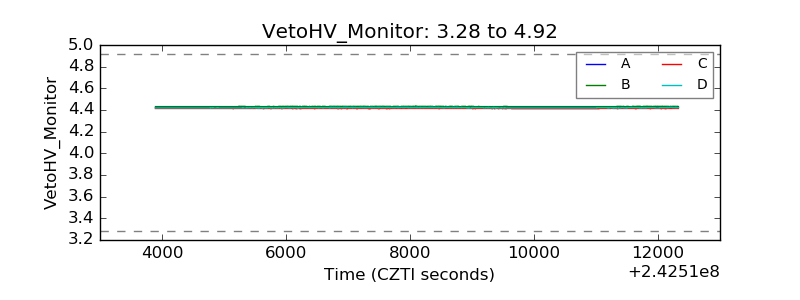 |
| Veto LLD | 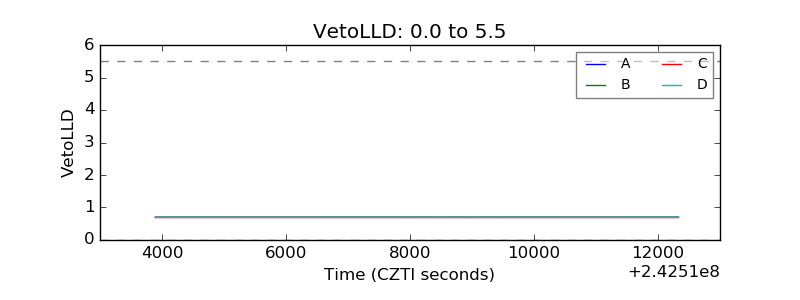 |
| Alpha Counter | 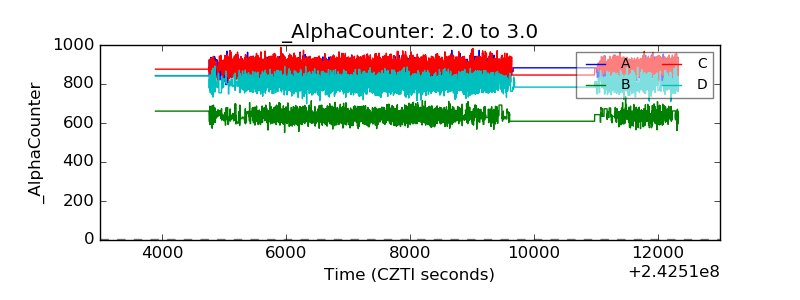 |
| _CPM_Rate | 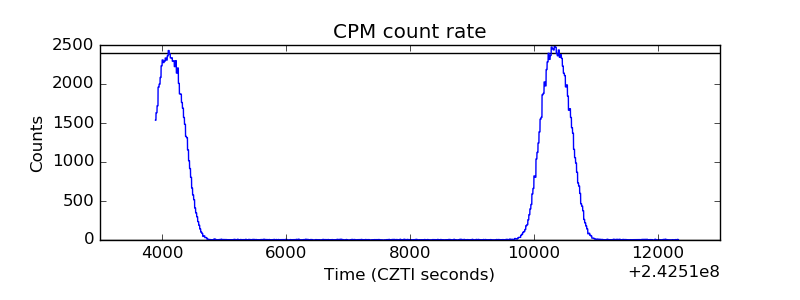 |
| CZT Counter | 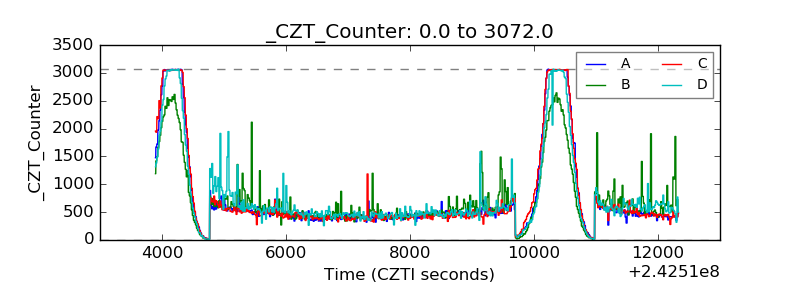 |
| +2.5 Volts monitor | 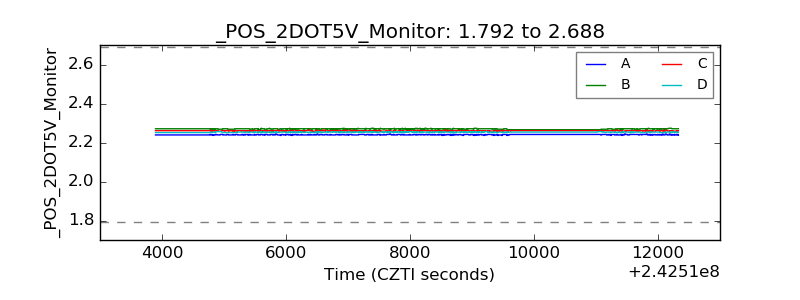 |
| +5 Volts monitor |  |
| _ROLL_ROT | 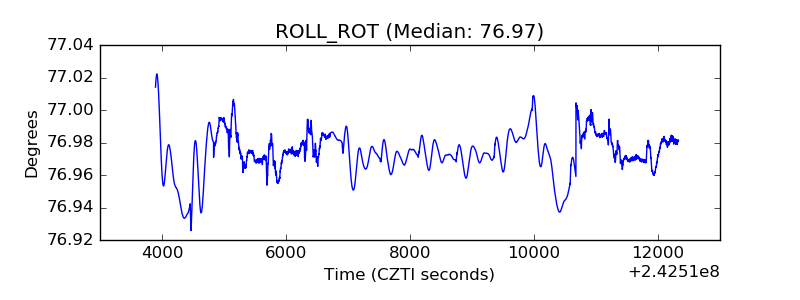 |
| _Roll_DEC |  |
| _Roll_RA | 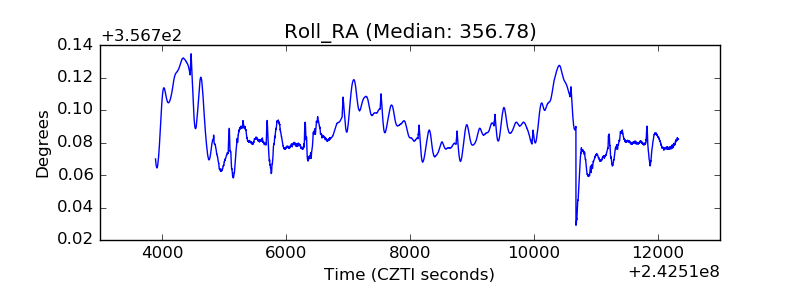 |
| Veto Counter | 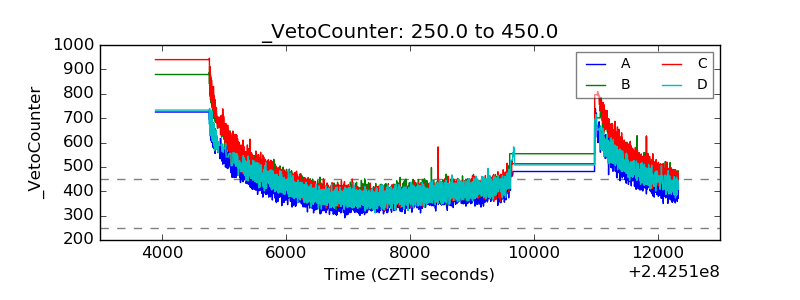 |