| Param | Original file | Final file |
|---|---|---|
| Filename | modeM0/AS1A03_033T01_9000001524_10522cztM0_level2.evt | modeM0/AS1A03_033T01_9000001524_10522cztM0_level2_quad_clean.evt |
| Size (bytes) | 322,364,160 | 65,335,680 |
| Size | 307.4 MB | 62.3 MB |
| Events in quadrant A | 2,161,077 | 408,367 |
| Events in quadrant B | 2,274,363 | 396,514 |
| Events in quadrant C | 2,128,316 | 424,761 |
| Events in quadrant D | 2,886,329 | 427,256 |
| Mode M0 | |||
|---|---|---|---|
| Quadrant | BADHDUFLAG | Total packets | Discarded packets |
| A | 0 | 24403 | 15031 |
| B | 0 | 30161 | 20575 |
| C | 0 | 25233 | 15796 |
| D | 0 | 29893 | 18233 |
| Mode M9 | |||
|---|---|---|---|
| Quadrant | BADHDUFLAG | Total packets | Discarded packets |
| A | 0 | 29 | 13 |
| B | 0 | 31 | 13 |
| C | 0 | 30 | 16 |
| D | 0 | 31 | 15 |
| Mode SS | |||
|---|---|---|---|
| Quadrant | BADHDUFLAG | Total packets | Discarded packets |
| A | 0 | 250 | 155 |
| B | 0 | 248 | 149 |
| C | 0 | 249 | 162 |
| D | 0 | 239 | 139 |
| Quadrant | Total seconds | Saturated seconds | Saturation percentage |
|---|---|---|---|
| A | 4552 | 9 | 0.197715% |
| B | 4271 | 26 | 0.608757% |
| C | 4610 | 7 | 0.151844% |
| D | 4889 | 17 | 0.347719% |
Noise dominated data is calculated using 1-second bins in cleaned event files. If a bin has >2000 counts, and if more than 50% of those come from <1% of pixels, then it is considered to be noise-dominated and hence unusable.
| Quadrant | # 1 sec bins | Bins with >0 counts | Bins with >2000 counts | High rate bins dominated by noise | Noise dominated (total time) | Noise dominated (detector-on time) | Marked lightcurve |
|---|---|---|---|---|---|---|---|
| A | 7488 | 5566 | 0 | 0 | 0.00% | 0.00% | 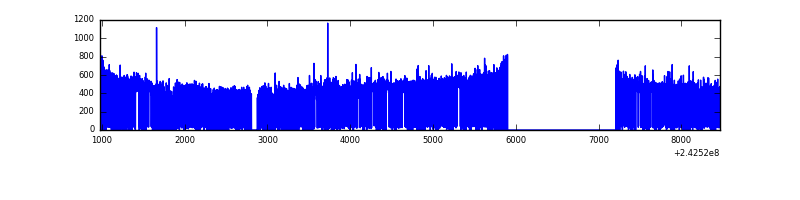 |
| B | 7488 | 5304 | 2 | 2 | 0.03% | 0.04% |  |
| C | 7487 | 5609 | 0 | 0 | 0.00% | 0.00% | 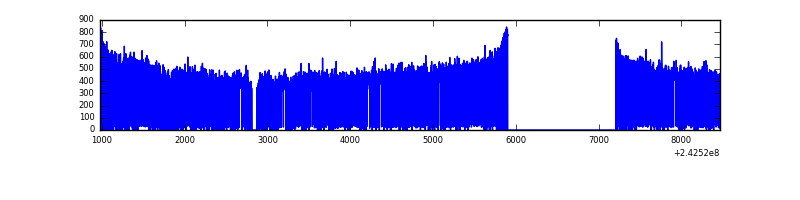 |
| D | 7488 | 5577 | 3 | 3 | 0.04% | 0.05% | 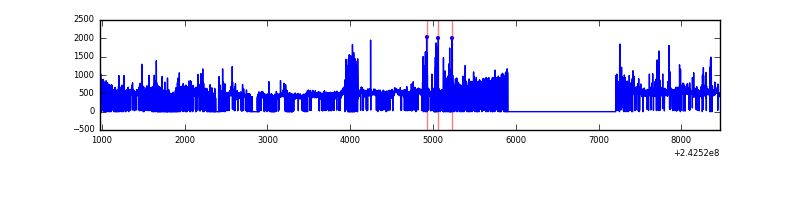 |
Top three noisy pixels from each quadrant. If the there are fewer than three noisy pixels in the level2.evt file, extra rows are filled as -1
| Pixel properties | Quadrant properties | ||||||
|---|---|---|---|---|---|---|---|
| Quadrant | DetID | PixID | Counts | Sigma | Mean | Median | Sigma |
| A | 13 | 251 | 17907 | 157.98 | 545 | 535 | 110.0 |
| A | 1 | 162 | 16211 | 142.56 | 545 | 535 | 110.0 |
| A | 3 | 80 | 12125 | 105.4 | 545 | 535 | 110.0 |
| B | 4 | 239 | 150946 | 1542.54 | 517 | 504 | 97.5 |
| B | 4 | 81 | 44537 | 451.49 | 517 | 504 | 97.5 |
| B | 0 | 214 | 41954 | 425.0 | 517 | 504 | 97.5 |
| C | 13 | 61 | 4102 | 28.3 | 544 | 545 | 125.7 |
| C | 14 | 67 | 1885 | 10.66 | 544 | 545 | 125.7 |
| C | 14 | 234 | 1665 | 8.91 | 544 | 545 | 125.7 |
| D | 2 | 16 | 282433 | 2121.61 | 562 | 548 | 132.9 |
| D | 8 | 195 | 278739 | 2093.8 | 562 | 548 | 132.9 |
| D | 1 | 52 | 65907 | 491.92 | 562 | 548 | 132.9 |
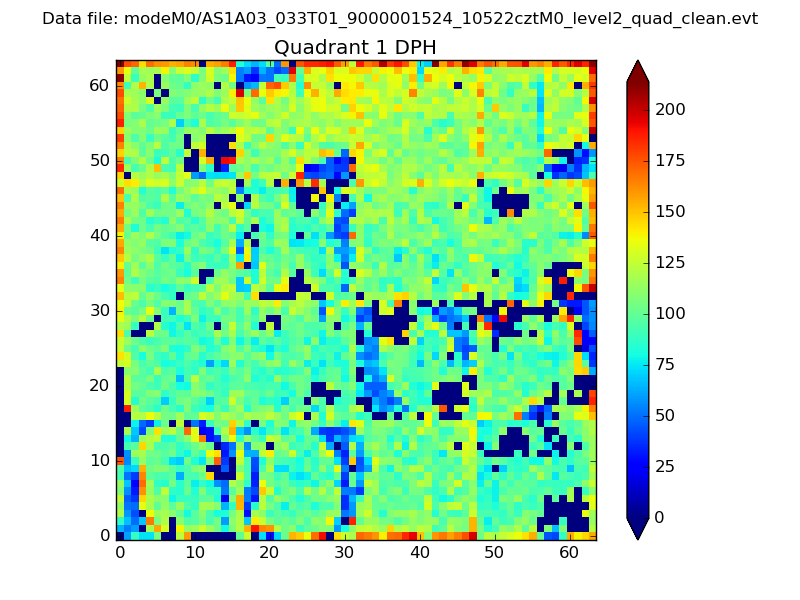
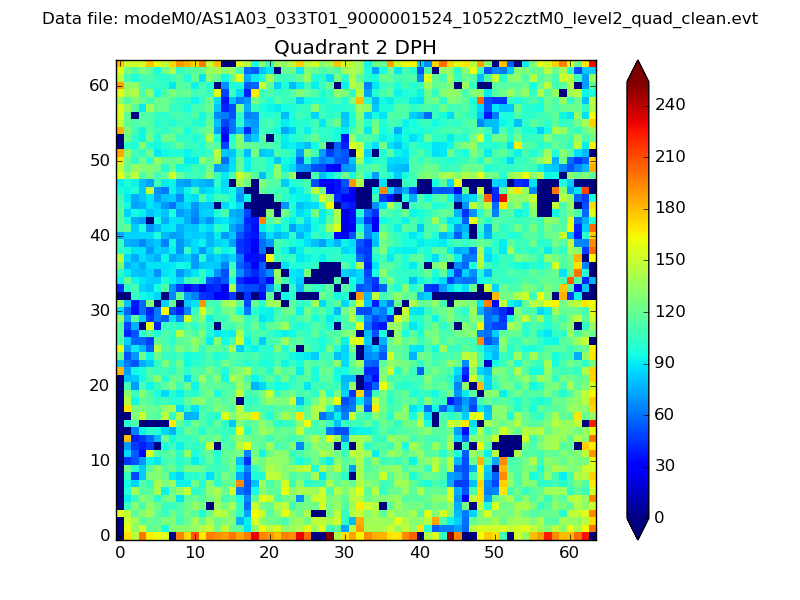
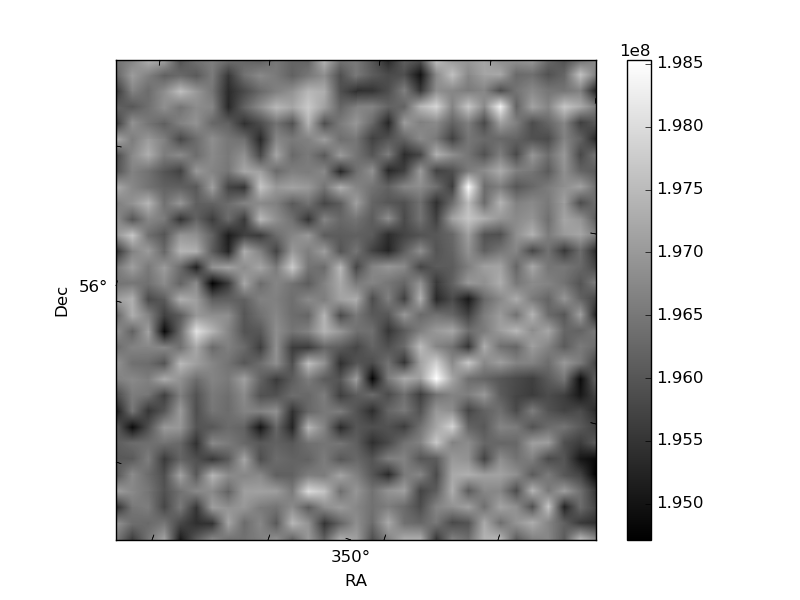
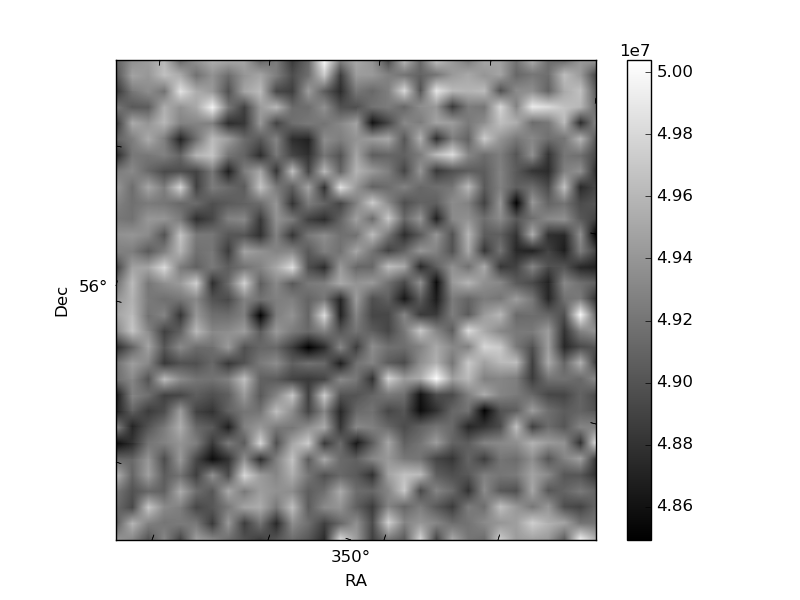
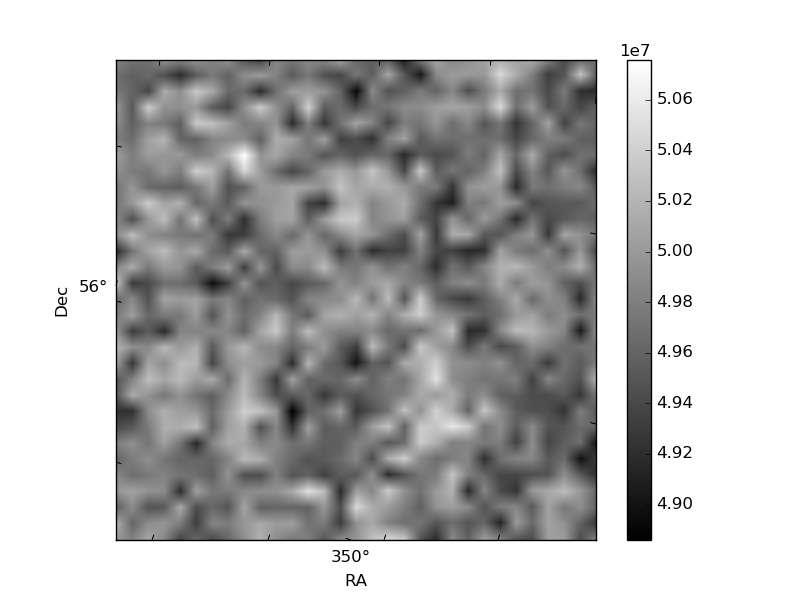
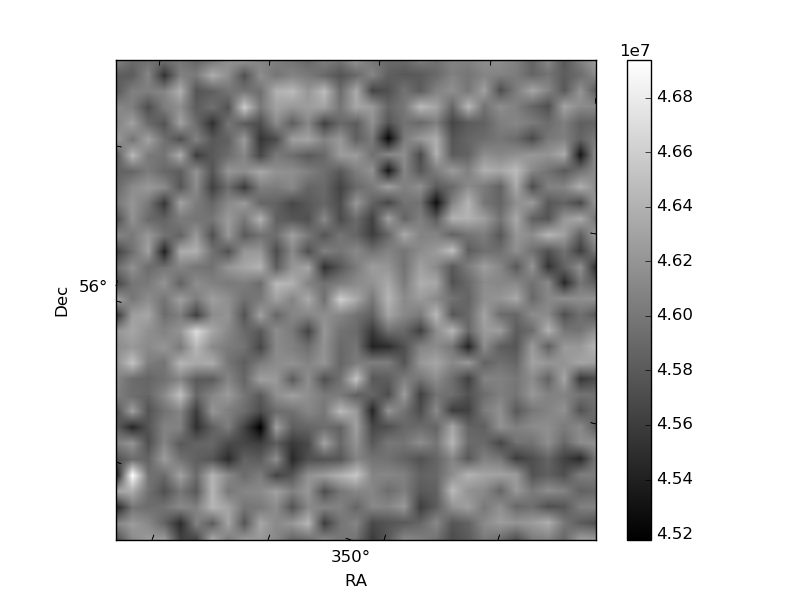
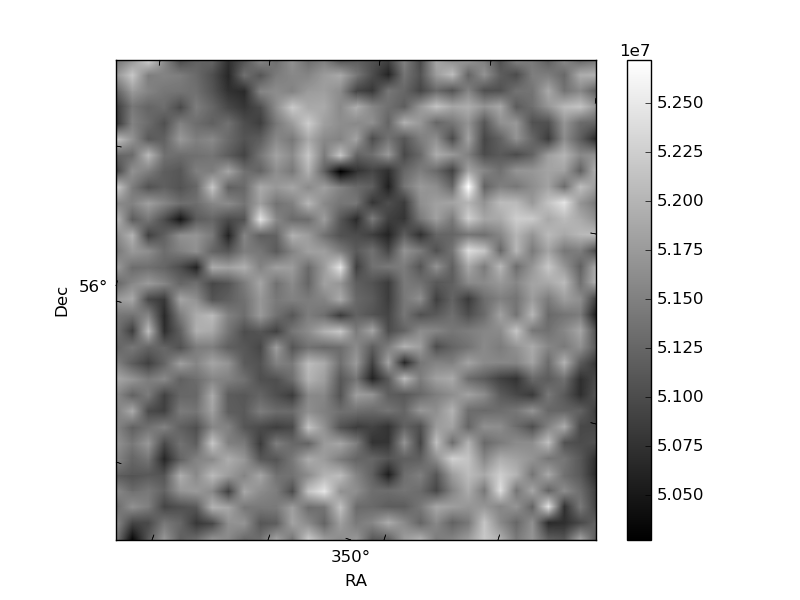
Histogram calculated using DETX and DETY for each event in the final _common_clean file
| Quadrant A | 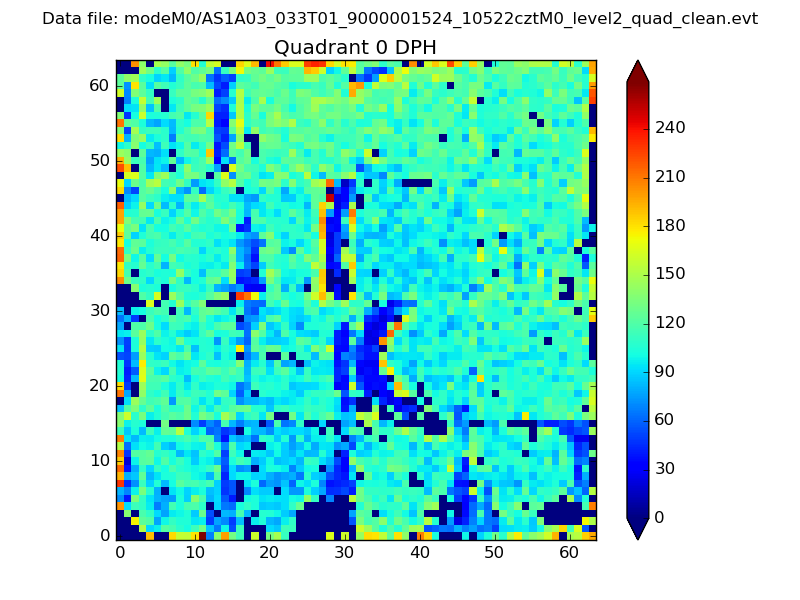 |
 |
Quadrant B |
|---|---|---|---|
| Quadrant D | 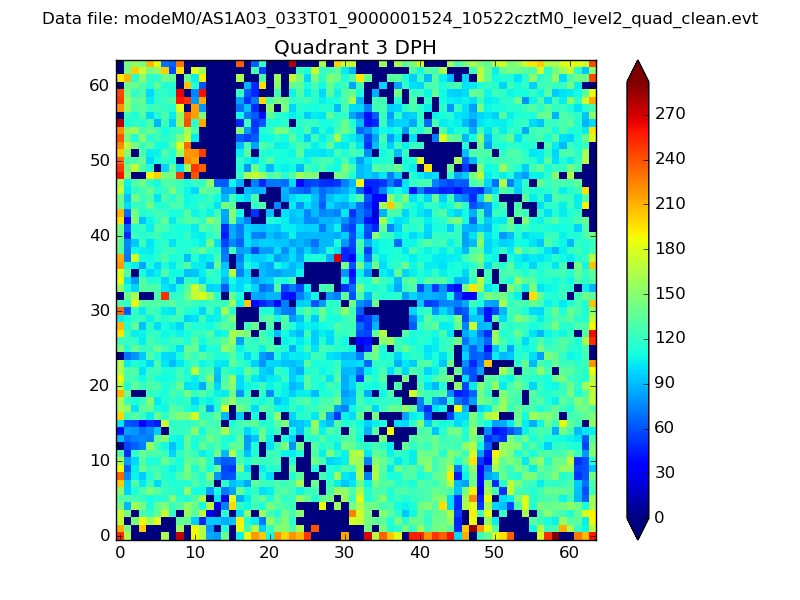 |
 |
Quadrant C |
| Plot type | Count rate plots | Images |
|---|---|---|
| Comparison with Poisson distribution Blue bars denote a histogram of data divided into 1 sec bins. Red curve is a Poisson curve with rate = median count rate of data. |
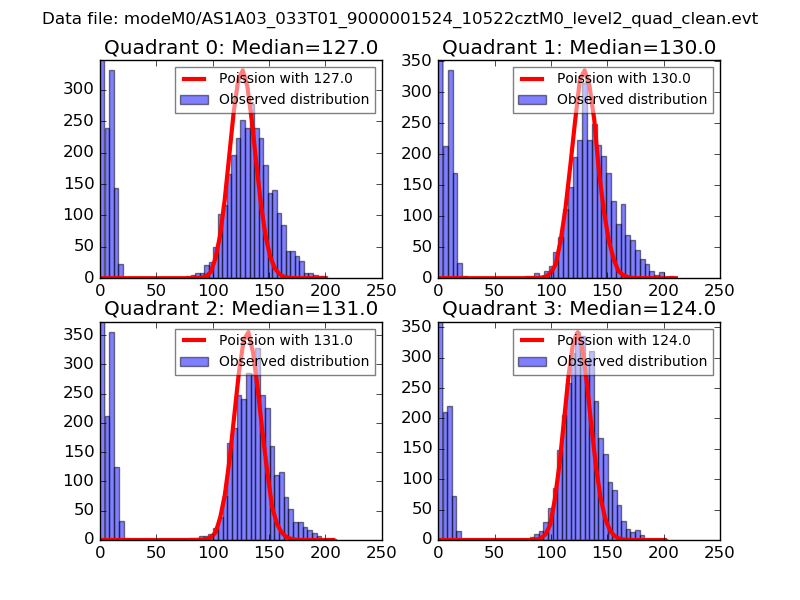 |
 |
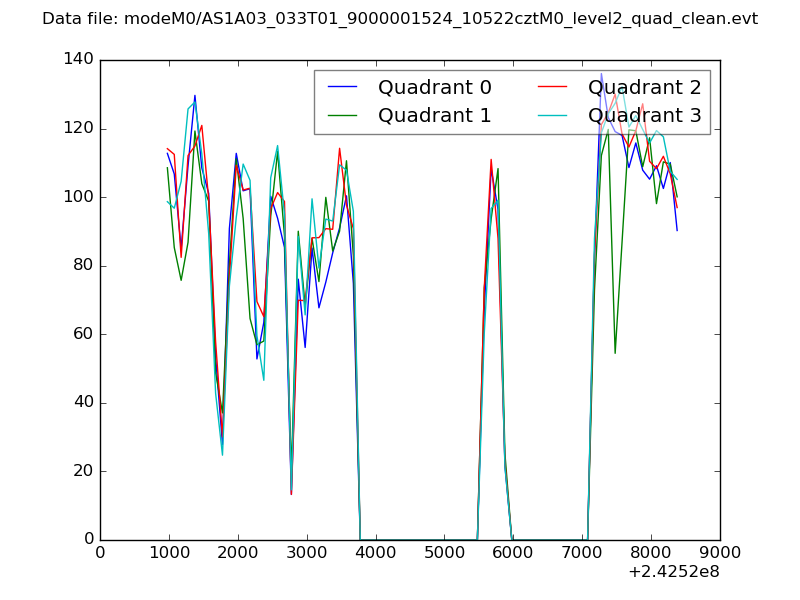
| Quadrant-wise count rates Data is divided into 100 sec bins |
 |
|
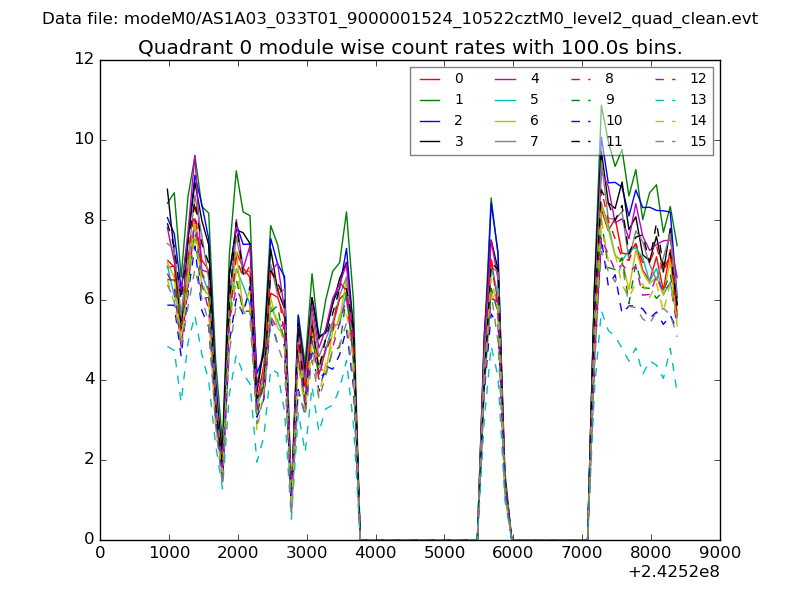
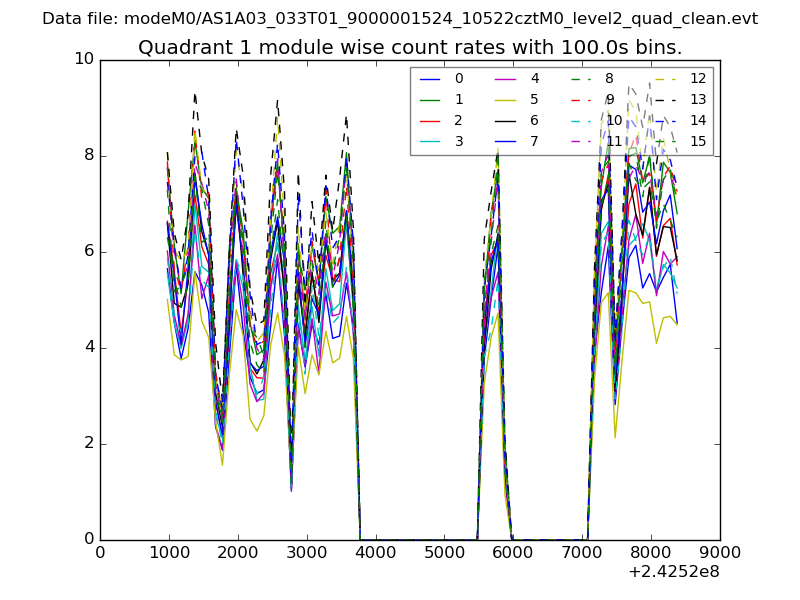
| Module-wise count rates for Quadrant A Data is divided into 100 sec bins |
 |
 |
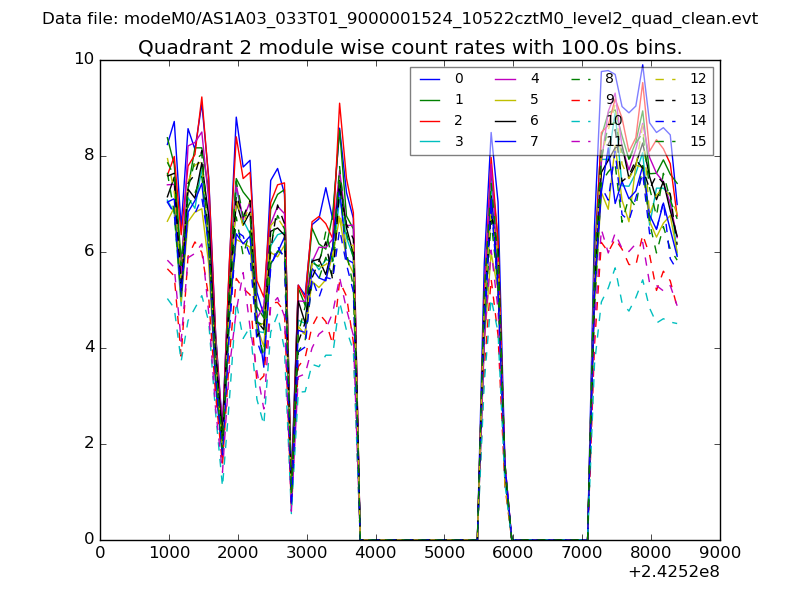
| Module-wise count rates for Quadrant B Data is divided into 100 sec bins |
 |
 |
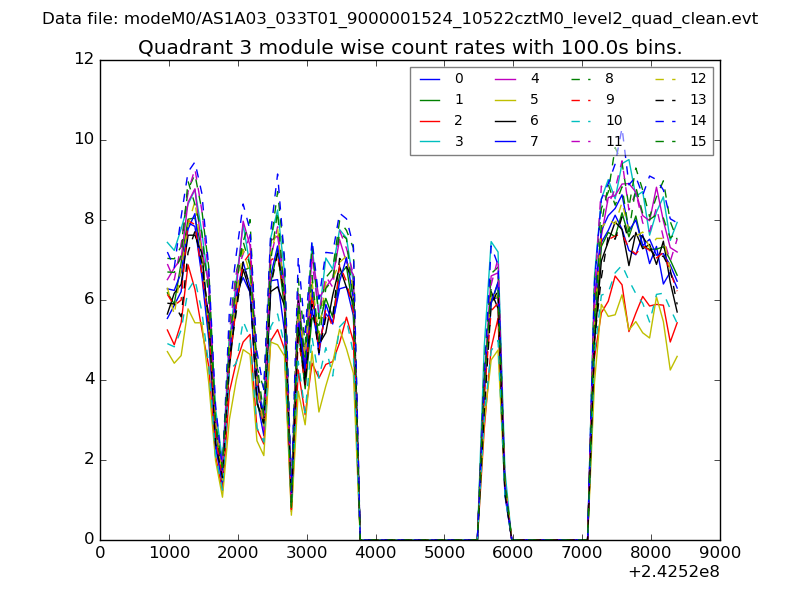
| Module-wise count rates for Quadrant C Data is divided into 100 sec bins |
 |
 |
| Module-wise count rates for Quadrant D Data is divided into 100 sec bins |
 |
 |
| Parameter | Plot |
|---|---|
| CZT HV Monitor | 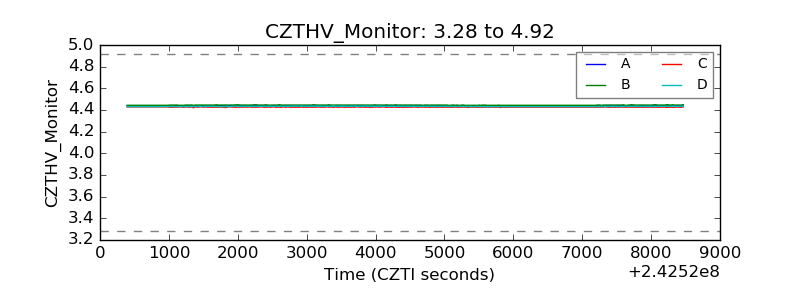 |
| D_VDD | 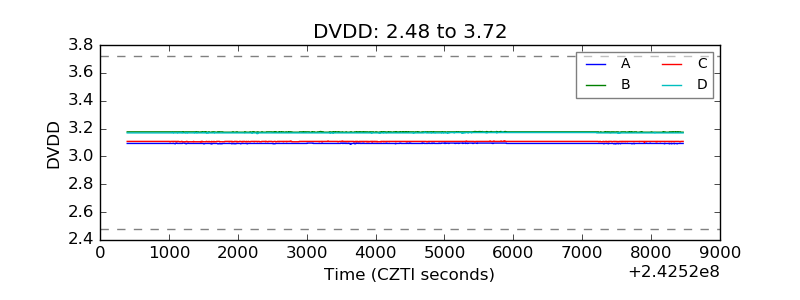 |
| Temperature 1 | 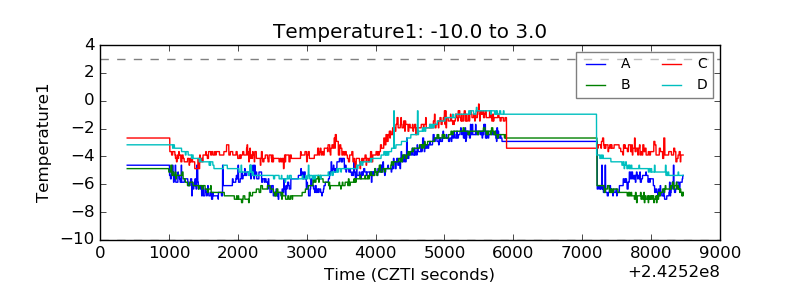 |
| Veto HV Monitor | 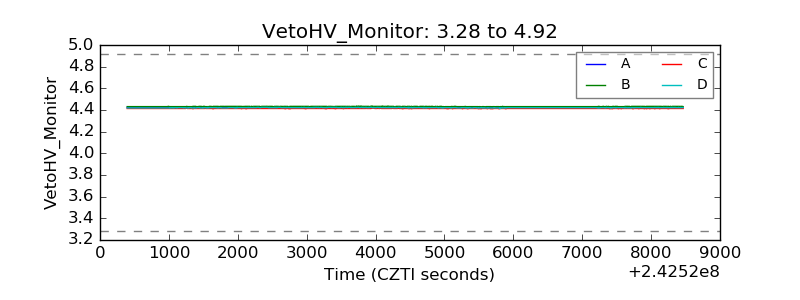 |
| Veto LLD | 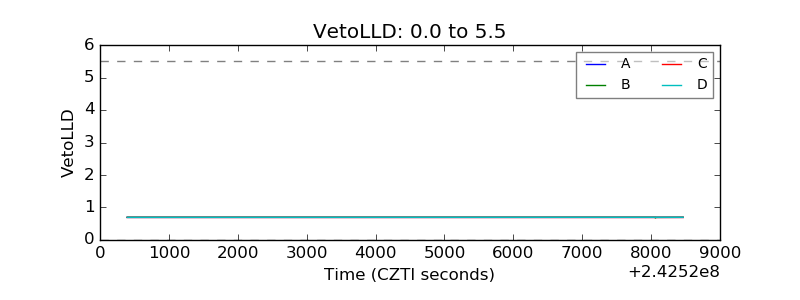 |
| Alpha Counter | 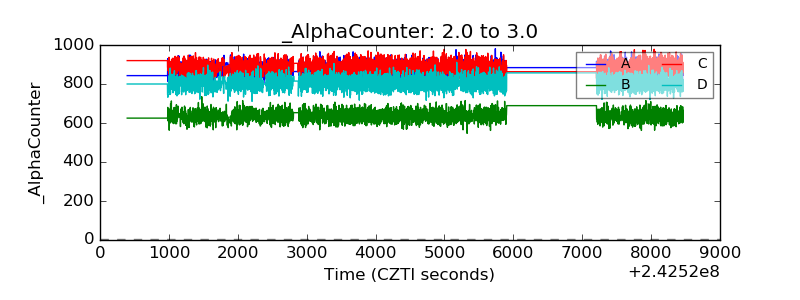 |
| _CPM_Rate | 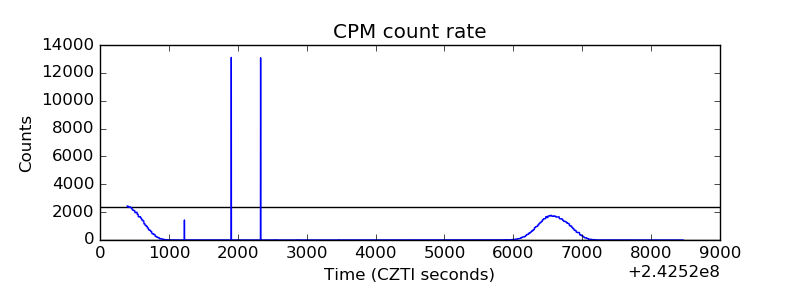 |
| CZT Counter | 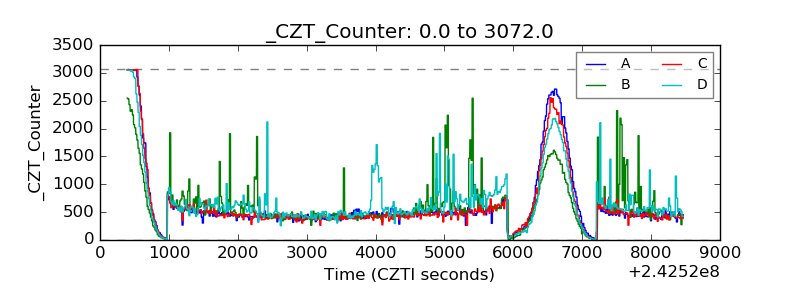 |
| +2.5 Volts monitor | 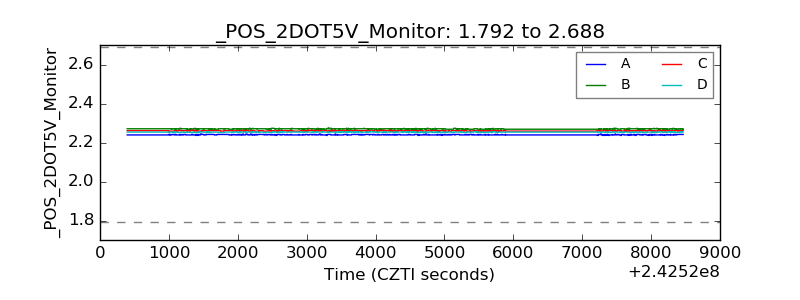 |
| +5 Volts monitor |  |
| _ROLL_ROT | 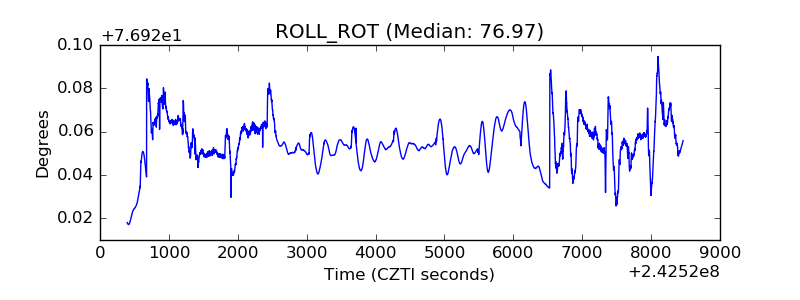 |
| _Roll_DEC | 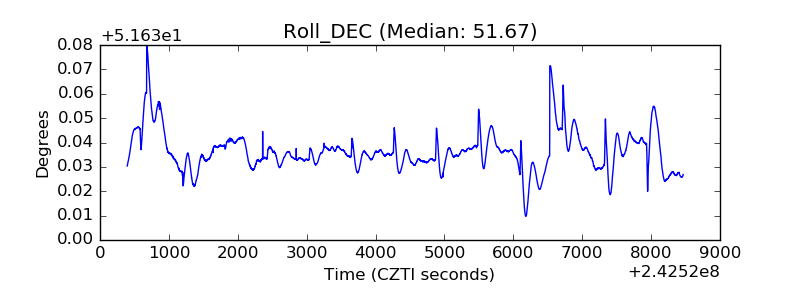 |
| _Roll_RA | 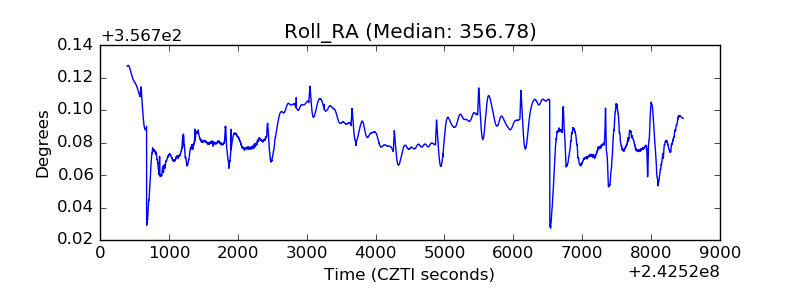 |
| Veto Counter | 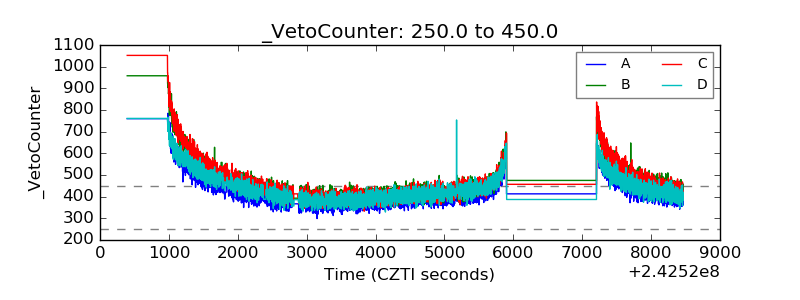 |