| Param | Original file | Final file |
|---|---|---|
| Filename | modeM0/AS1A03_033T01_9000001524_10523cztM0_level2.evt | modeM0/AS1A03_033T01_9000001524_10523cztM0_level2_quad_clean.evt |
| Size (bytes) | 317,162,880 | 64,252,800 |
| Size | 302.5 MB | 61.3 MB |
| Events in quadrant A | 2,200,728 | 407,634 |
| Events in quadrant B | 2,572,915 | 411,295 |
| Events in quadrant C | 2,030,143 | 429,385 |
| Events in quadrant D | 2,497,548 | 384,679 |
| Mode M0 | |||
|---|---|---|---|
| Quadrant | BADHDUFLAG | Total packets | Discarded packets |
| A | 0 | 29499 | 19965 |
| B | 0 | 32871 | 22312 |
| C | 0 | 26566 | 17318 |
| D | 0 | 31062 | 20912 |
| Mode M9 | |||
|---|---|---|---|
| Quadrant | BADHDUFLAG | Total packets | Discarded packets |
| A | 0 | 41 | 25 |
| B | 0 | 41 | 25 |
| C | 0 | 41 | 23 |
| D | 0 | 42 | 24 |
| Mode SS | |||
|---|---|---|---|
| Quadrant | BADHDUFLAG | Total packets | Discarded packets |
| A | 0 | 259 | 164 |
| B | 0 | 259 | 155 |
| C | 0 | 260 | 170 |
| D | 0 | 260 | 166 |
| Quadrant | Total seconds | Saturated seconds | Saturation percentage |
|---|---|---|---|
| A | 4455 | 56 | 1.257015% |
| B | 4313 | 180 | 4.173429% |
| C | 4519 | 18 | 0.398318% |
| D | 4335 | 15 | 0.346021% |
Noise dominated data is calculated using 1-second bins in cleaned event files. If a bin has >2000 counts, and if more than 50% of those come from <1% of pixels, then it is considered to be noise-dominated and hence unusable.
| Quadrant | # 1 sec bins | Bins with >0 counts | Bins with >2000 counts | High rate bins dominated by noise | Noise dominated (total time) | Noise dominated (detector-on time) | Marked lightcurve |
|---|---|---|---|---|---|---|---|
| A | 7766 | 5425 | 14 | 14 | 0.18% | 0.26% | 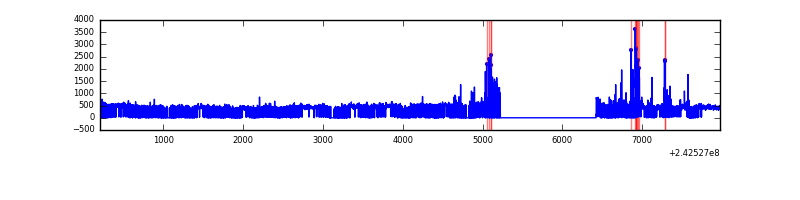 |
| B | 7766 | 5392 | 76 | 76 | 0.98% | 1.41% | 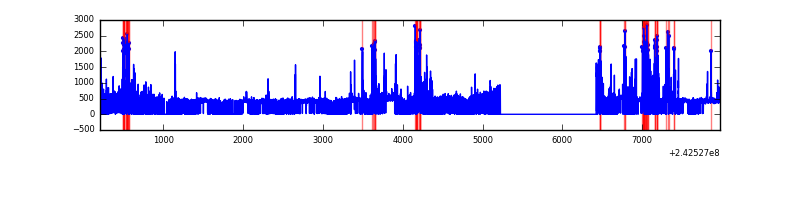 |
| C | 7766 | 5538 | 0 | 0 | 0.00% | 0.00% | 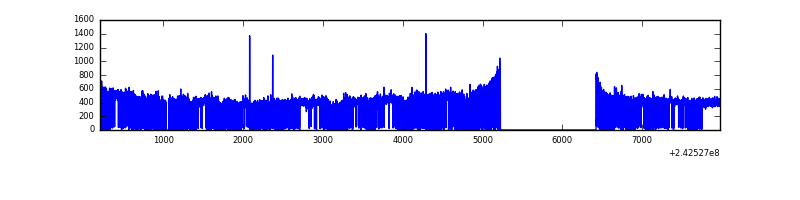 |
| D | 7766 | 5376 | 4 | 4 | 0.05% | 0.07% | 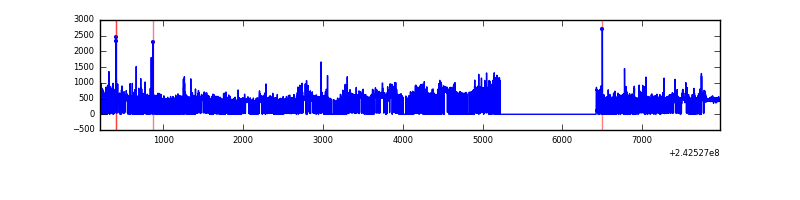 |
Top three noisy pixels from each quadrant. If the there are fewer than three noisy pixels in the level2.evt file, extra rows are filled as -1
| Pixel properties | Quadrant properties | ||||||
|---|---|---|---|---|---|---|---|
| Quadrant | DetID | PixID | Counts | Sigma | Mean | Median | Sigma |
| A | 15 | 239 | 158083 | 1503.87 | 516 | 508 | 104.8 |
| A | 13 | 251 | 38923 | 366.63 | 516 | 508 | 104.8 |
| A | 3 | 80 | 13075 | 119.94 | 516 | 508 | 104.8 |
| B | 4 | 239 | 527954 | 5499.97 | 505 | 493 | 95.9 |
| B | 0 | 214 | 49048 | 506.3 | 505 | 493 | 95.9 |
| B | 0 | 187 | 11730 | 117.17 | 505 | 493 | 95.9 |
| C | 14 | 234 | 7184 | 55.82 | 516 | 518 | 119.4 |
| C | 14 | 238 | 5442 | 41.23 | 516 | 518 | 119.4 |
| C | 13 | 61 | 3822 | 27.67 | 516 | 518 | 119.4 |
| D | 8 | 195 | 297395 | 2573.31 | 482 | 469 | 115.4 |
| D | 2 | 16 | 274306 | 2373.21 | 482 | 469 | 115.4 |
| D | 13 | 137 | 48458 | 415.9 | 482 | 469 | 115.4 |
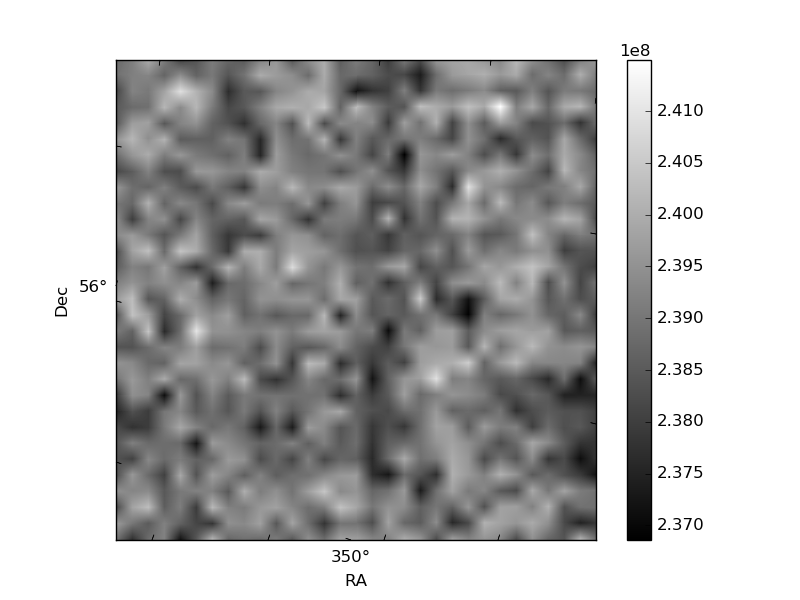
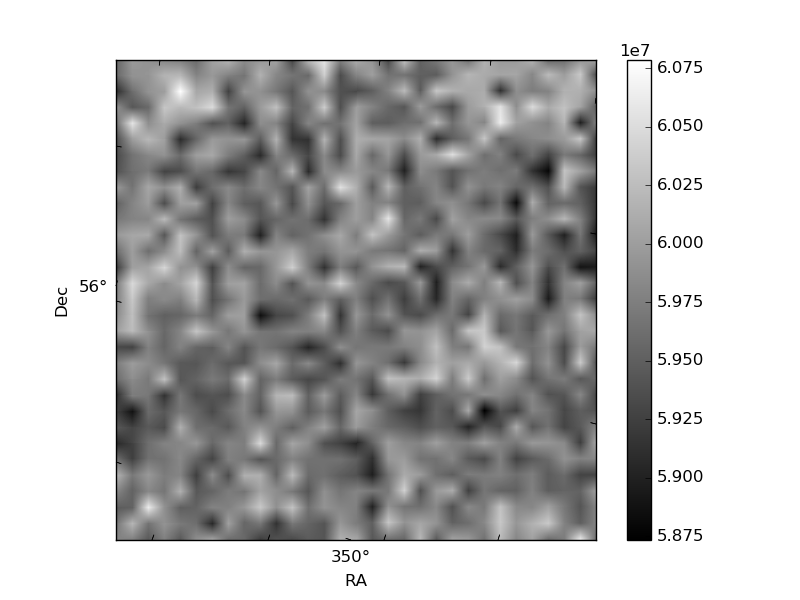
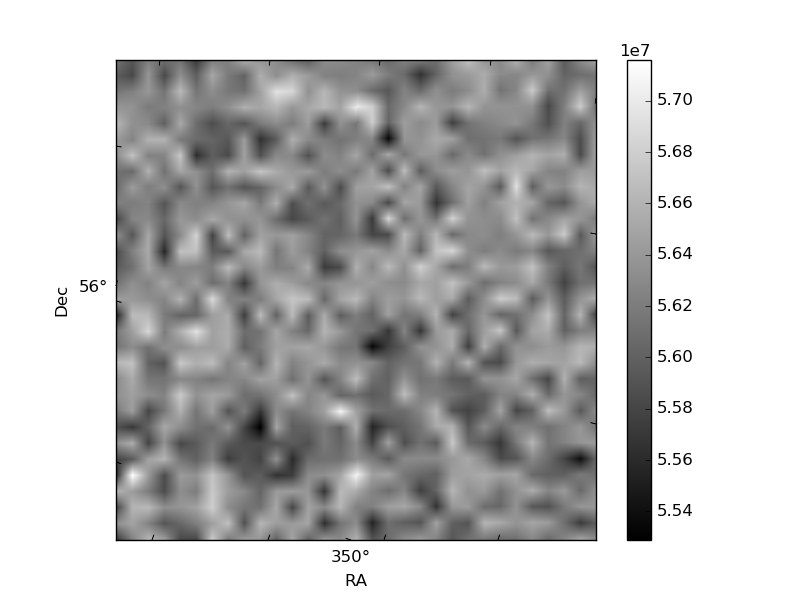
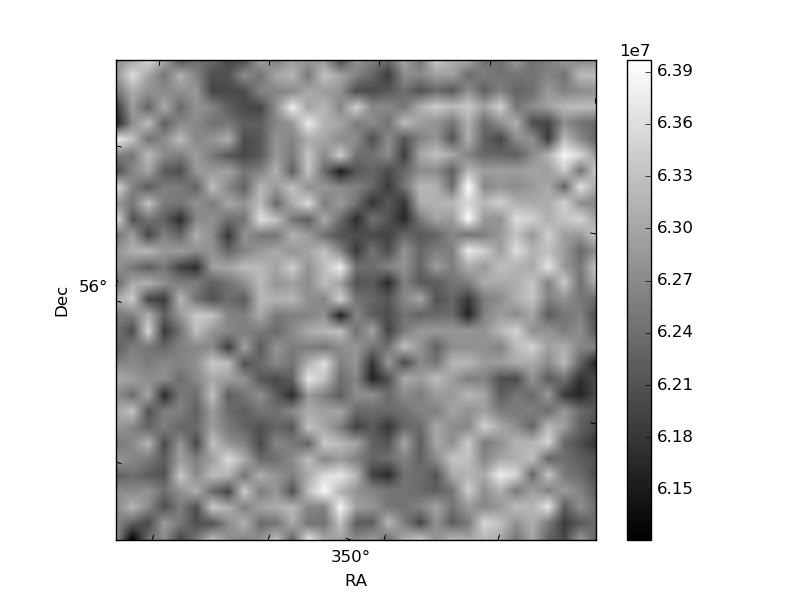
Histogram calculated using DETX and DETY for each event in the final _common_clean file
| Quadrant A | 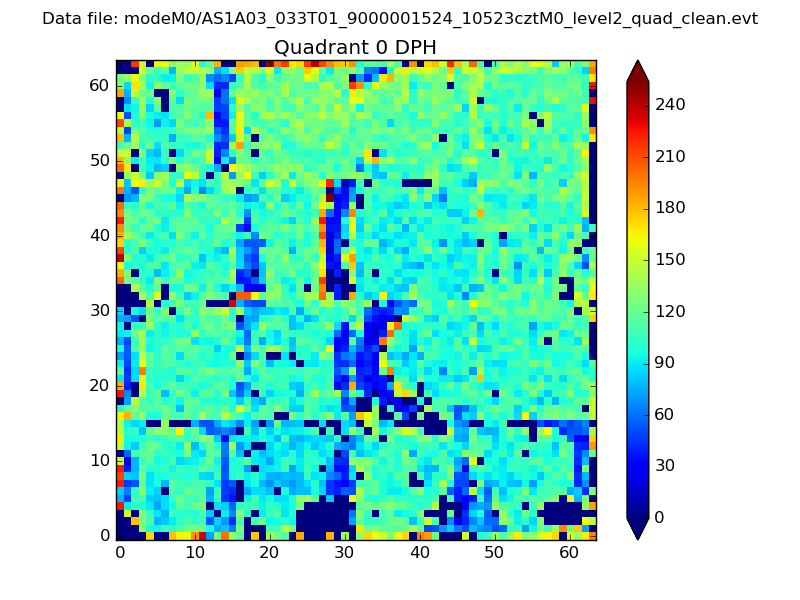 |
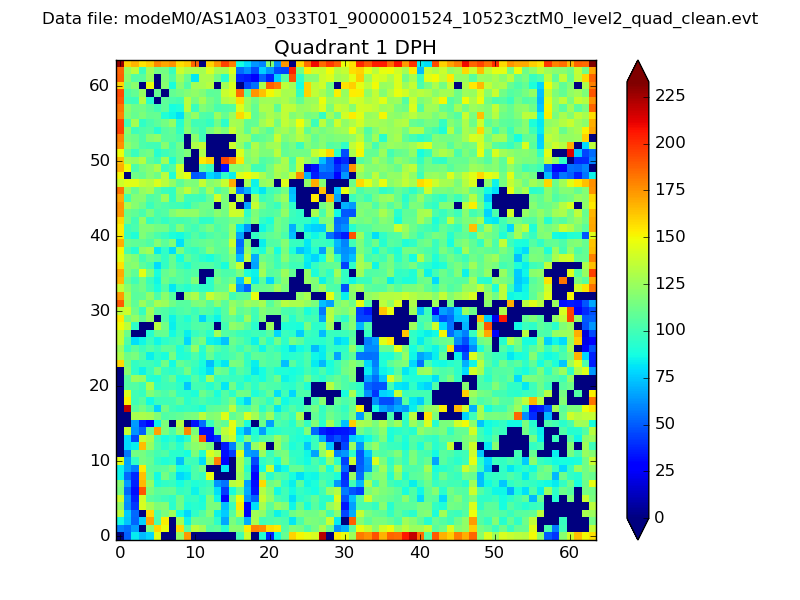 |
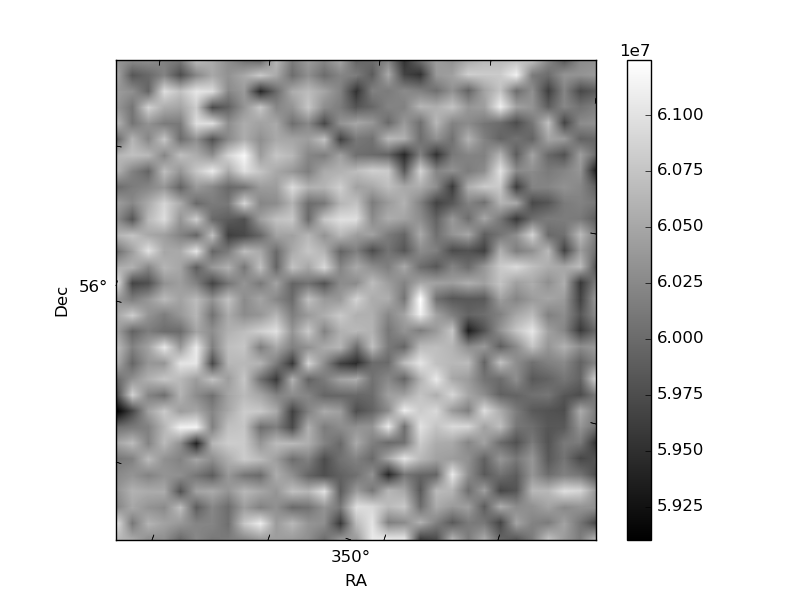
Quadrant B |
|---|---|---|---|
| Quadrant D | 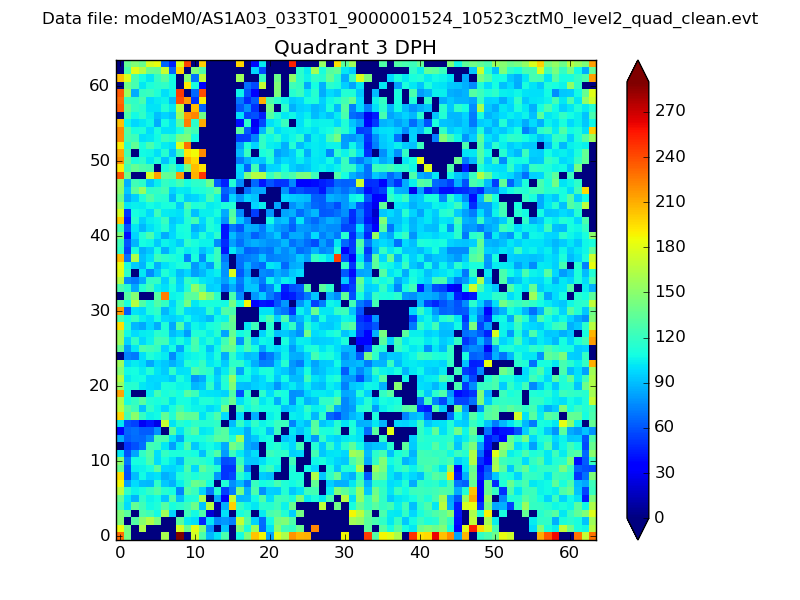 |
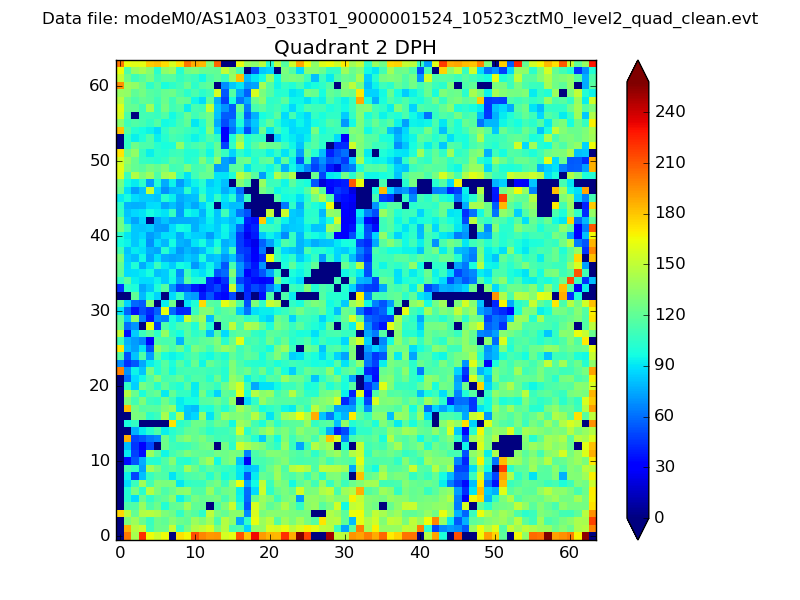 |
Quadrant C |
| Plot type | Count rate plots | Images |
|---|---|---|
| Comparison with Poisson distribution Blue bars denote a histogram of data divided into 1 sec bins. Red curve is a Poisson curve with rate = median count rate of data. |
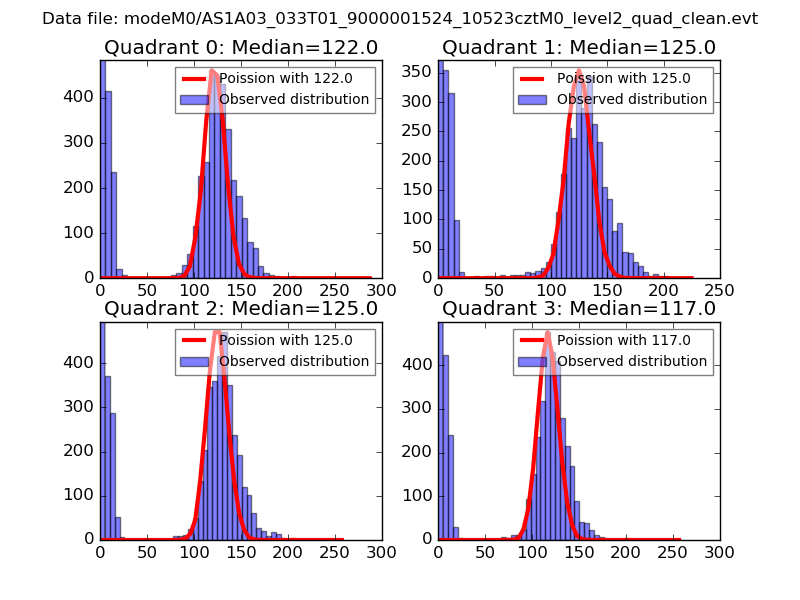 |
 |
| Quadrant-wise count rates Data is divided into 100 sec bins |
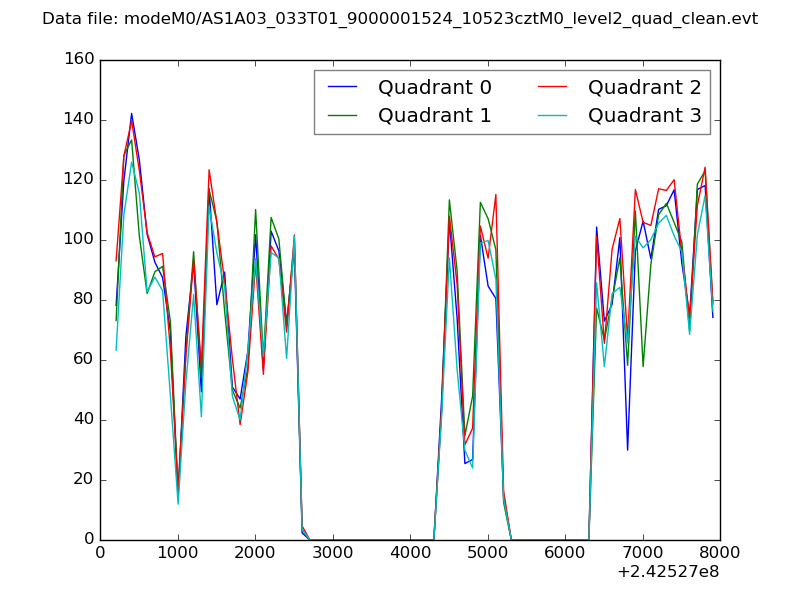 |
|
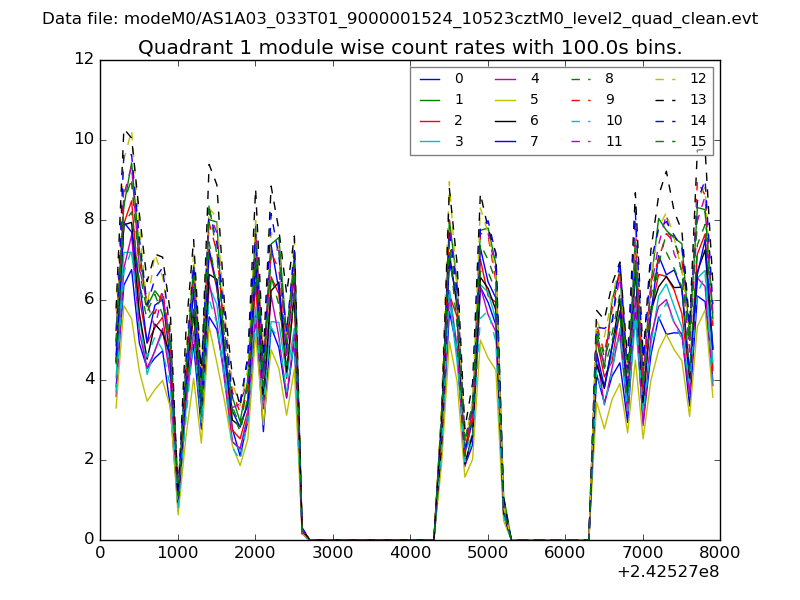
| Module-wise count rates for Quadrant A Data is divided into 100 sec bins |
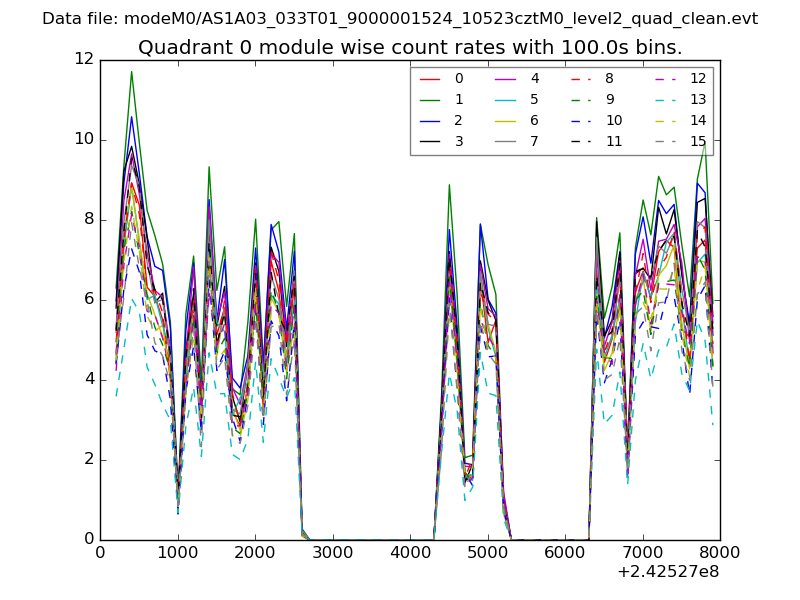 |
 |
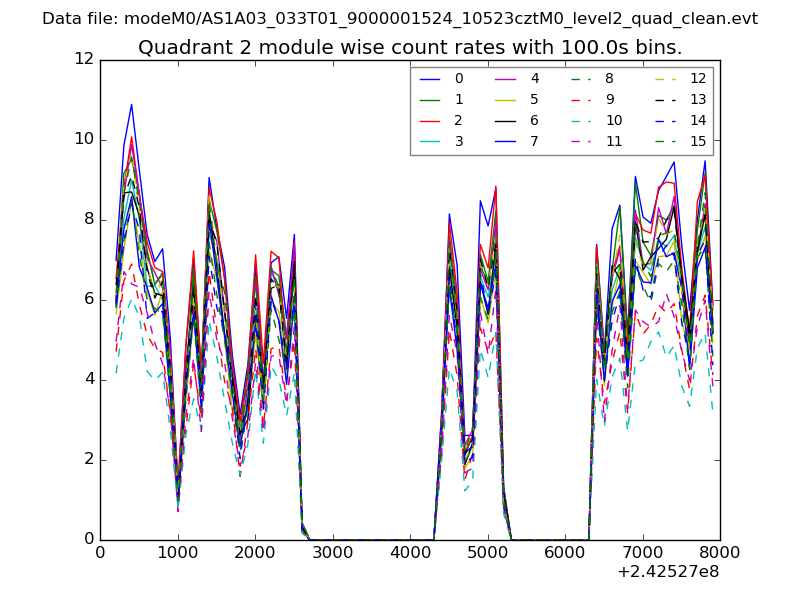
| Module-wise count rates for Quadrant B Data is divided into 100 sec bins |
 |
 |
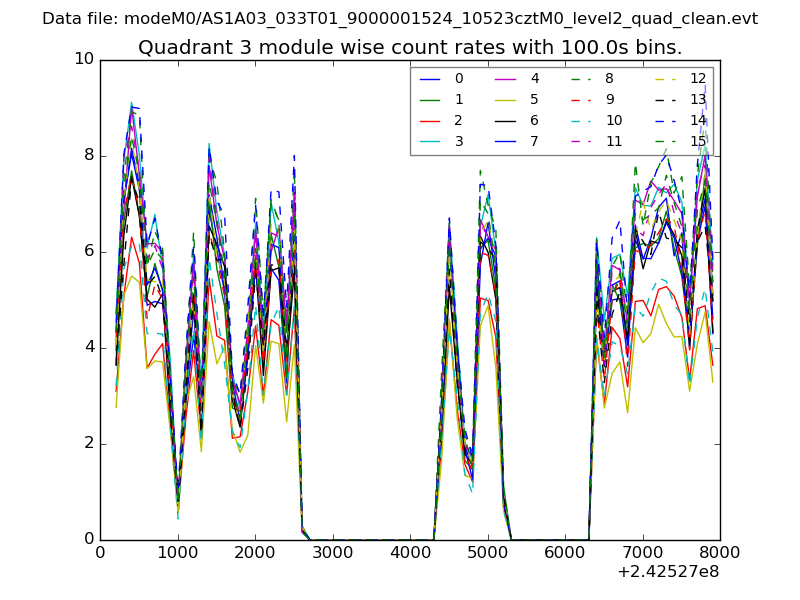
| Module-wise count rates for Quadrant C Data is divided into 100 sec bins |
 |
 |
| Module-wise count rates for Quadrant D Data is divided into 100 sec bins |
 |
 |
| Parameter | Plot |
|---|---|
| CZT HV Monitor | 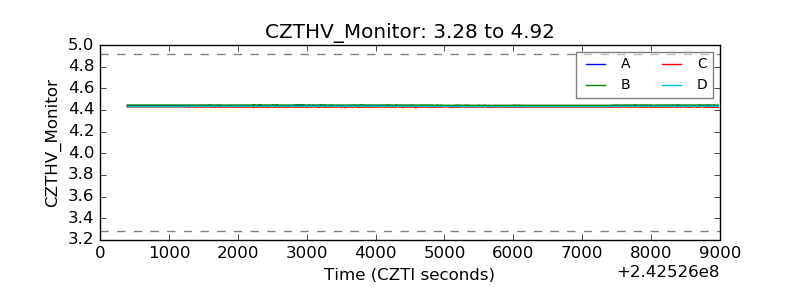 |
| D_VDD | 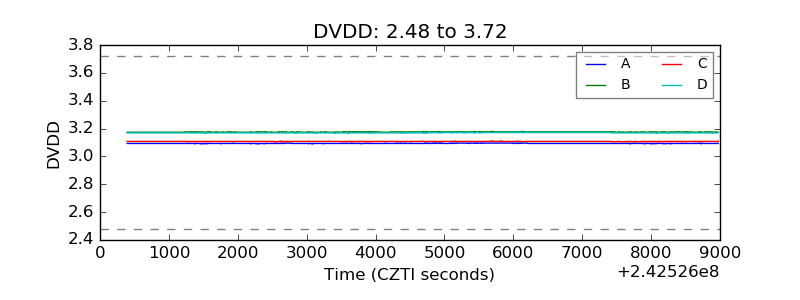 |
| Temperature 1 | 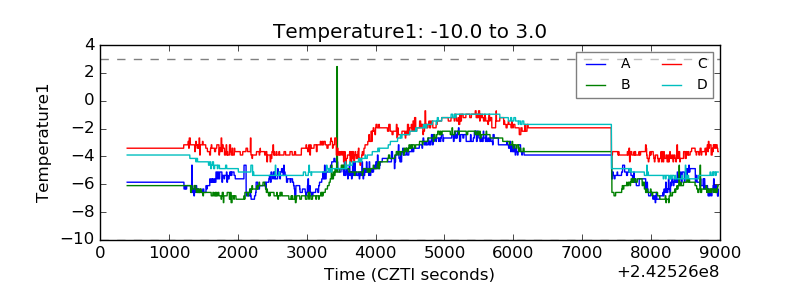 |
| Veto HV Monitor | 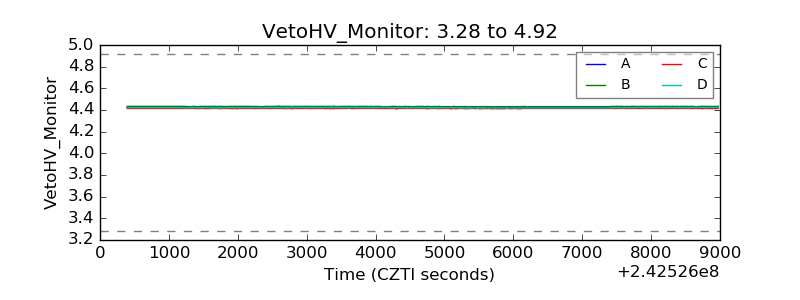 |
| Veto LLD | 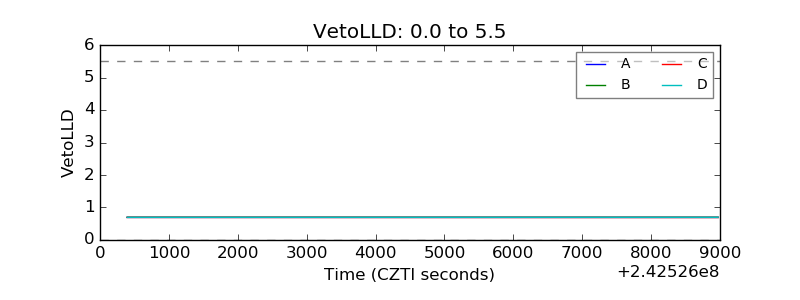 |
| Alpha Counter | 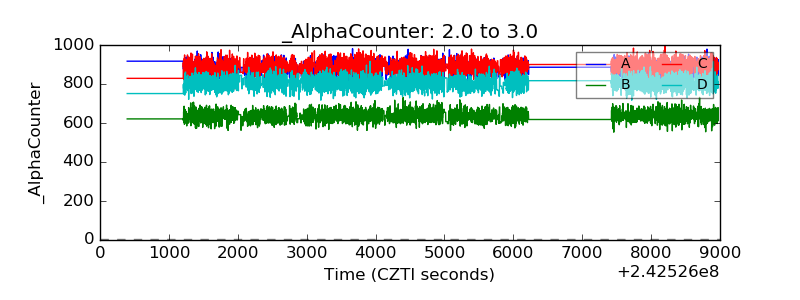 |
| _CPM_Rate | 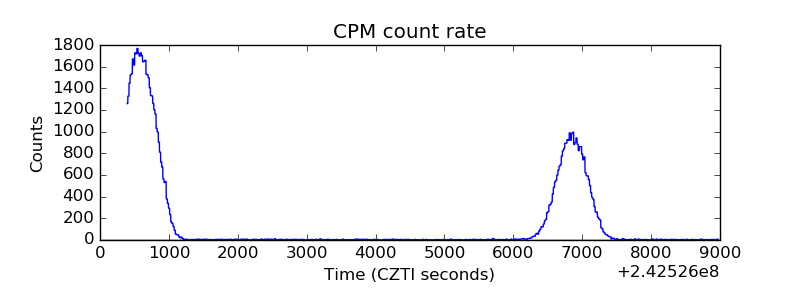 |
| CZT Counter | 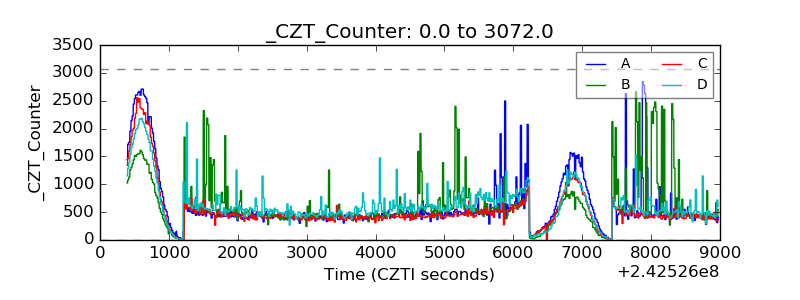 |
| +2.5 Volts monitor | 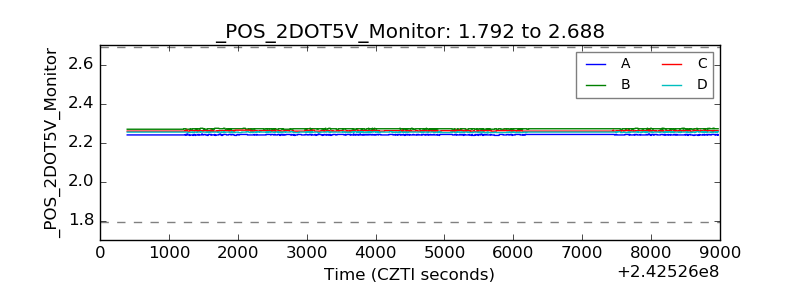 |
| +5 Volts monitor |  |
| _ROLL_ROT | 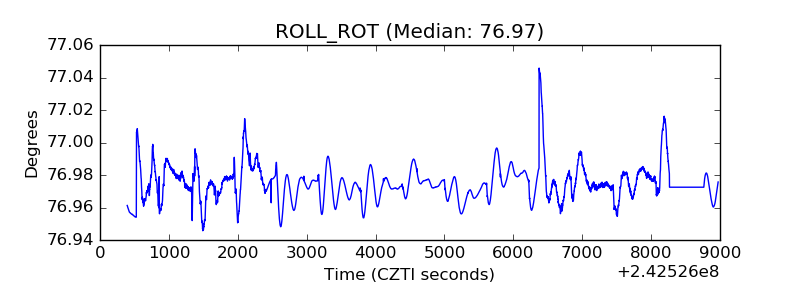 |
| _Roll_DEC | 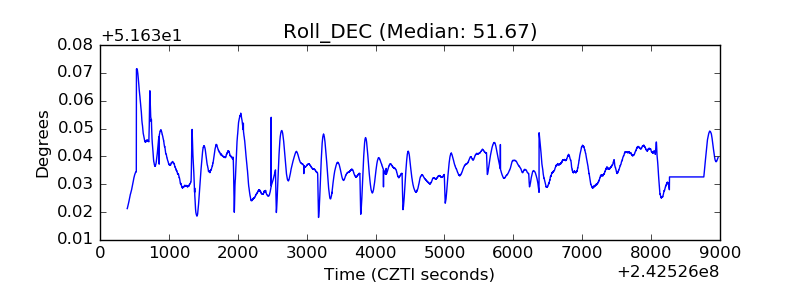 |
| _Roll_RA | 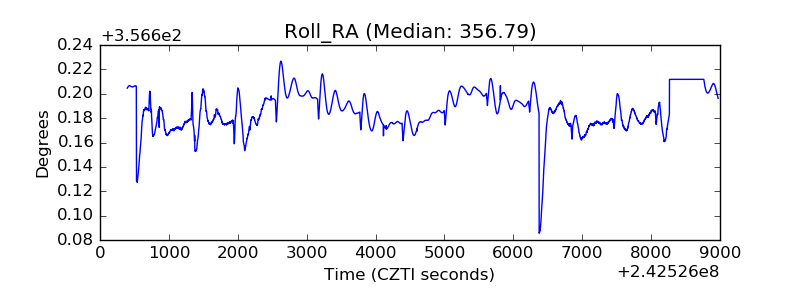 |
| Veto Counter | 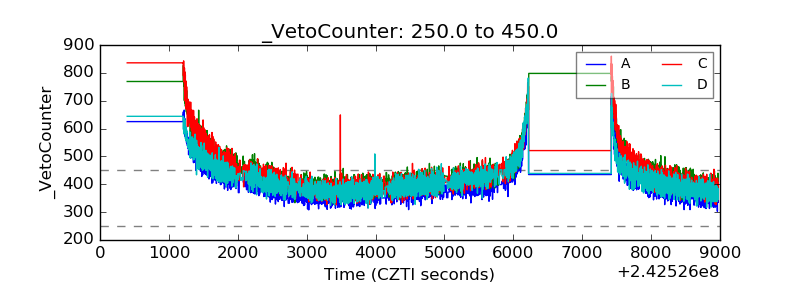 |