| Param | Original file | Final file |
|---|---|---|
| Filename | modeM0/AS1A03_033T01_9000001524_10524cztM0_level2.evt | modeM0/AS1A03_033T01_9000001524_10524cztM0_level2_quad_clean.evt |
| Size (bytes) | 406,581,120 | 49,599,360 |
| Size | 387.7 MB | 47.3 MB |
| Events in quadrant A | 2,782,665 | 273,366 |
| Events in quadrant B | 3,331,571 | 333,631 |
| Events in quadrant C | 2,255,045 | 311,969 |
| Events in quadrant D | 3,650,049 | 277,870 |
| Mode M0 | |||
|---|---|---|---|
| Quadrant | BADHDUFLAG | Total packets | Discarded packets |
| A | 0 | 11351 | 1 |
| B | 0 | 12939 | 31 |
| C | 0 | 9821 | 6 |
| D | 0 | 13769 | 11 |
| Mode M9 | |||
|---|---|---|---|
| Quadrant | BADHDUFLAG | Total packets | Discarded packets |
| A | 0 | 5 | 0 |
| B | 0 | 5 | 0 |
| C | 0 | 5 | 0 |
| D | 0 | 6 | 0 |
| Mode SS | |||
|---|---|---|---|
| Quadrant | BADHDUFLAG | Total packets | Discarded packets |
| A | 0 | 86 | 0 |
| B | 0 | 86 | 0 |
| C | 0 | 86 | 0 |
| D | 0 | 86 | 0 |
| Quadrant | Total seconds | Saturated seconds | Saturation percentage |
|---|---|---|---|
| A | 4331 | 153 | 3.532671% |
| B | 4324 | 382 | 8.834413% |
| C | 4329 | 16 | 0.369600% |
| D | 4329 | 295 | 6.814507% |
Noise dominated data is calculated using 1-second bins in cleaned event files. If a bin has >2000 counts, and if more than 50% of those come from <1% of pixels, then it is considered to be noise-dominated and hence unusable.
| Quadrant | # 1 sec bins | Bins with >0 counts | Bins with >2000 counts | High rate bins dominated by noise | Noise dominated (total time) | Noise dominated (detector-on time) | Marked lightcurve |
|---|---|---|---|---|---|---|---|
| A | 4331 | 4331 | 125 | 125 | 2.89% | 2.89% | 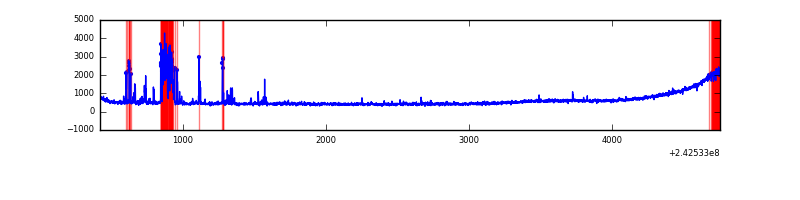 |
| B | 4331 | 4331 | 246 | 246 | 5.68% | 5.68% | 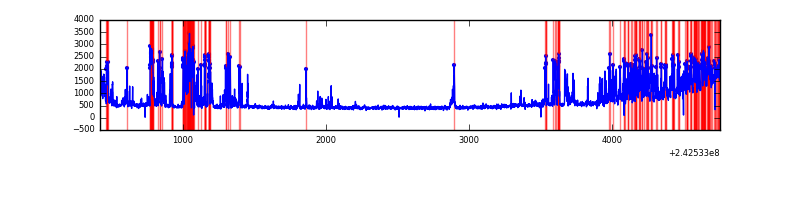 |
| C | 4331 | 4331 | 1 | 1 | 0.02% | 0.02% | 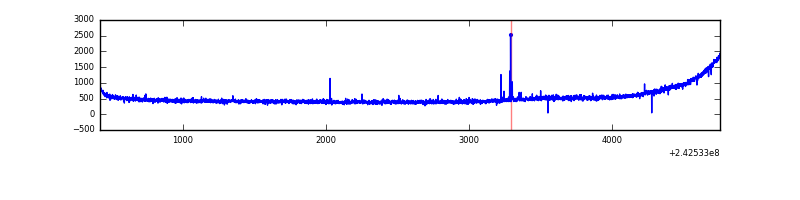 |
| D | 4331 | 4331 | 274 | 274 | 6.33% | 6.33% | 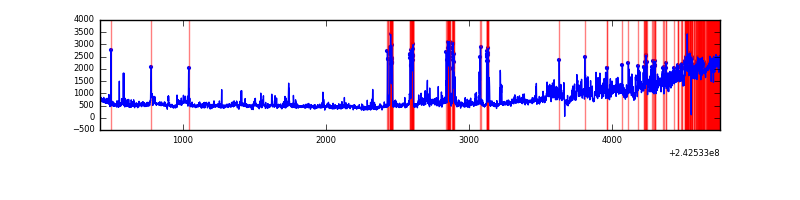 |
Top three noisy pixels from each quadrant. If the there are fewer than three noisy pixels in the level2.evt file, extra rows are filled as -1
| Pixel properties | Quadrant properties | ||||||
|---|---|---|---|---|---|---|---|
| Quadrant | DetID | PixID | Counts | Sigma | Mean | Median | Sigma |
| A | 15 | 239 | 324935 | 2341.97 | 623 | 617 | 138.5 |
| A | 3 | 80 | 24005 | 168.89 | 623 | 617 | 138.5 |
| A | 13 | 251 | 20621 | 144.45 | 623 | 617 | 138.5 |
| B | 4 | 239 | 1143103 | 10247.5 | 551 | 543 | 111.5 |
| B | 0 | 214 | 20834 | 181.99 | 551 | 543 | 111.5 |
| B | 12 | 111 | 10011 | 84.92 | 551 | 543 | 111.5 |
| C | 14 | 234 | 13604 | 88.42 | 572 | 578 | 147.3 |
| C | 14 | 238 | 7749 | 48.68 | 572 | 578 | 147.3 |
| C | 13 | 61 | 3896 | 22.52 | 572 | 578 | 147.3 |
| D | 2 | 16 | 694703 | 4174.6 | 601 | 590 | 166.3 |
| D | 8 | 195 | 329768 | 1979.77 | 601 | 590 | 166.3 |
| D | 1 | 52 | 257907 | 1547.58 | 601 | 590 | 166.3 |
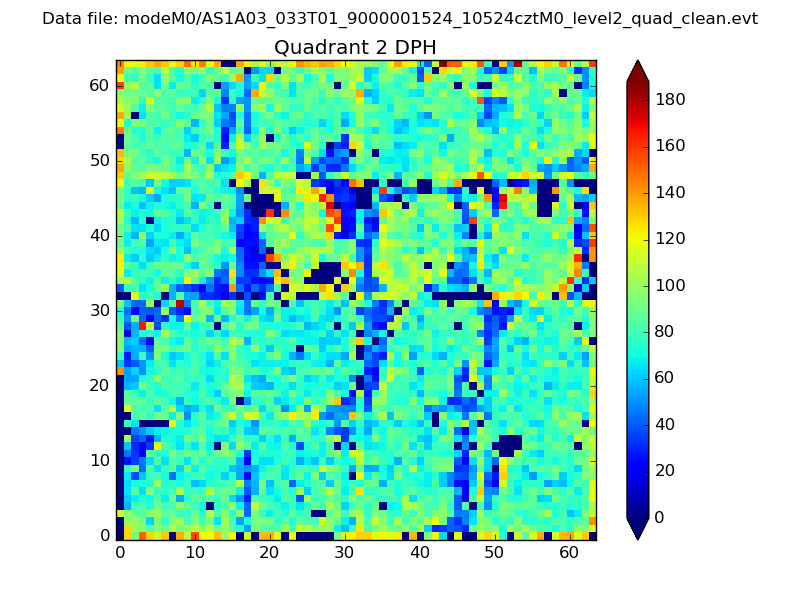
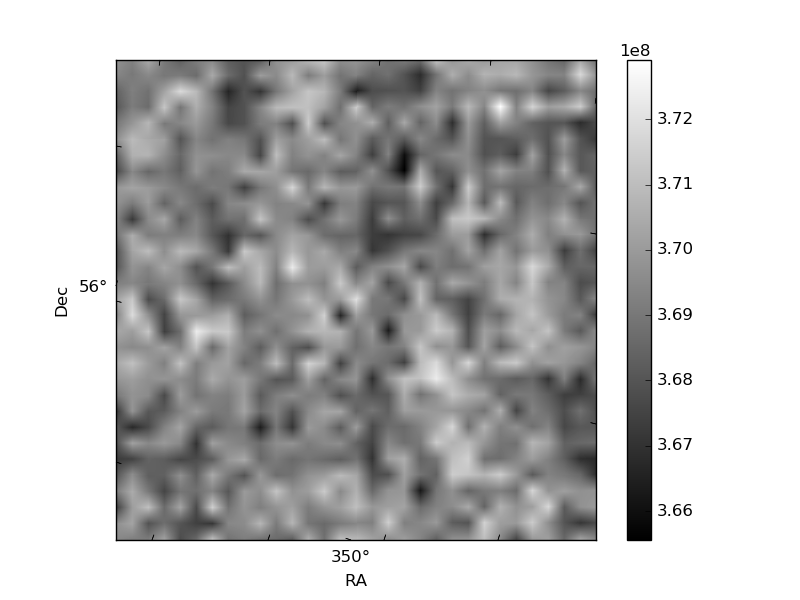
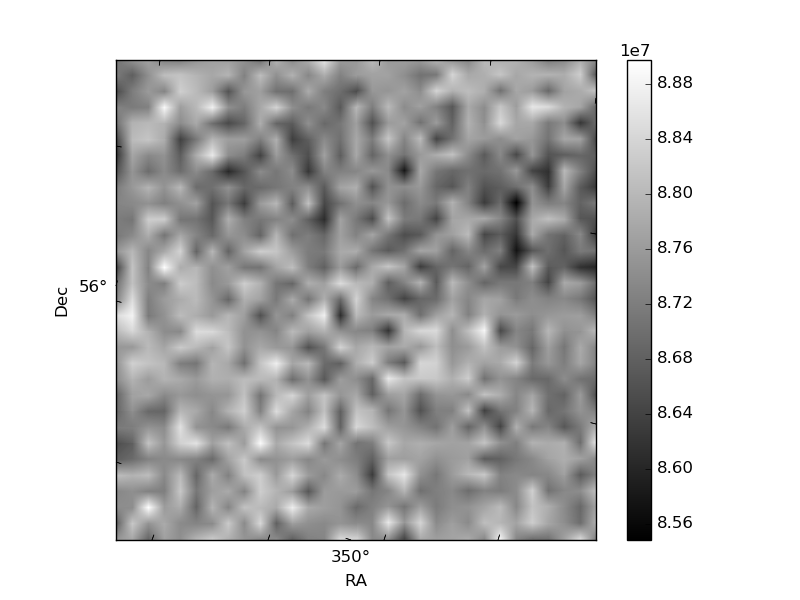
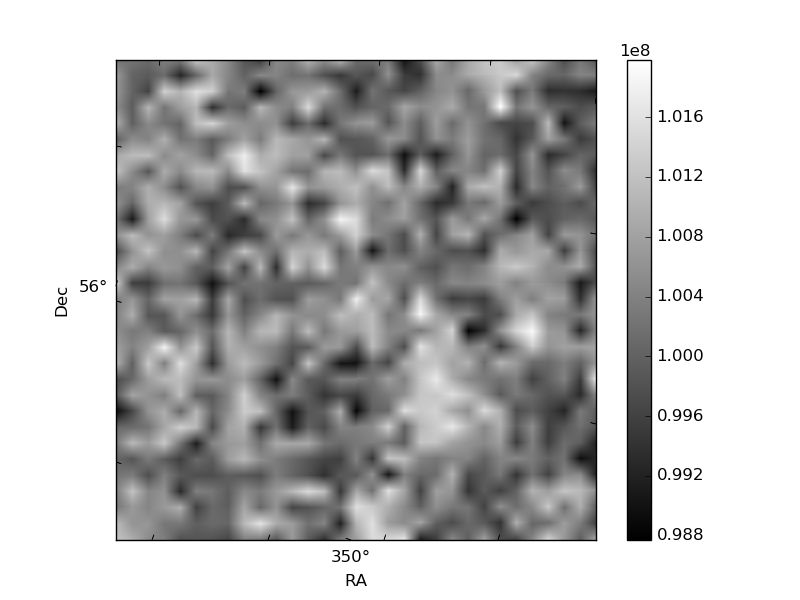
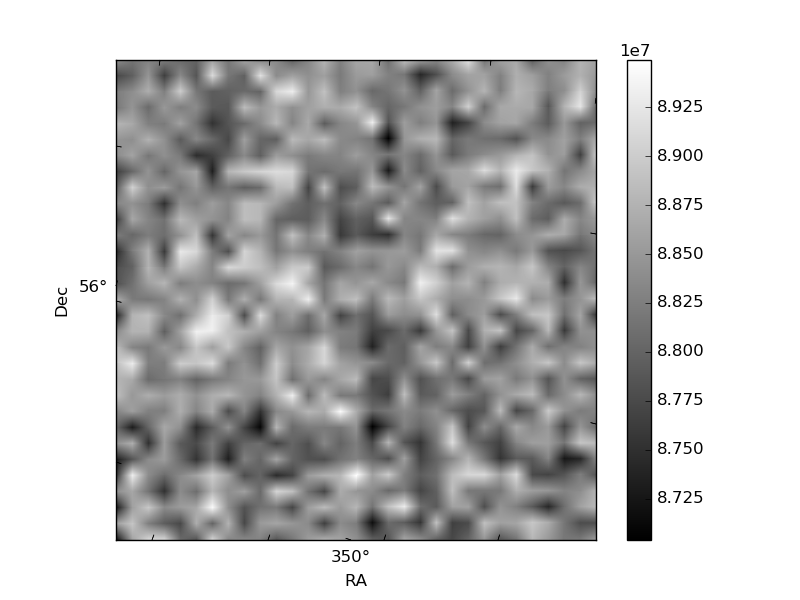
Histogram calculated using DETX and DETY for each event in the final _common_clean file
| Quadrant A | 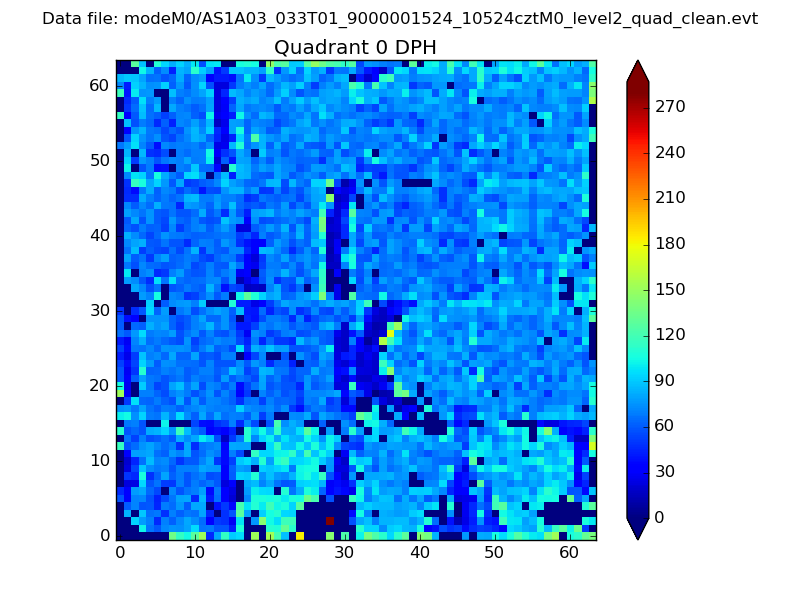 |
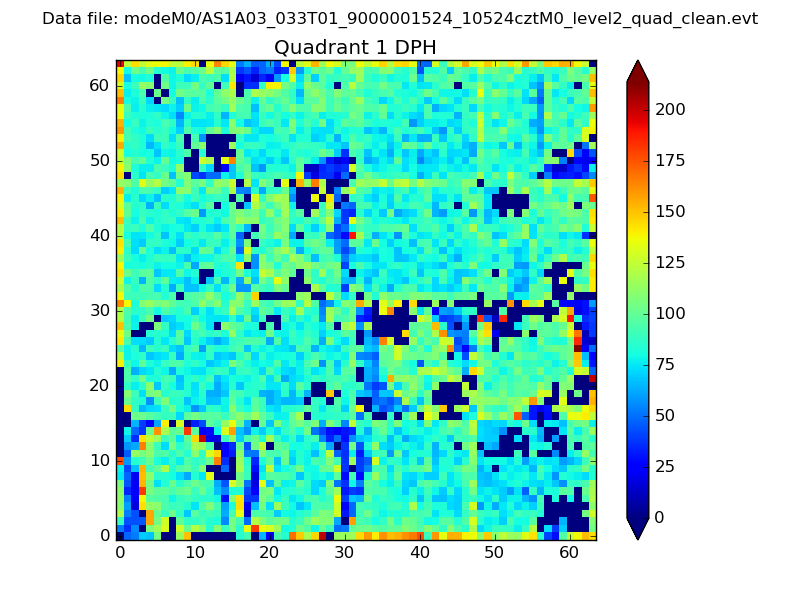 |
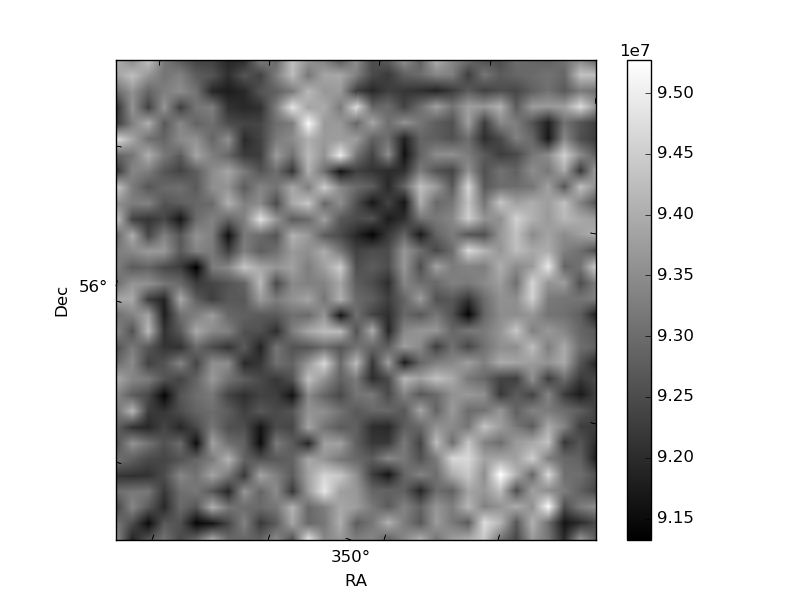
Quadrant B |
|---|---|---|---|
| Quadrant D | 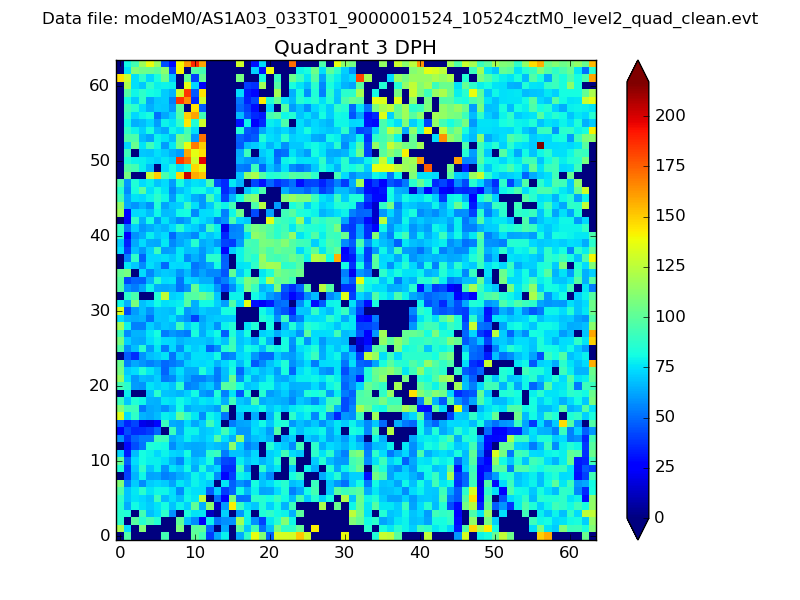 |
 |
Quadrant C |
| Plot type | Count rate plots | Images |
|---|---|---|
| Comparison with Poisson distribution Blue bars denote a histogram of data divided into 1 sec bins. Red curve is a Poisson curve with rate = median count rate of data. |
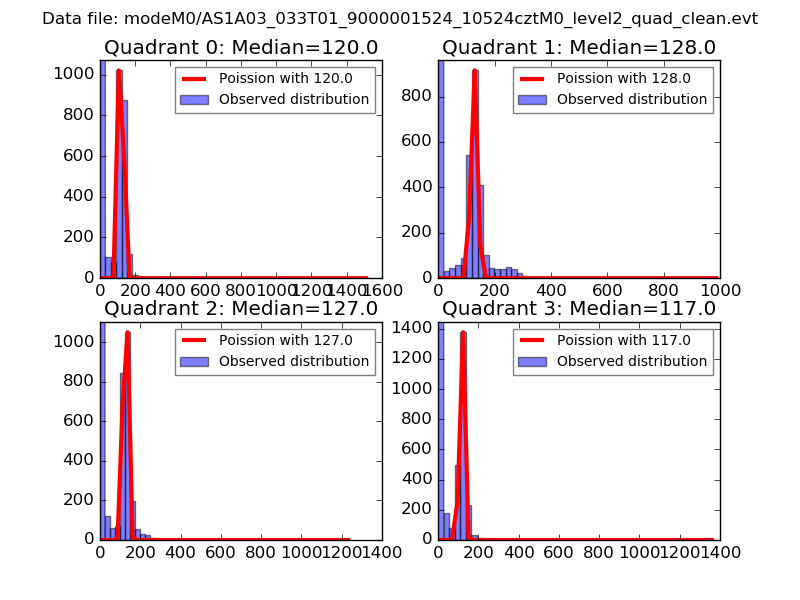 |
 |
| Quadrant-wise count rates Data is divided into 100 sec bins |
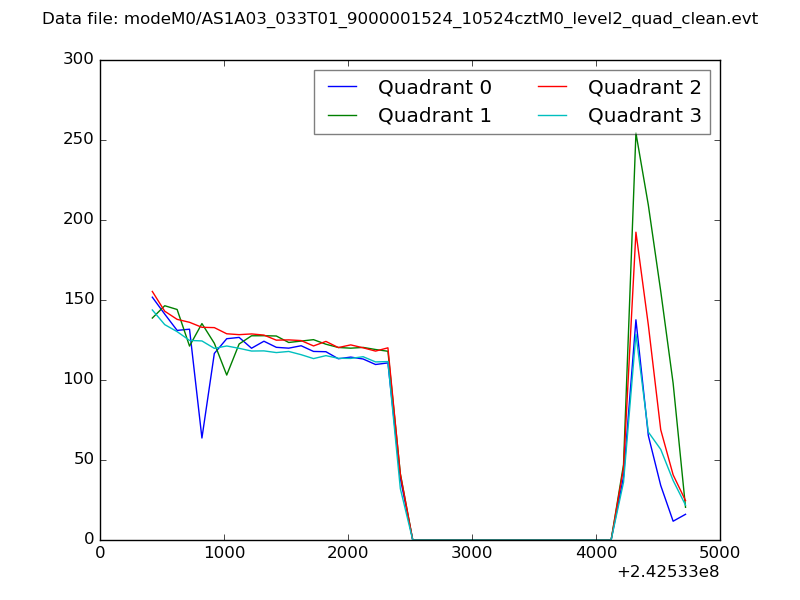 |
|
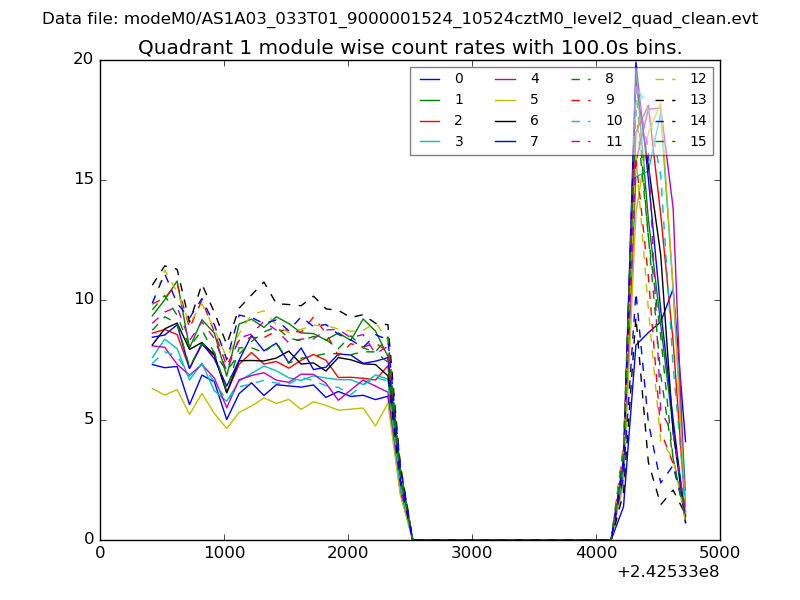
| Module-wise count rates for Quadrant A Data is divided into 100 sec bins |
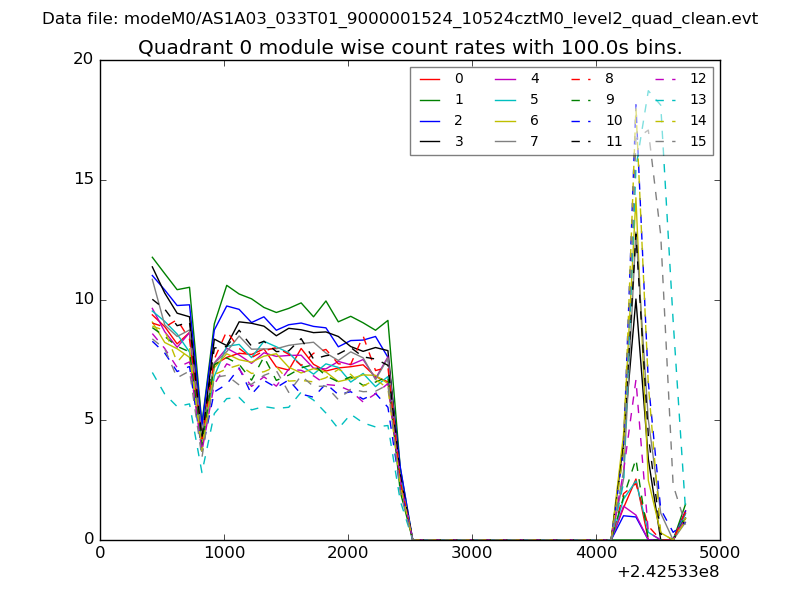 |
 |
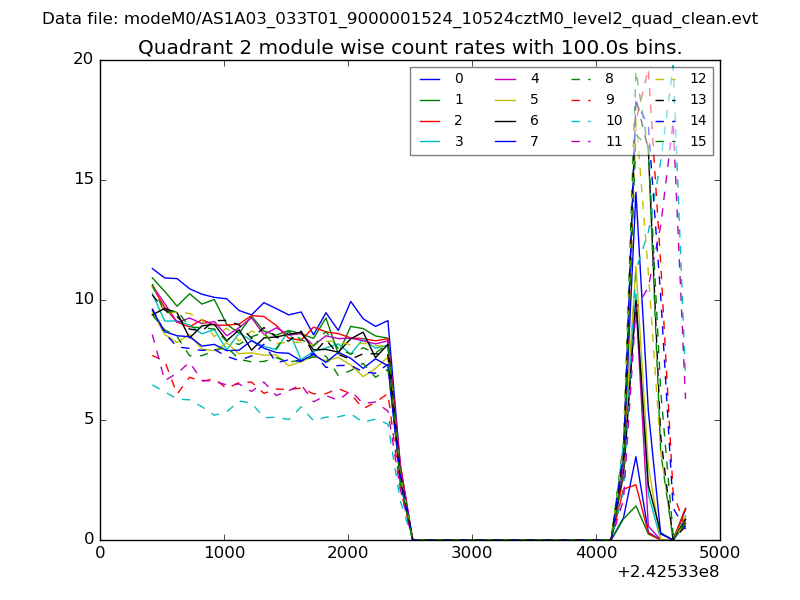
| Module-wise count rates for Quadrant B Data is divided into 100 sec bins |
 |
 |
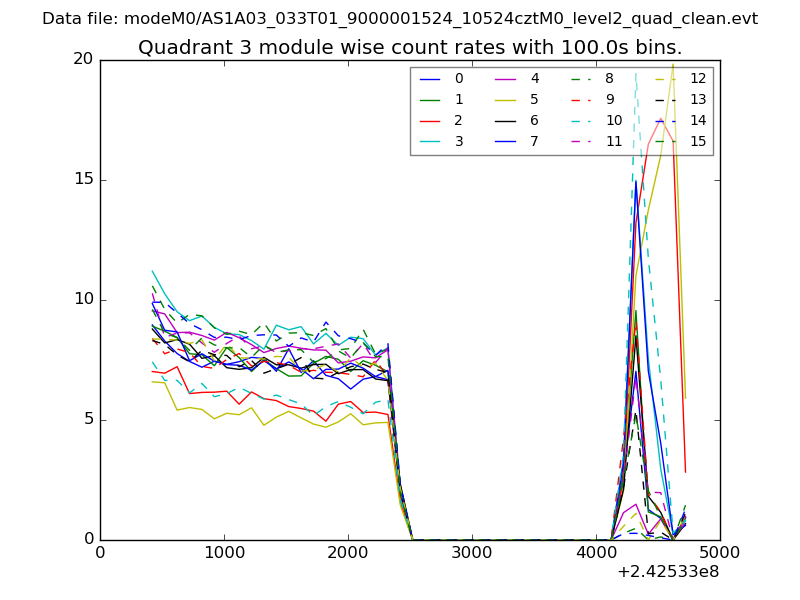
| Module-wise count rates for Quadrant C Data is divided into 100 sec bins |
 |
 |
| Module-wise count rates for Quadrant D Data is divided into 100 sec bins |
 |
 |
| Parameter | Plot |
|---|---|
| CZT HV Monitor | 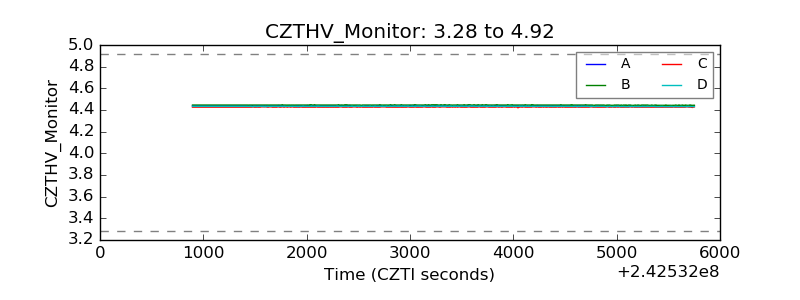 |
| D_VDD | 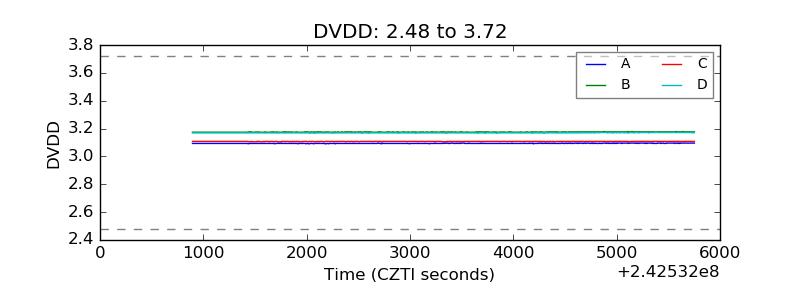 |
| Temperature 1 | 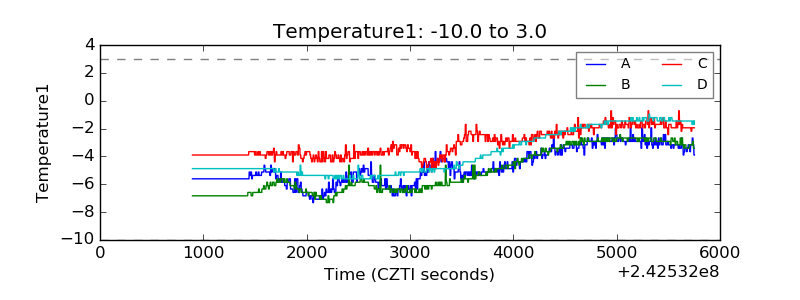 |
| Veto HV Monitor | 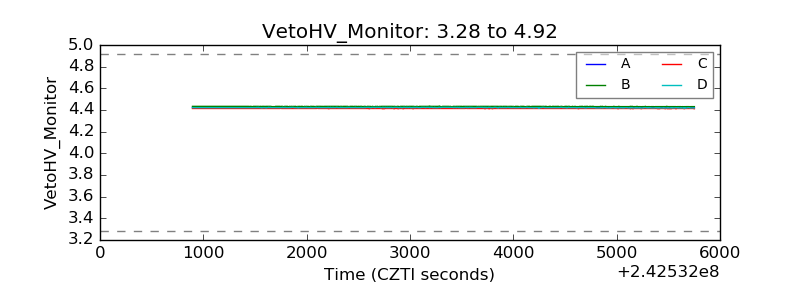 |
| Veto LLD | 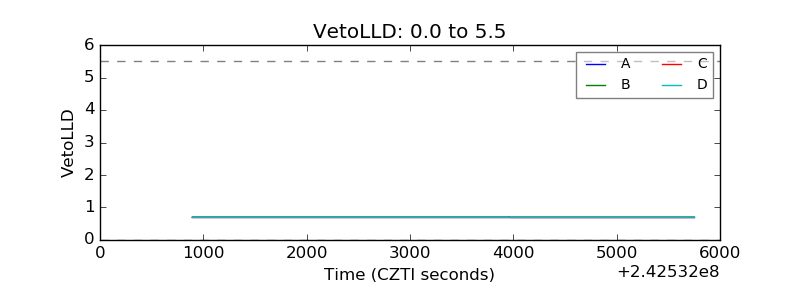 |
| Alpha Counter | 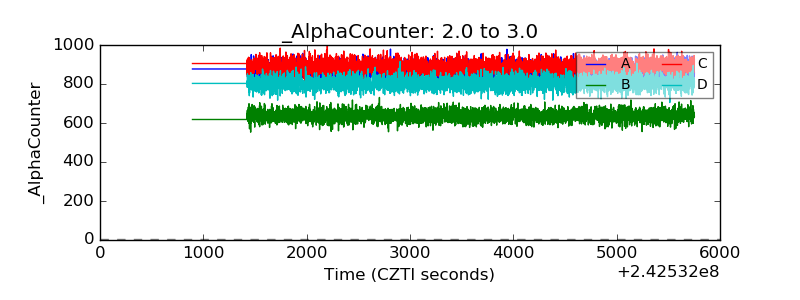 |
| _CPM_Rate | 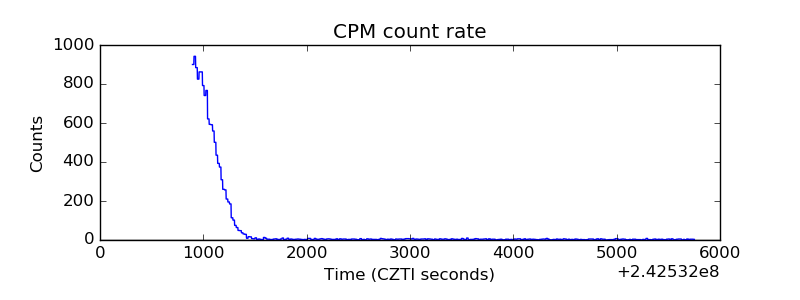 |
| CZT Counter | 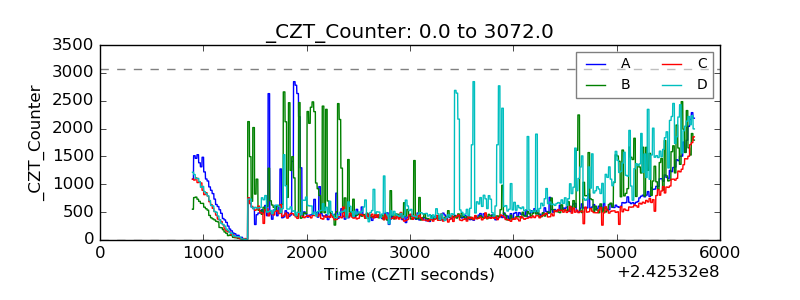 |
| +2.5 Volts monitor | 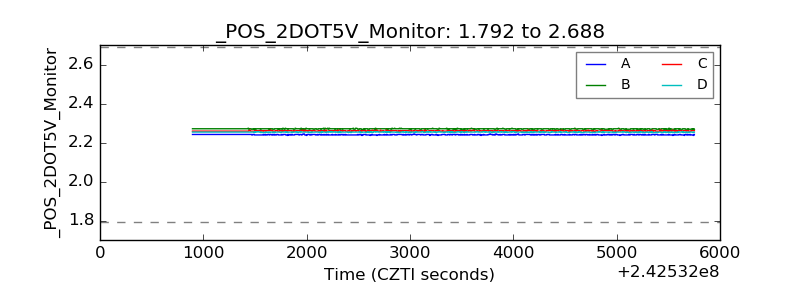 |
| +5 Volts monitor | 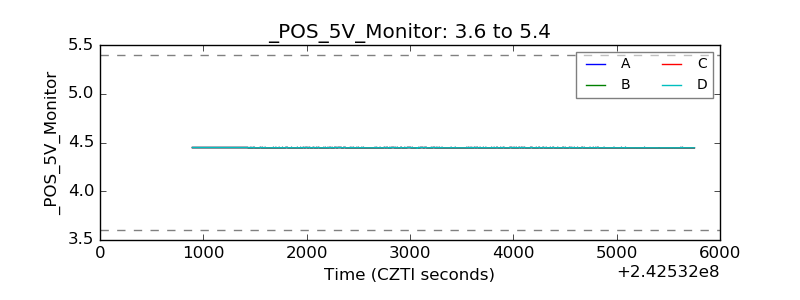 |
| _ROLL_ROT | 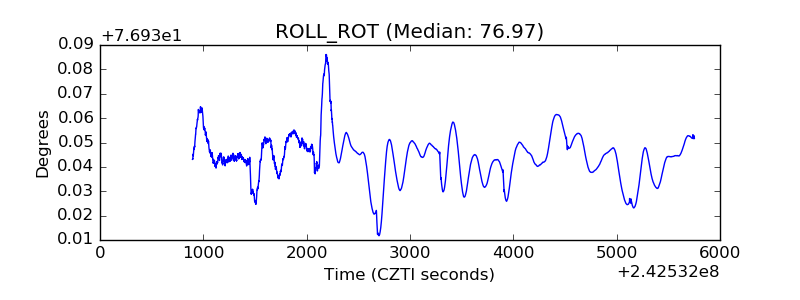 |
| _Roll_DEC | 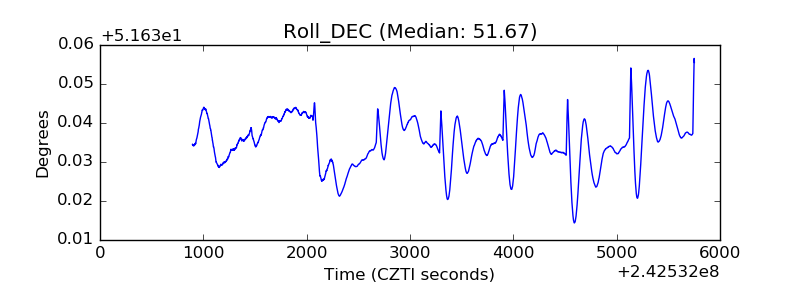 |
| _Roll_RA | 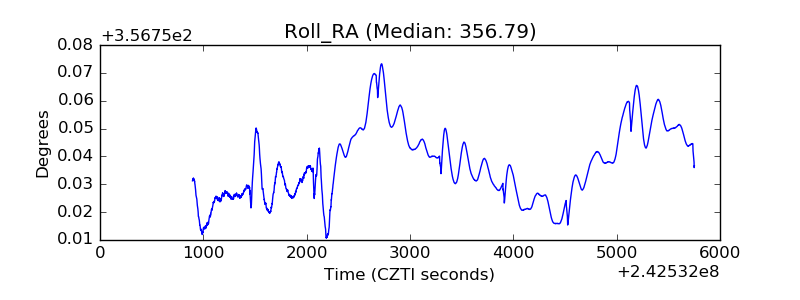 |
| Veto Counter | 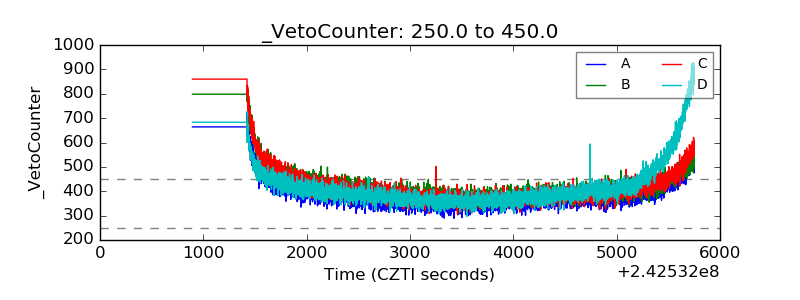 |