| Param | Original file | Final file |
|---|---|---|
| Filename | modeM0/AS1G07_051T02_9000001526_10524cztM0_level2.evt | modeM0/AS1G07_051T02_9000001526_10524cztM0_level2_quad_clean.evt |
| Size (bytes) | 83,678,400 | 24,635,520 |
| Size | 79.8 MB | 23.5 MB |
| Events in quadrant A | 582,275 | 154,119 |
| Events in quadrant B | 574,757 | 155,384 |
| Events in quadrant C | 581,542 | 166,623 |
| Events in quadrant D | 698,973 | 166,962 |
| Mode M9 | |||
|---|---|---|---|
| Quadrant | BADHDUFLAG | Total packets | Discarded packets |
| A | 0 | 18 | 8 |
| B | 0 | 20 | 10 |
| C | 0 | 20 | 10 |
| D | 0 | 18 | 8 |
| Mode M0 | |||
|---|---|---|---|
| Quadrant | BADHDUFLAG | Total packets | Discarded packets |
| A | 0 | 10725 | 8123 |
| B | 0 | 11340 | 8786 |
| C | 0 | 11032 | 8282 |
| D | 0 | 11142 | 8229 |
| Mode SS | |||
|---|---|---|---|
| Quadrant | BADHDUFLAG | Total packets | Discarded packets |
| A | 0 | 84 | 46 |
| B | 0 | 84 | 44 |
| C | 0 | 84 | 46 |
| D | 0 | 81 | 44 |
| Quadrant | Total seconds | Saturated seconds | Saturation percentage |
|---|---|---|---|
| A | 1303 | 4 | 0.306984% |
| B | 1279 | 6 | 0.469116% |
| C | 1377 | 5 | 0.363108% |
| D | 1438 | 4 | 0.278164% |
Noise dominated data is calculated using 1-second bins in cleaned event files. If a bin has >2000 counts, and if more than 50% of those come from <1% of pixels, then it is considered to be noise-dominated and hence unusable.
| Quadrant | # 1 sec bins | Bins with >0 counts | Bins with >2000 counts | High rate bins dominated by noise | Noise dominated (total time) | Noise dominated (detector-on time) | Marked lightcurve |
|---|---|---|---|---|---|---|---|
| A | 2967 | 1560 | 0 | 0 | 0.00% | 0.00% | 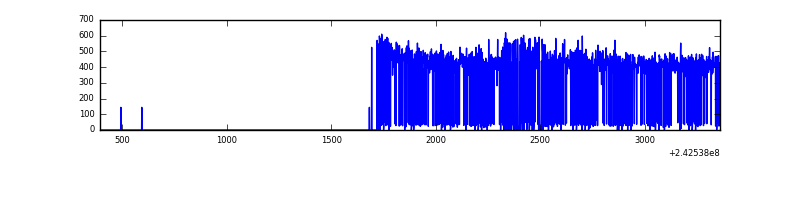 |
| B | 2967 | 1522 | 0 | 0 | 0.00% | 0.00% | 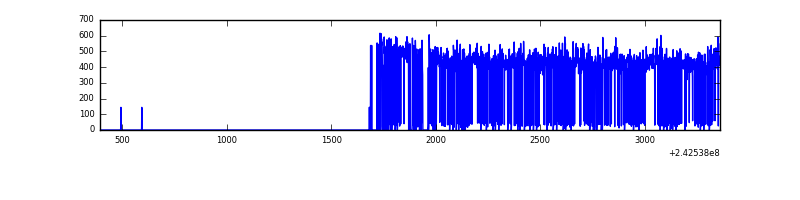 |
| C | 2966 | 1603 | 0 | 0 | 0.00% | 0.00% | 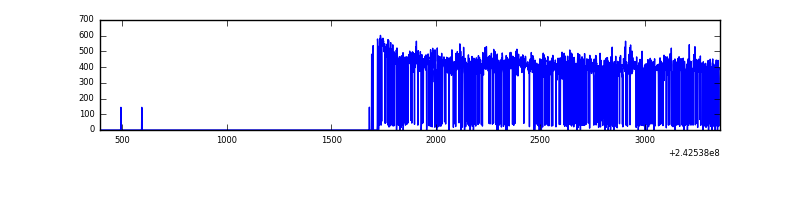 |
| D | 2965 | 1532 | 0 | 0 | 0.00% | 0.00% | 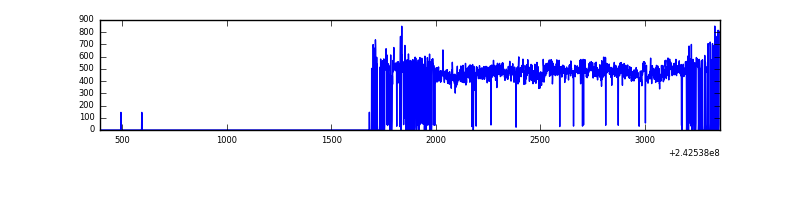 |
Top three noisy pixels from each quadrant. If the there are fewer than three noisy pixels in the level2.evt file, extra rows are filled as -1
| Pixel properties | Quadrant properties | ||||||
|---|---|---|---|---|---|---|---|
| Quadrant | DetID | PixID | Counts | Sigma | Mean | Median | Sigma |
| A | 13 | 251 | 12825 | 404.88 | 144 | 141 | 31.3 |
| A | 3 | 80 | 9229 | 290.09 | 144 | 141 | 31.3 |
| A | 0 | 226 | 1356 | 38.78 | 144 | 141 | 31.3 |
| B | 4 | 239 | 8969 | 299.93 | 143 | 139 | 29.4 |
| B | 4 | 81 | 4811 | 158.69 | 143 | 139 | 29.4 |
| B | 12 | 111 | 3099 | 100.54 | 143 | 139 | 29.4 |
| C | 13 | 61 | 1133 | 27.04 | 148 | 148 | 36.4 |
| C | 14 | 234 | 692 | 14.94 | 148 | 148 | 36.4 |
| C | 14 | 67 | 566 | 11.48 | 148 | 148 | 36.4 |
| D | 8 | 195 | 86105 | 2261.74 | 153 | 148 | 38.0 |
| D | 2 | 16 | 23744 | 620.87 | 153 | 148 | 38.0 |
| D | 1 | 52 | 4527 | 115.22 | 153 | 148 | 38.0 |
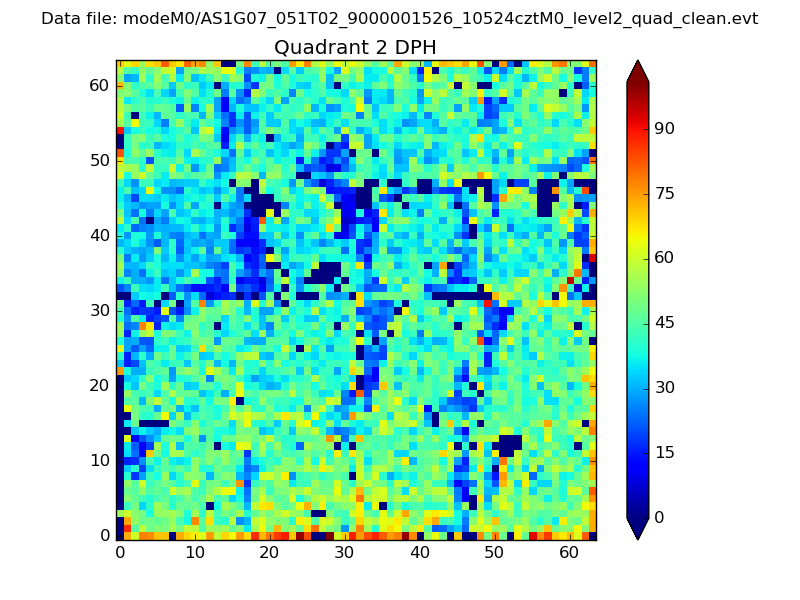
Histogram calculated using DETX and DETY for each event in the final _common_clean file
| Quadrant A | 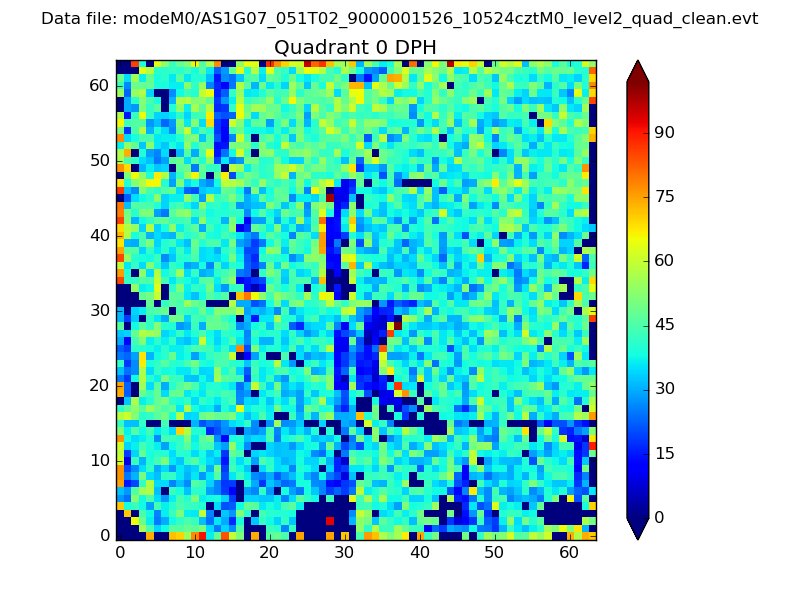 |
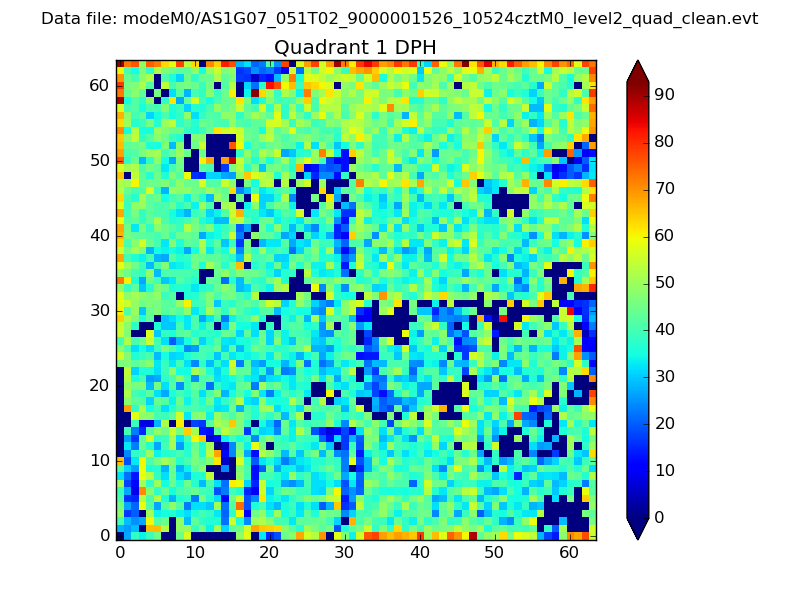 |
Quadrant B |
|---|---|---|---|
| Quadrant D | 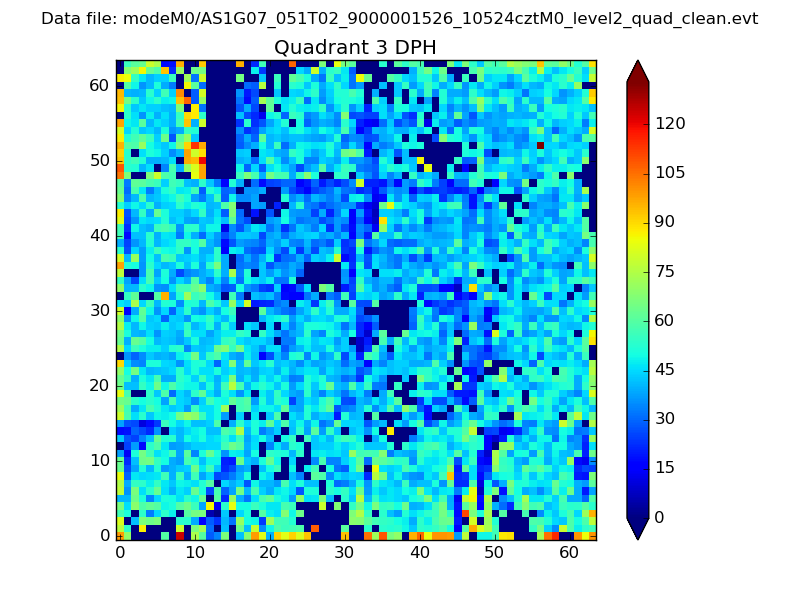 |
 |
Quadrant C |
| Plot type | Count rate plots | Images |
|---|---|---|
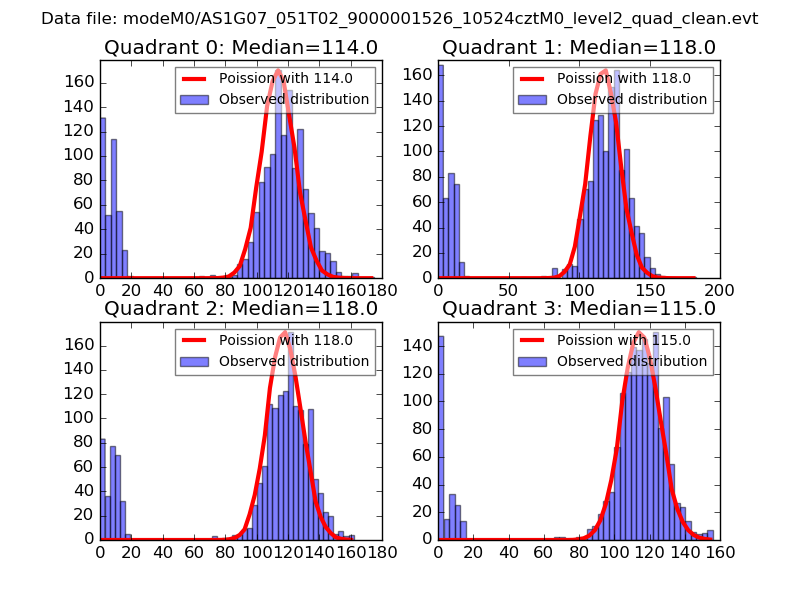
| Comparison with Poisson distribution Blue bars denote a histogram of data divided into 1 sec bins. Red curve is a Poisson curve with rate = median count rate of data. |
 |
 |
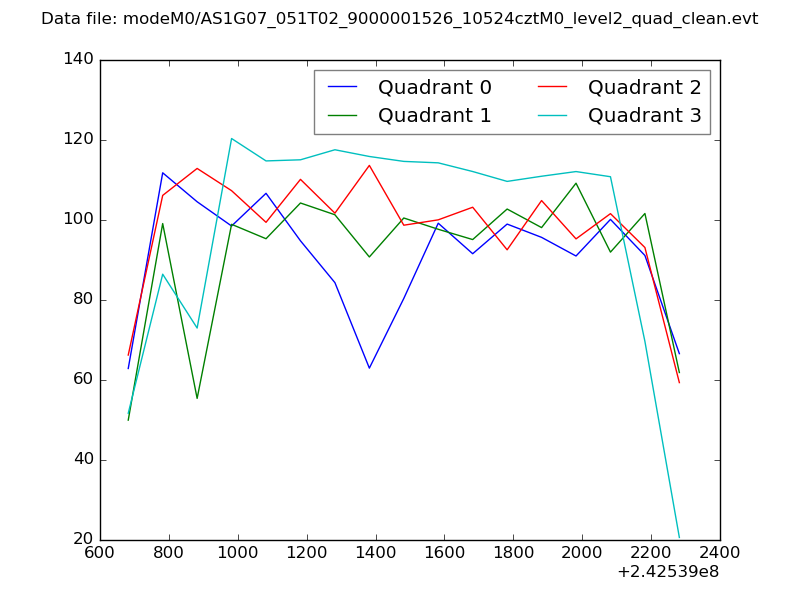
| Quadrant-wise count rates Data is divided into 100 sec bins |
 |
|
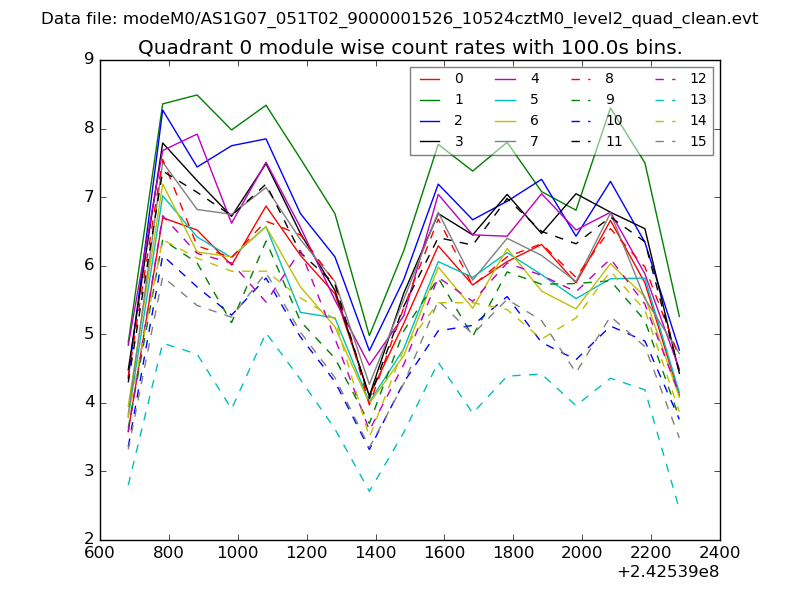
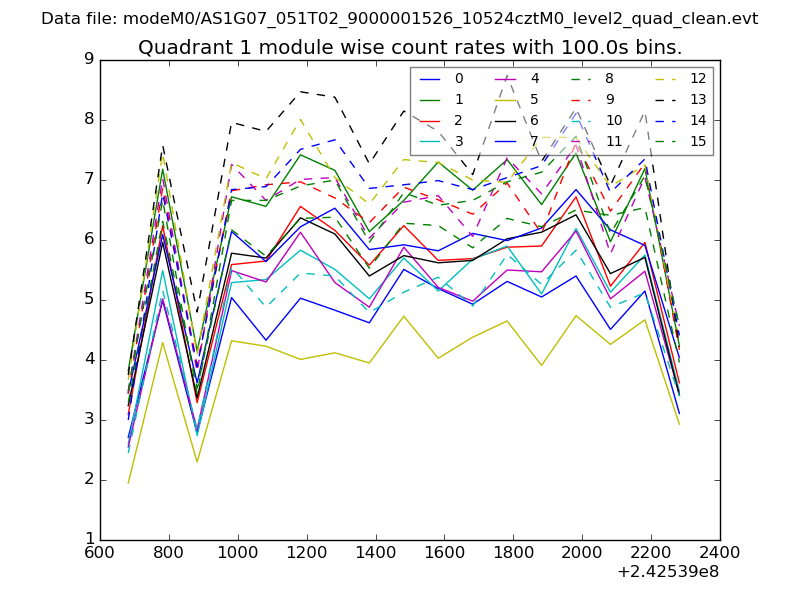
| Module-wise count rates for Quadrant A Data is divided into 100 sec bins |
 |
 |
| Module-wise count rates for Quadrant B Data is divided into 100 sec bins |
 |
 |
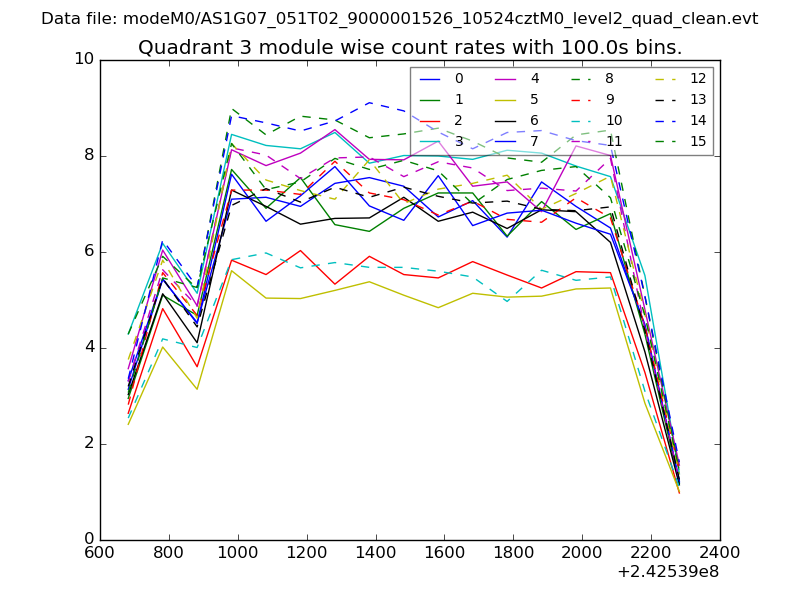
| Module-wise count rates for Quadrant C Data is divided into 100 sec bins |
 |
 |
| Module-wise count rates for Quadrant D Data is divided into 100 sec bins |
 |
 |
| Parameter | Plot |
|---|---|
| CZT HV Monitor |  |
| D_VDD | 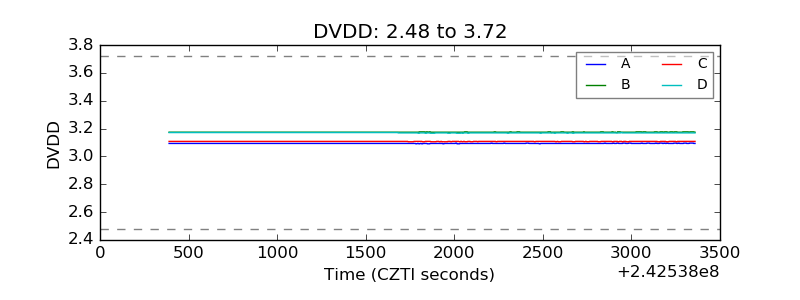 |
| Temperature 1 | 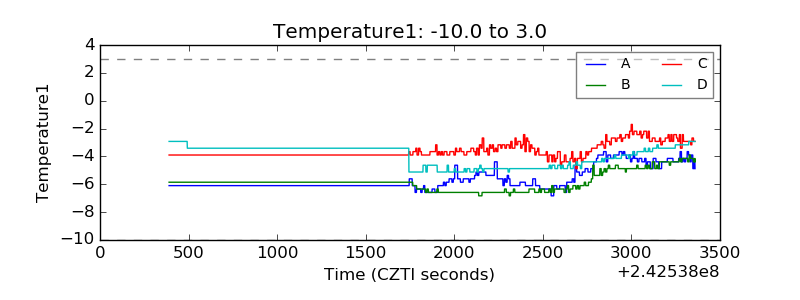 |
| Veto HV Monitor | 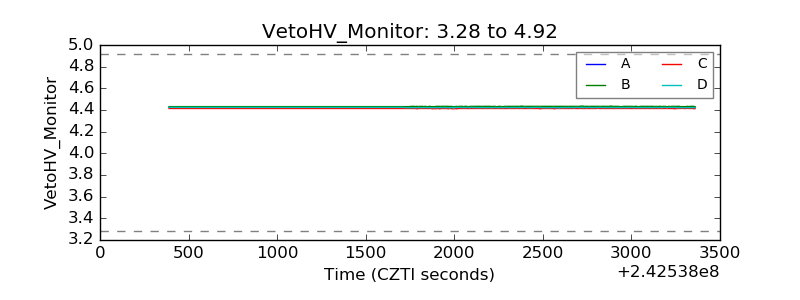 |
| Veto LLD | 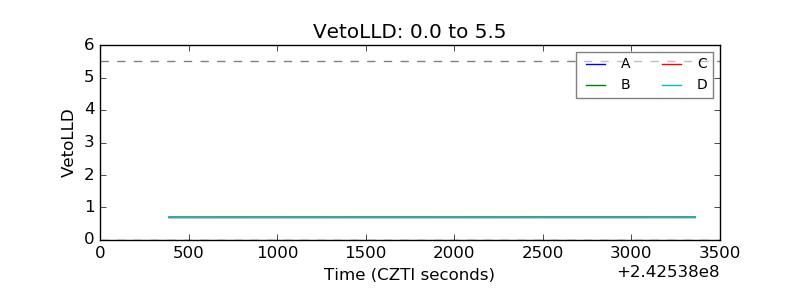 |
| Alpha Counter | 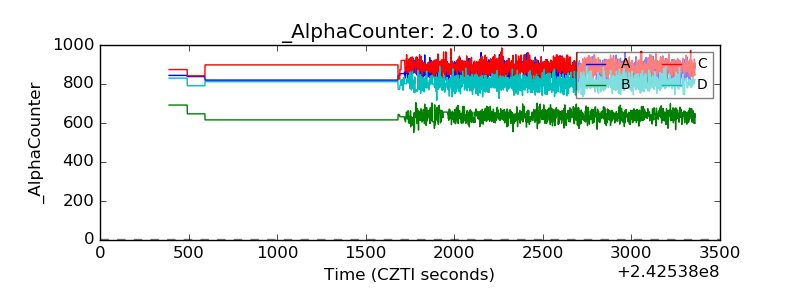 |
| _CPM_Rate | 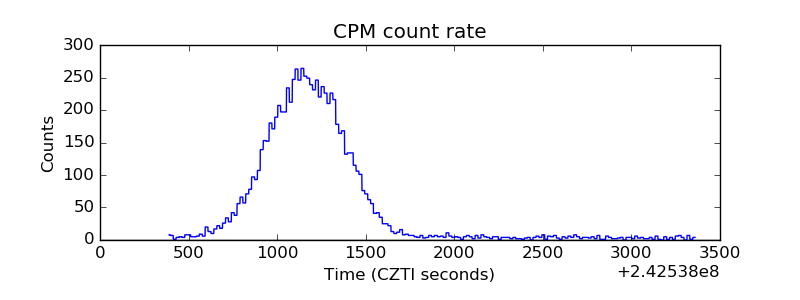 |
| CZT Counter | 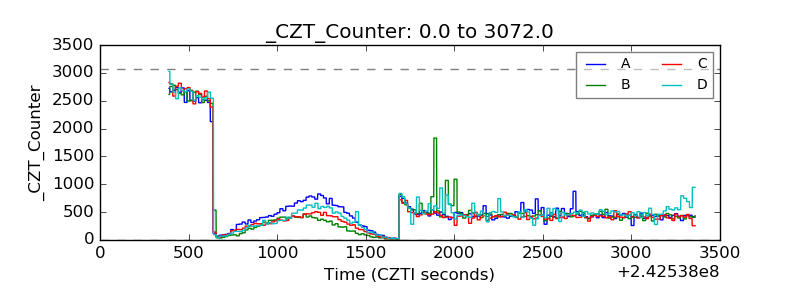 |
| +2.5 Volts monitor |  |
| +5 Volts monitor |  |
| _ROLL_ROT | 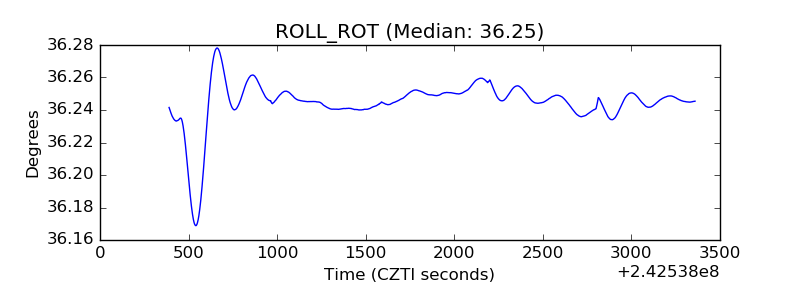 |
| _Roll_DEC | 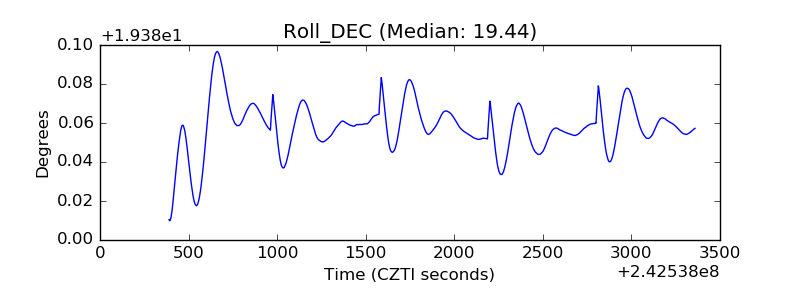 |
| _Roll_RA | 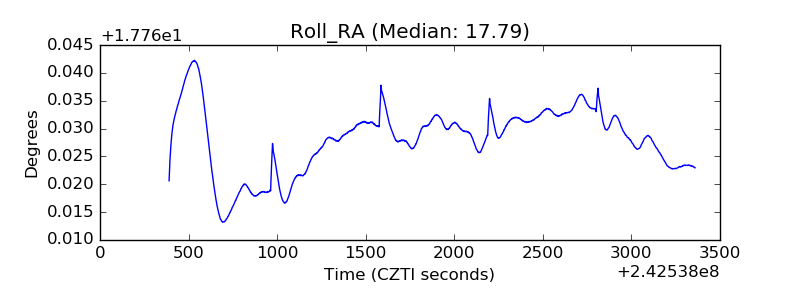 |
| Veto Counter | 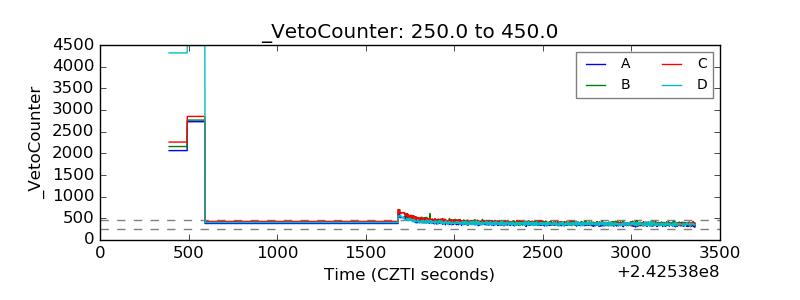 |