| Param | Original file | Final file |
|---|---|---|
| Filename | modeM0/AS1G07_051T02_9000001526_10536cztM0_level2.evt | modeM0/AS1G07_051T02_9000001526_10536cztM0_level2_quad_clean.evt |
| Size (bytes) | 1,871,683,200 | 239,402,880 |
| Size | 1.7 GB | 228.3 MB |
| Events in quadrant A | 11,961,744 | 1,476,621 |
| Events in quadrant B | 15,555,896 | 1,468,728 |
| Events in quadrant C | 11,722,645 | 1,455,890 |
| Events in quadrant D | 16,047,895 | 1,420,091 |
| Mode M9 | |||
|---|---|---|---|
| Quadrant | BADHDUFLAG | Total packets | Discarded packets |
| A | 0 | 14 | 0 |
| B | 0 | 14 | 0 |
| C | 0 | 14 | 0 |
| D | 0 | 14 | 0 |
| Mode M0 | |||
|---|---|---|---|
| Quadrant | BADHDUFLAG | Total packets | Discarded packets |
| A | 0 | 50241 | 3 |
| B | 0 | 60494 | 3 |
| C | 0 | 50025 | 3 |
| D | 0 | 61664 | 3 |
| Mode SS | |||
|---|---|---|---|
| Quadrant | BADHDUFLAG | Total packets | Discarded packets |
| A | 0 | 422 | 0 |
| B | 0 | 422 | 0 |
| C | 0 | 422 | 0 |
| D | 0 | 422 | 0 |
| Quadrant | Total seconds | Saturated seconds | Saturation percentage |
|---|---|---|---|
| A | 20719 | 1417 | 6.839133% |
| B | 20719 | 1947 | 9.397172% |
| C | 20719 | 1294 | 6.245475% |
| D | 20719 | 1566 | 7.558280% |
Noise dominated data is calculated using 1-second bins in cleaned event files. If a bin has >2000 counts, and if more than 50% of those come from <1% of pixels, then it is considered to be noise-dominated and hence unusable.
| Quadrant | # 1 sec bins | Bins with >0 counts | Bins with >2000 counts | High rate bins dominated by noise | Noise dominated (total time) | Noise dominated (detector-on time) | Marked lightcurve |
|---|---|---|---|---|---|---|---|
| A | 22124 | 20722 | 1118 | 1118 | 5.05% | 5.40% | 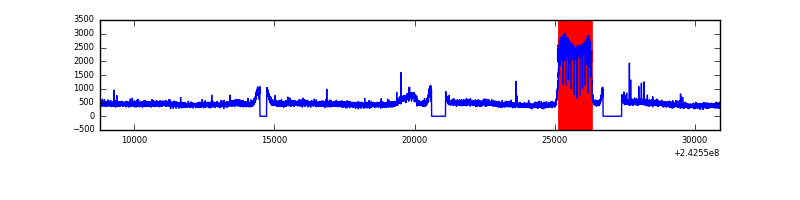 |
| B | 22124 | 20722 | 1402 | 1402 | 6.34% | 6.77% | 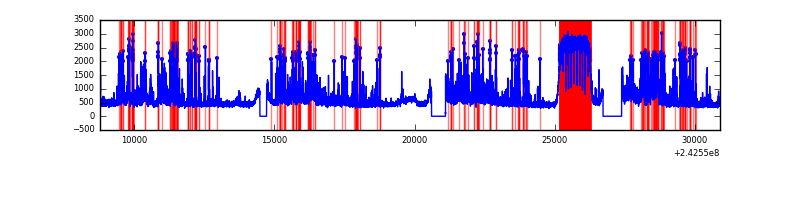 |
| C | 22124 | 20722 | 1056 | 1056 | 4.77% | 5.10% | 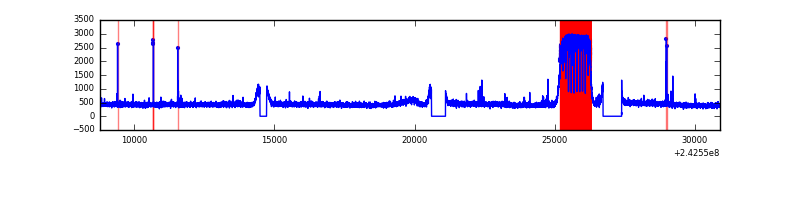 |
| D | 22124 | 20722 | 1329 | 1329 | 6.01% | 6.41% | 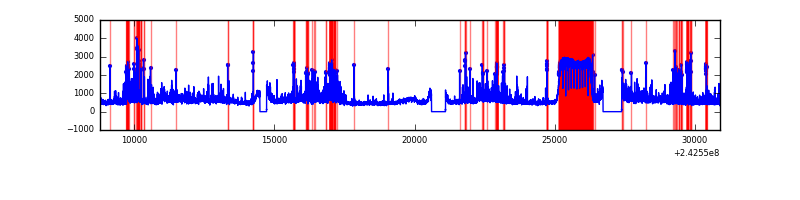 |
Top three noisy pixels from each quadrant. If the there are fewer than three noisy pixels in the level2.evt file, extra rows are filled as -1
| Pixel properties | Quadrant properties | ||||||
|---|---|---|---|---|---|---|---|
| Quadrant | DetID | PixID | Counts | Sigma | Mean | Median | Sigma |
| A | 3 | 80 | 150478 | 216.63 | 3036 | 3004 | 680.8 |
| A | 13 | 251 | 37940 | 51.32 | 3036 | 3004 | 680.8 |
| A | 0 | 226 | 26441 | 34.43 | 3036 | 3004 | 680.8 |
| B | 4 | 239 | 3132612 | 4500.62 | 3037 | 2979 | 695.4 |
| B | 0 | 214 | 359306 | 512.42 | 3037 | 2979 | 695.4 |
| B | 11 | 51 | 234979 | 333.63 | 3037 | 2979 | 695.4 |
| C | 15 | 48 | 58403 | 67.56 | 2978 | 3003 | 820.0 |
| C | 14 | 234 | 55705 | 64.27 | 2978 | 3003 | 820.0 |
| C | 13 | 61 | 20498 | 21.34 | 2978 | 3003 | 820.0 |
| D | 2 | 16 | 1869618 | 2245.77 | 3001 | 2959 | 831.2 |
| D | 8 | 195 | 1499196 | 1800.12 | 3001 | 2959 | 831.2 |
| D | 1 | 52 | 553795 | 662.71 | 3001 | 2959 | 831.2 |
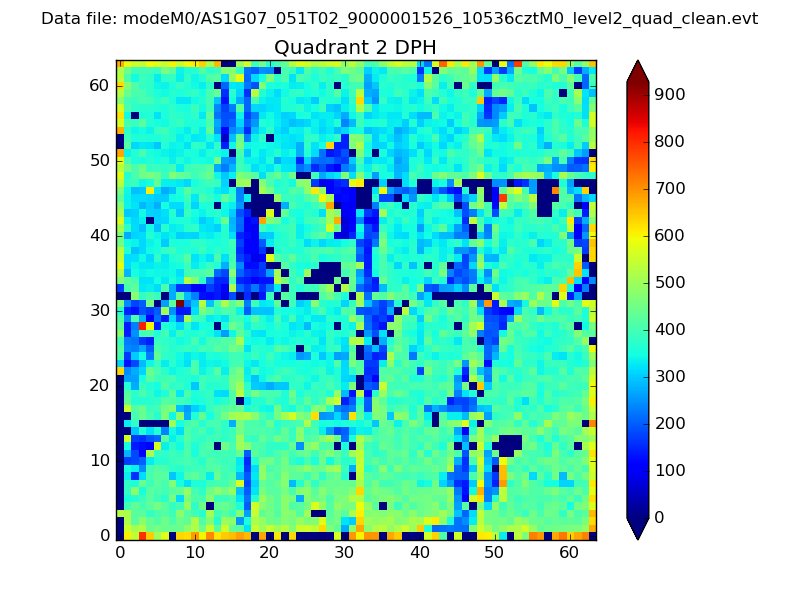
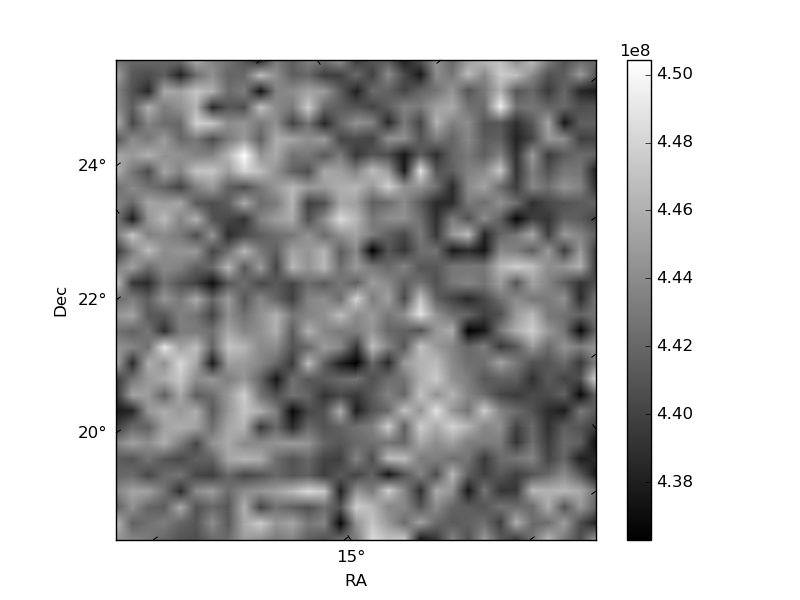
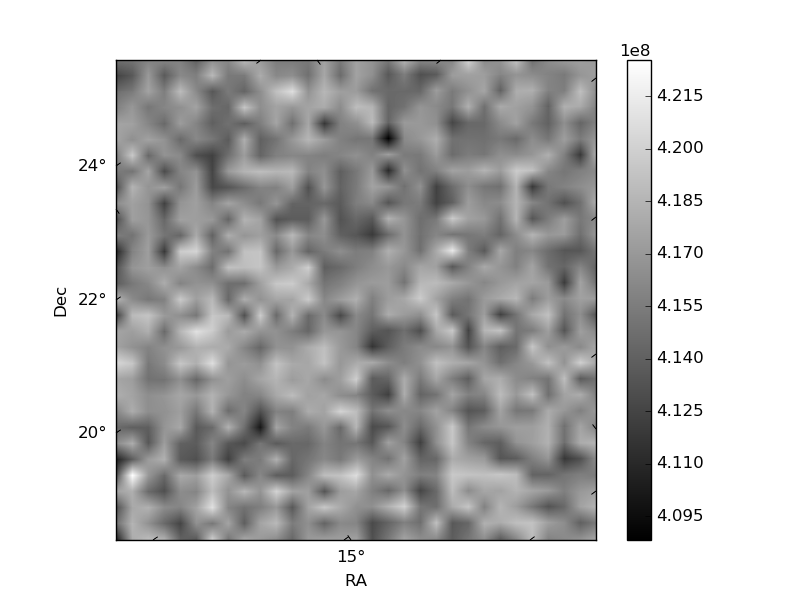
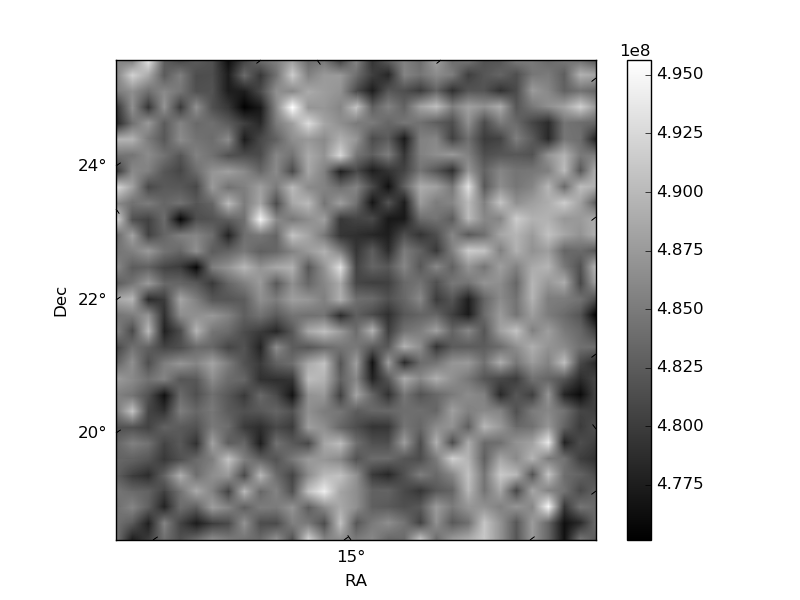
Histogram calculated using DETX and DETY for each event in the final _common_clean file
| Quadrant A |  |
 |
Quadrant B |
|---|---|---|---|
| Quadrant D | 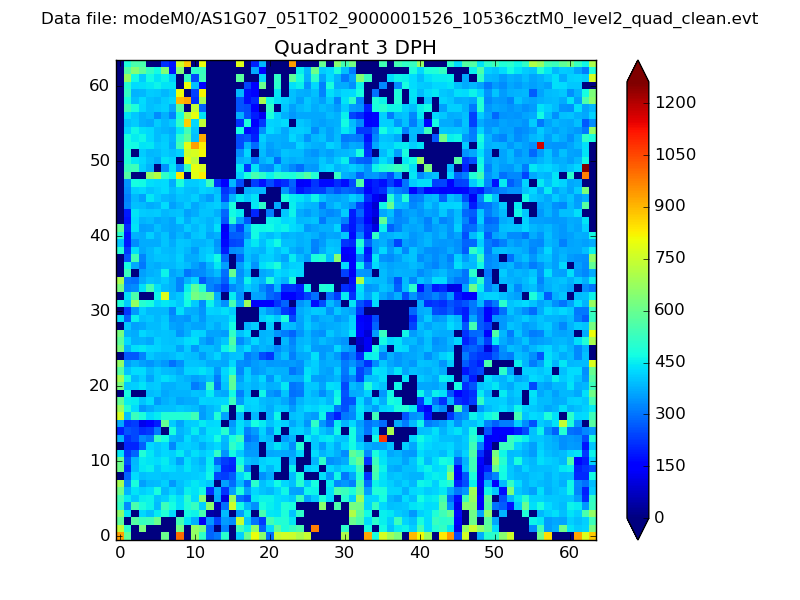 |
 |
Quadrant C |
| Plot type | Count rate plots | Images |
|---|---|---|
| Comparison with Poisson distribution Blue bars denote a histogram of data divided into 1 sec bins. Red curve is a Poisson curve with rate = median count rate of data. |
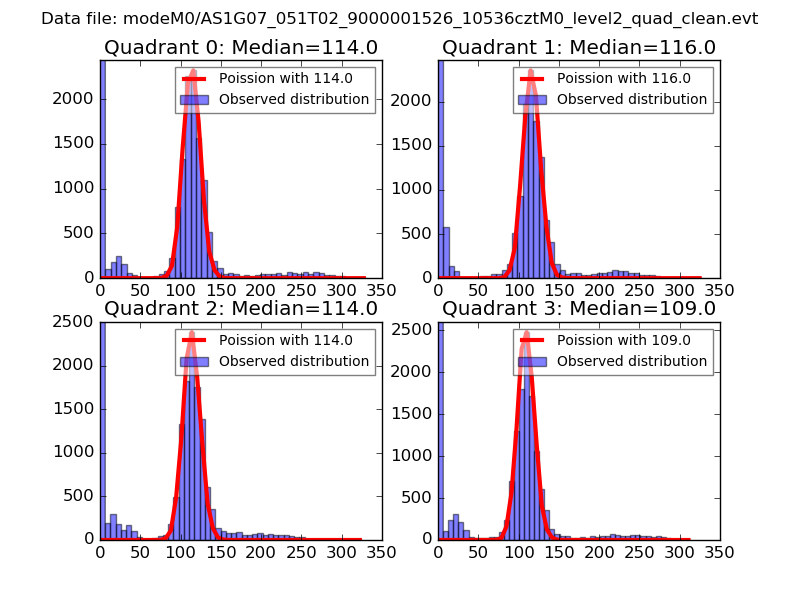 |
 |
| Quadrant-wise count rates Data is divided into 100 sec bins |
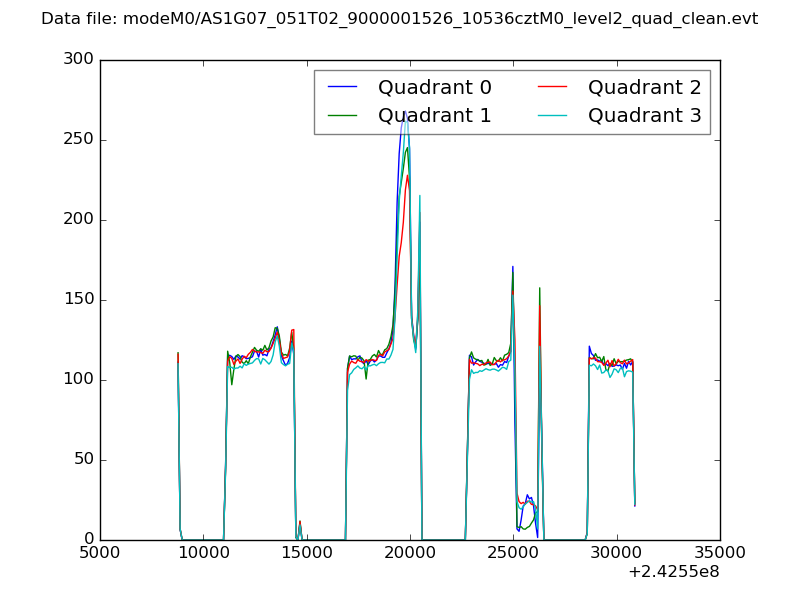 |
|
| Module-wise count rates for Quadrant A Data is divided into 100 sec bins |
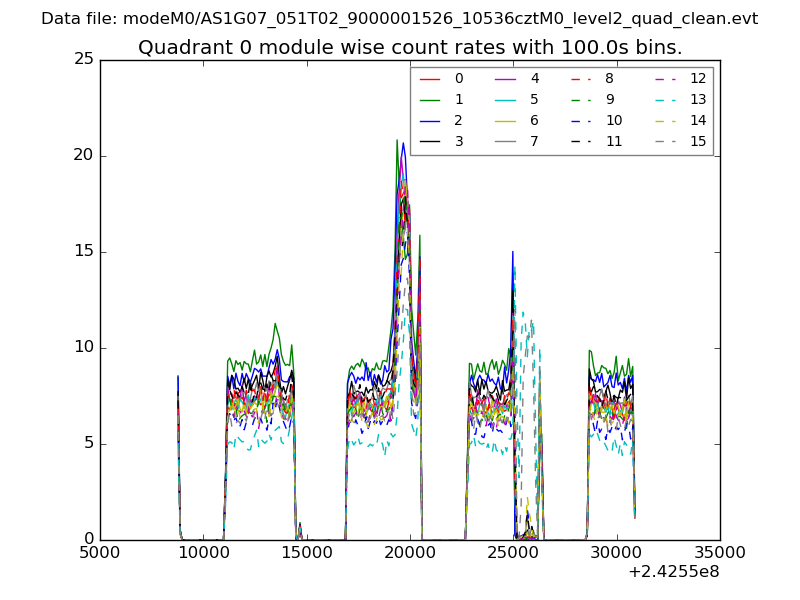 |
 |
| Module-wise count rates for Quadrant B Data is divided into 100 sec bins |
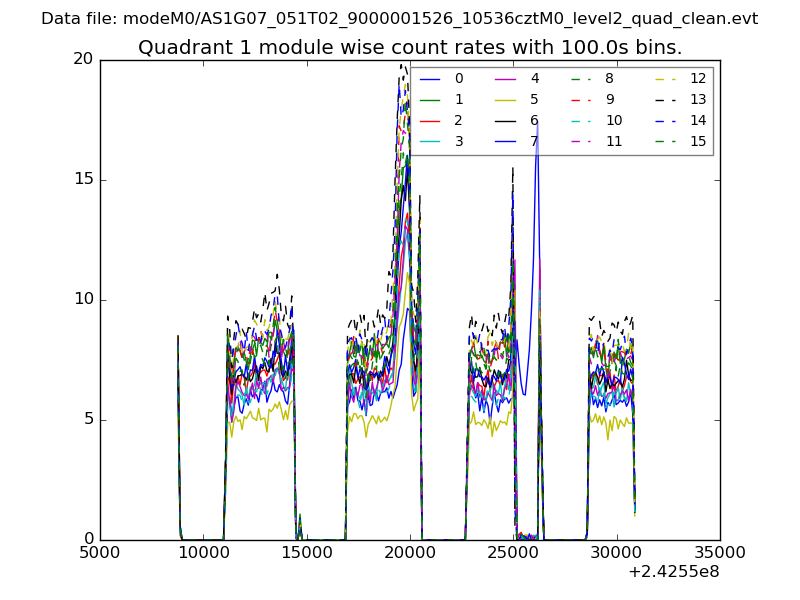 |
 |
| Module-wise count rates for Quadrant C Data is divided into 100 sec bins |
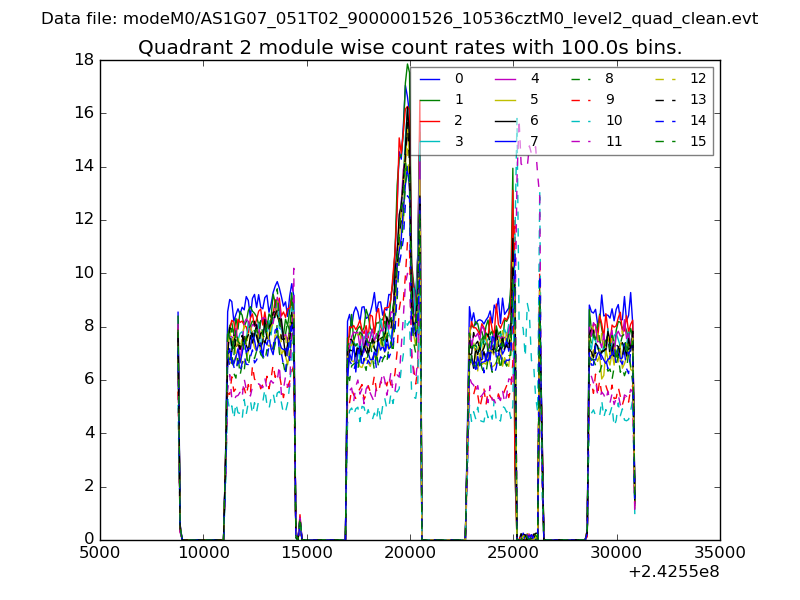 |
 |
| Module-wise count rates for Quadrant D Data is divided into 100 sec bins |
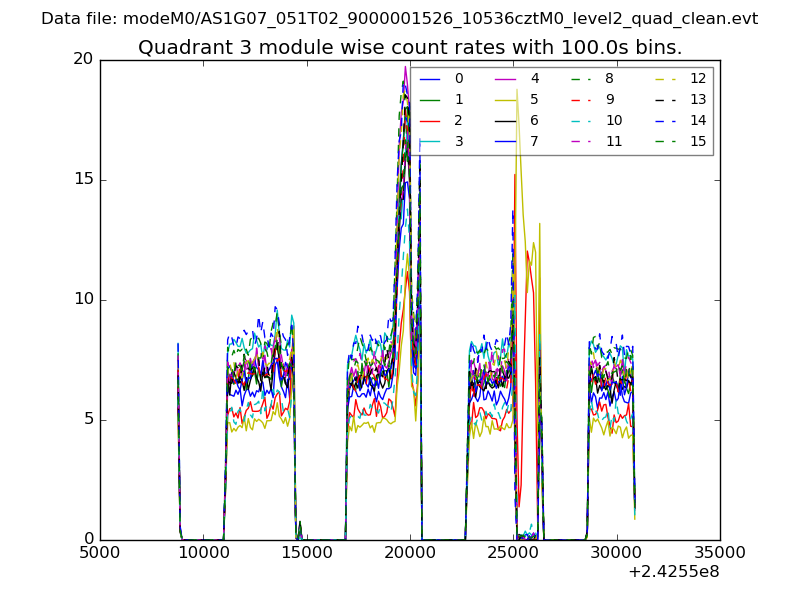 |
 |
| Parameter | Plot |
|---|---|
| CZT HV Monitor | 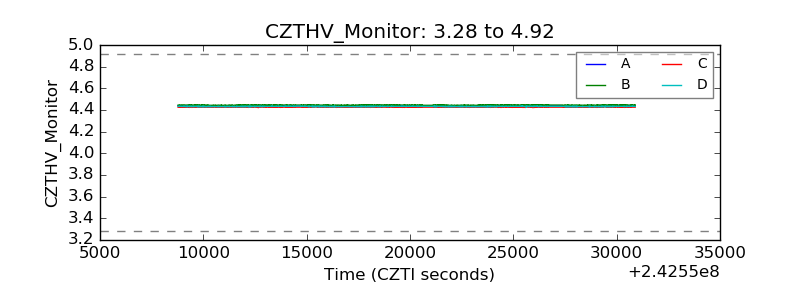 |
| D_VDD | 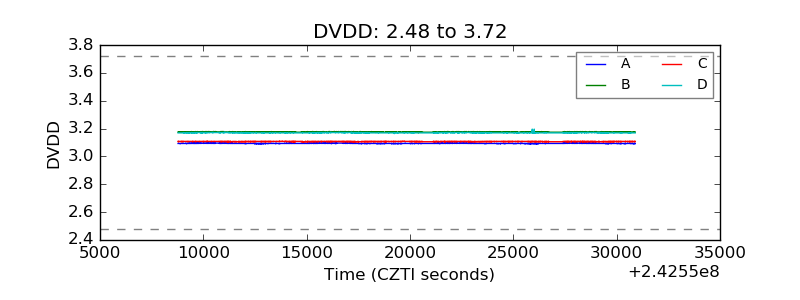 |
| Temperature 1 | 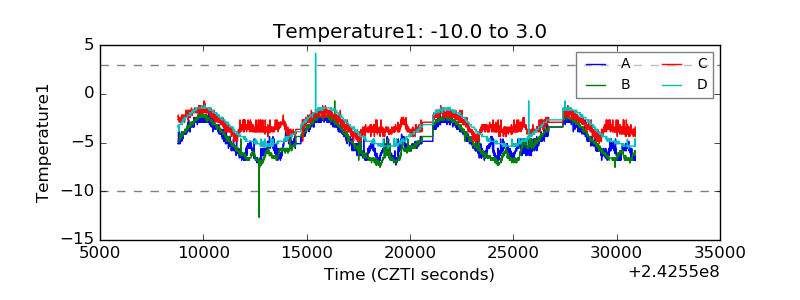 |
| Veto HV Monitor | 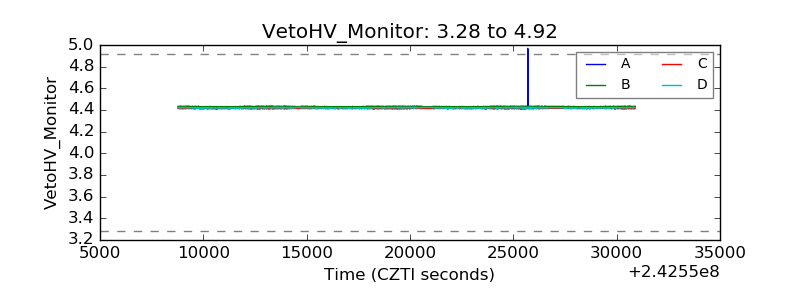 |
| Veto LLD | 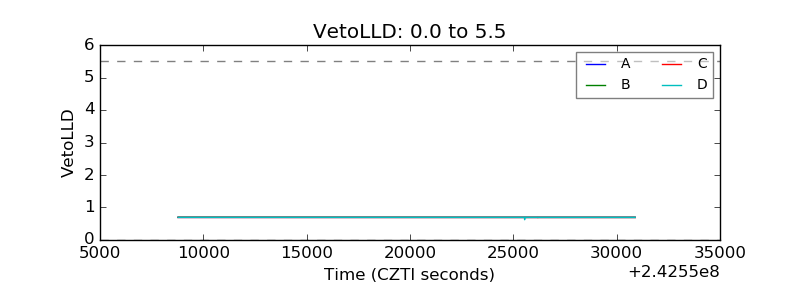 |
| Alpha Counter | 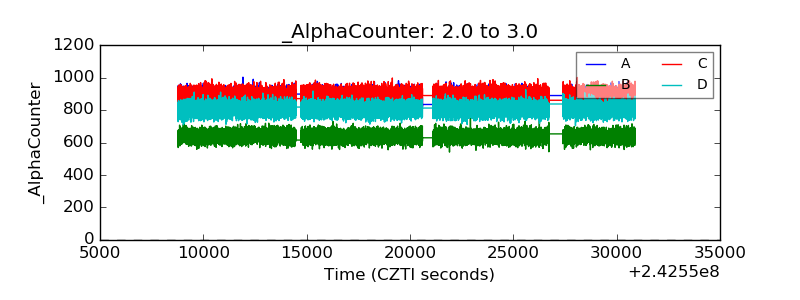 |
| _CPM_Rate | 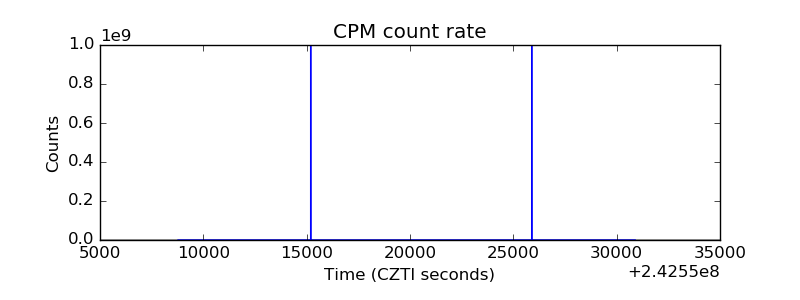 |
| CZT Counter | 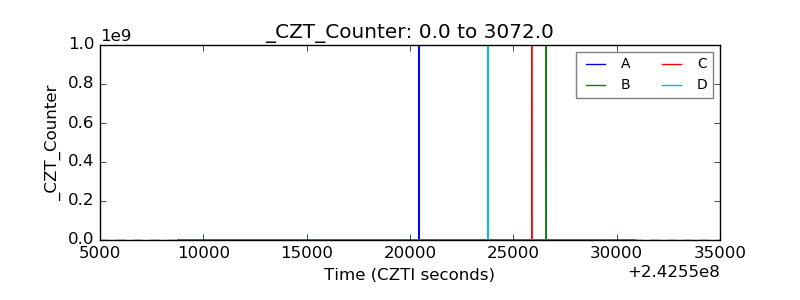 |
| +2.5 Volts monitor |  |
| +5 Volts monitor | 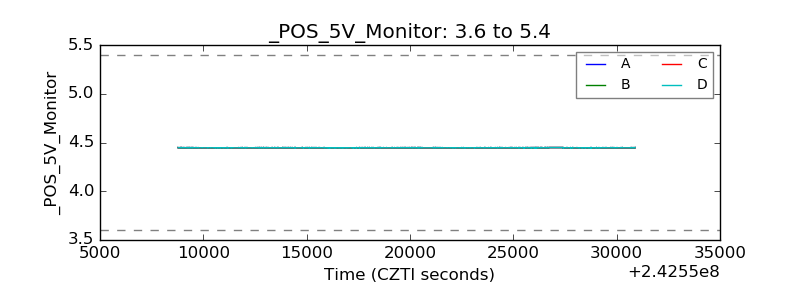 |
| _ROLL_ROT | 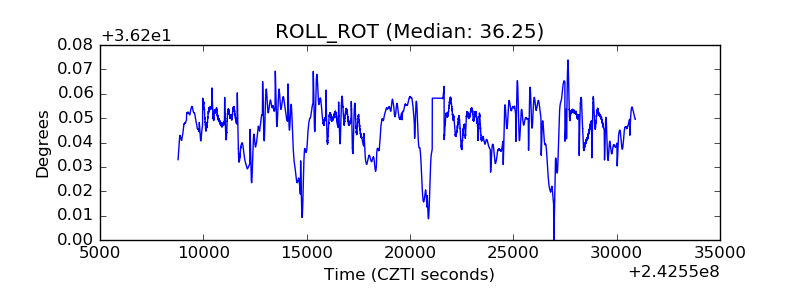 |
| _Roll_DEC | 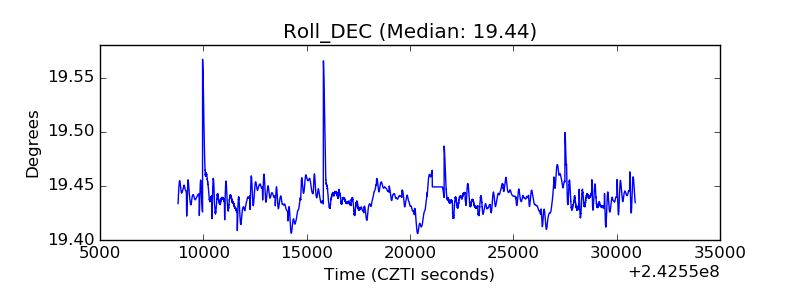 |
| _Roll_RA | 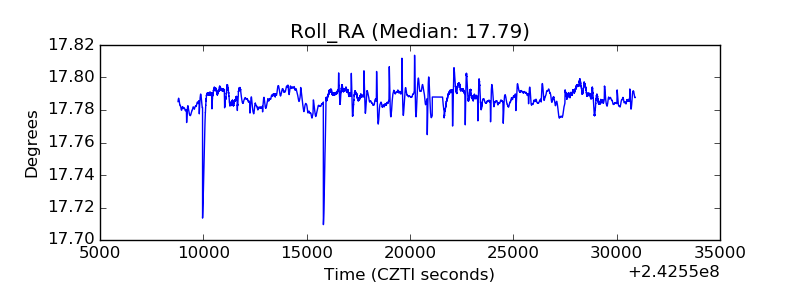 |
| Veto Counter | 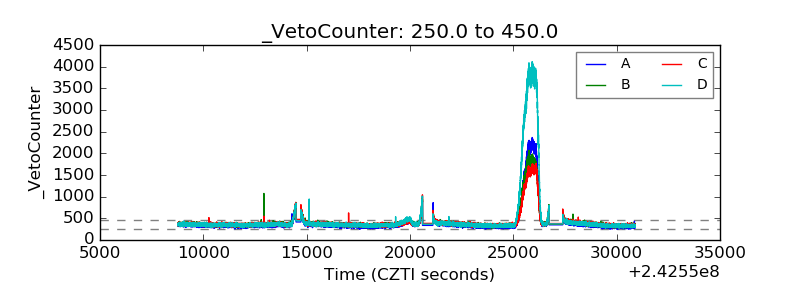 |