| Param | Original file | Final file |
|---|---|---|
| Filename | modeM0/AS1A03_107T01_9000001530cztM0_level2.fits | modeM0/AS1A03_107T01_9000001530cztM0_level2_quad_clean.evt |
| Size (bytes) | 414,164,160 | 346,697,280 |
| Size | 395.0 MB | 330.6 MB |
| Events in quadrant A | 2,528,822 | 2,000,252 |
| Events in quadrant B | 2,355,570 | 1,877,484 |
| Events in quadrant C | 2,517,666 | 1,923,032 |
| Events in quadrant D | 2,165,198 | 1,723,810 |
| Mode SS | |||
|---|---|---|---|
| Quadrant | BADHDUFLAG | Total packets | Discarded packets |
| A | 0 | 344 | 0 |
| B | 0 | 843 | 0 |
| C | 0 | 852 | 0 |
| D | 0 | 345 | 0 |
| Mode M9 | |||
|---|---|---|---|
| Quadrant | BADHDUFLAG | Total packets | Discarded packets |
| A | 0 | 91 | 0 |
| B | 0 | 91 | 0 |
| C | 0 | 91 | 0 |
| D | 0 | 91 | 0 |
| Mode M0 | |||
|---|---|---|---|
| Quadrant | BADHDUFLAG | Total packets | Discarded packets |
| A | 0 | 92534 | 0 |
| B | 0 | 110037 | 0 |
| C | 0 | 91028 | 0 |
| D | 0 | 106005 | 0 |
| Quadrant | Total seconds | Saturated seconds | Saturation percentage |
|---|---|---|---|
| A | 44437 | 516 | 1.161195% |
| B | 43300 | 2137 | 4.935335% |
| C | 44472 | 375 | 0.843227% |
| D | 45035 | 831 | 1.845231% |
Noise dominated data is calculated using 1-second bins in cleaned event files. If a bin has >2000 counts, and if more than 50% of those come from <1% of pixels, then it is considered to be noise-dominated and hence unusable.
| Quadrant | # 1 sec bins | Bins with >0 counts | Bins with >2000 counts | High rate bins dominated by noise | Noise dominated (total time) | Noise dominated (detector-on time) | Marked lightcurve |
|---|---|---|---|---|---|---|---|
| A | 54051 | 45526 | 0 | 0 | 0.00% | 0.00% |  |
| B | 54054 | 44423 | 0 | 0 | 0.00% | 0.00% |  |
| C | 54069 | 45537 | 0 | 0 | 0.00% | 0.00% |  |
| D | 54106 | 45355 | 0 | 0 | 0.00% | 0.00% | 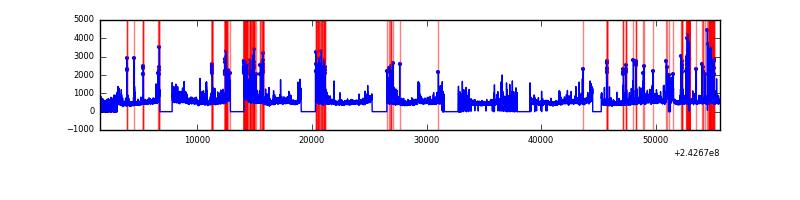 |
Top three noisy pixels from each quadrant. If the there are fewer than three noisy pixels in the level2.evt file, extra rows are filled as -1
| Pixel properties | Quadrant properties | ||||||
|---|---|---|---|---|---|---|---|
| Quadrant | DetID | PixID | Counts | Sigma | Mean | Median | Sigma |
| A | 0 | 29 | 2405 | 10.78 | 657 | 614 | 166.1 |
| A | 7 | 110 | 2051 | 8.65 | 657 | 614 | 166.1 |
| A | 0 | 30 | 1858 | 7.49 | 657 | 614 | 166.1 |
| B | 2 | 9 | 1995 | 11.09 | 621 | 591 | 126.6 |
| B | 12 | 226 | 1606 | 8.01 | 621 | 591 | 126.6 |
| B | 3 | 17 | 1588 | 7.87 | 621 | 591 | 126.6 |
| C | 1 | 81 | 1851 | 7.03 | 664 | 617 | 175.6 |
| C | 1 | 80 | 1821 | 6.86 | 664 | 617 | 175.6 |
| C | 12 | 241 | 1788 | 6.67 | 664 | 617 | 175.6 |
| D | 6 | 231 | 1635 | 6.48 | 617 | 560 | 165.9 |
| D | 3 | 14 | 1628 | 6.44 | 617 | 560 | 165.9 |
| D | 3 | 31 | 1541 | 5.91 | 617 | 560 | 165.9 |
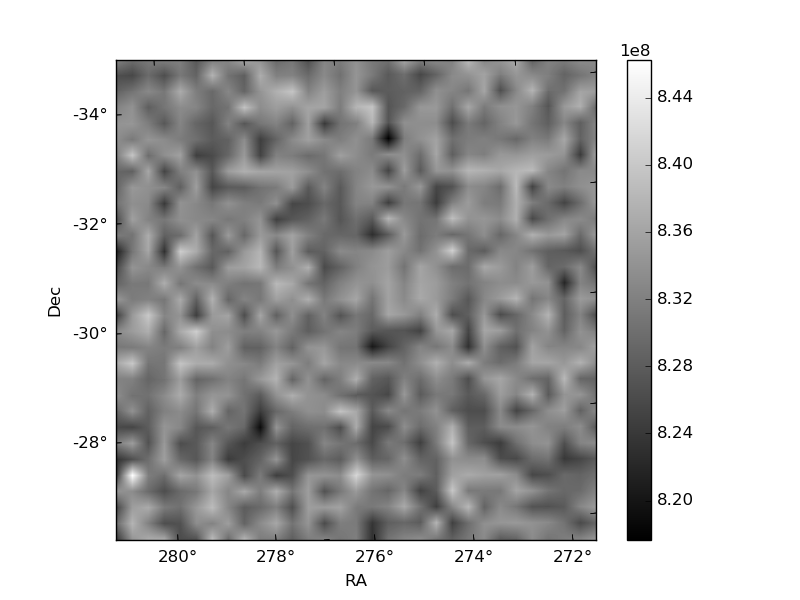
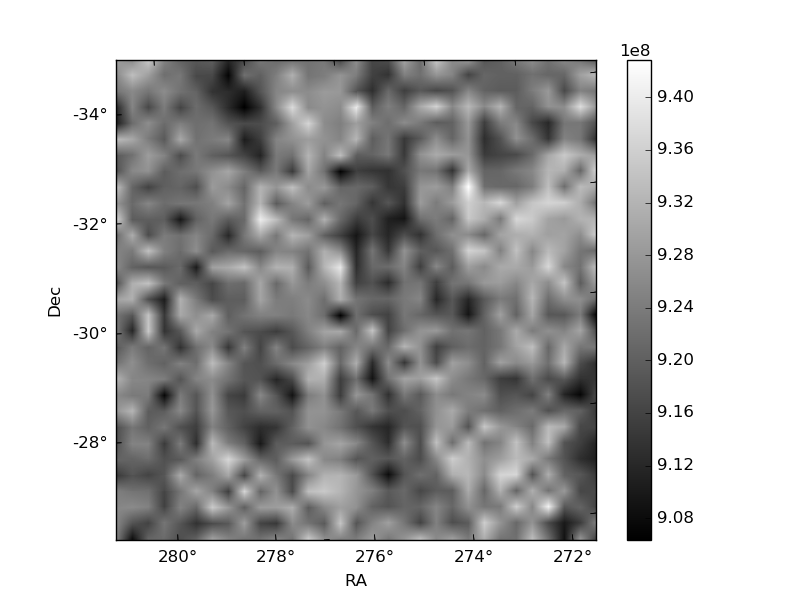
Histogram calculated using DETX and DETY for each event in the final _common_clean file
| Quadrant A | 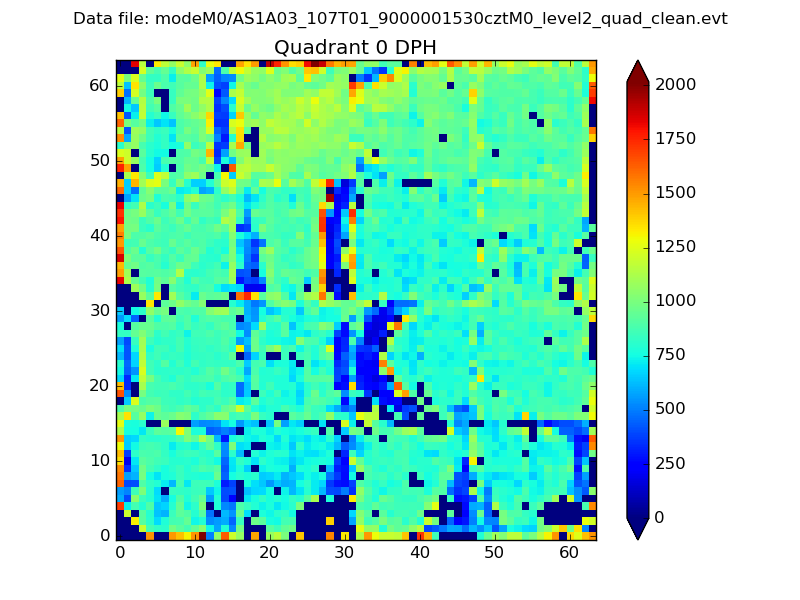 |
 |
Quadrant B |
|---|---|---|---|
| Quadrant D | 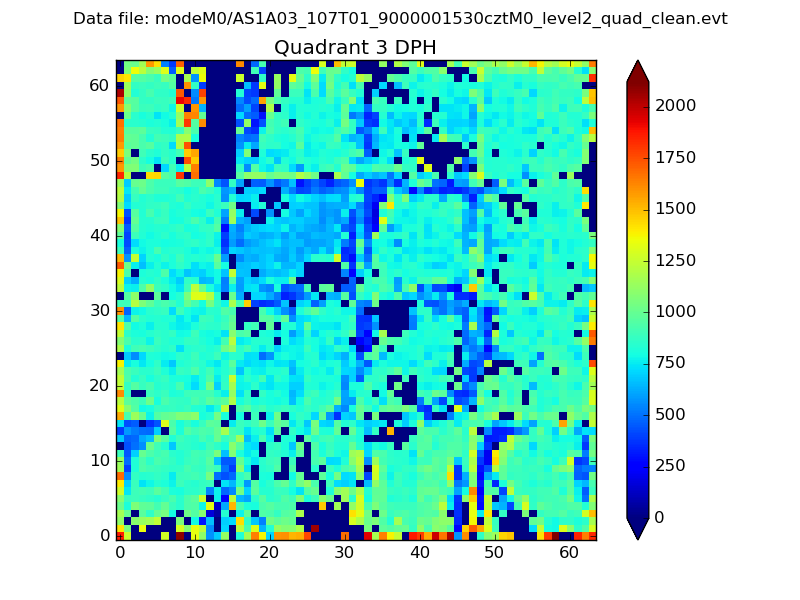 |
 |
Quadrant C |
| Plot type | Count rate plots | Images |
|---|---|---|
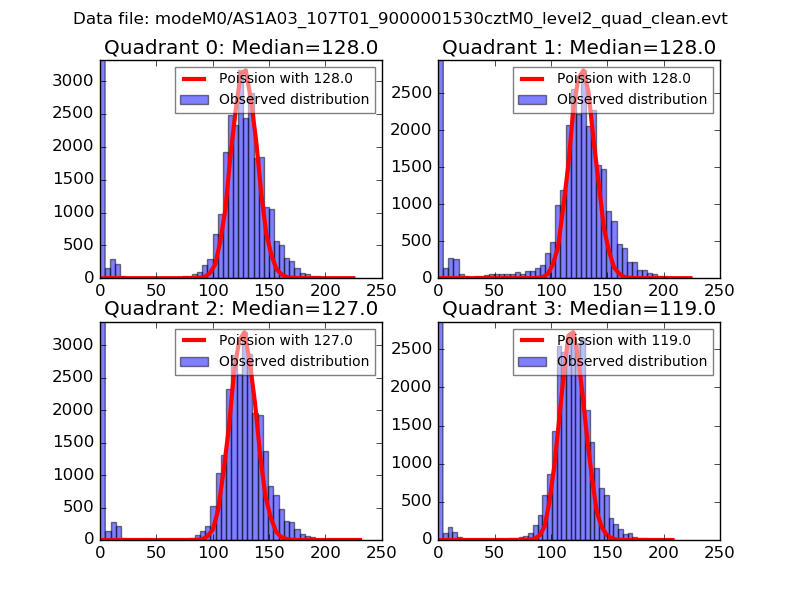
| Comparison with Poisson distribution Blue bars denote a histogram of data divided into 1 sec bins. Red curve is a Poisson curve with rate = median count rate of data. |
 |
 |
| Quadrant-wise count rates Data is divided into 100 sec bins |
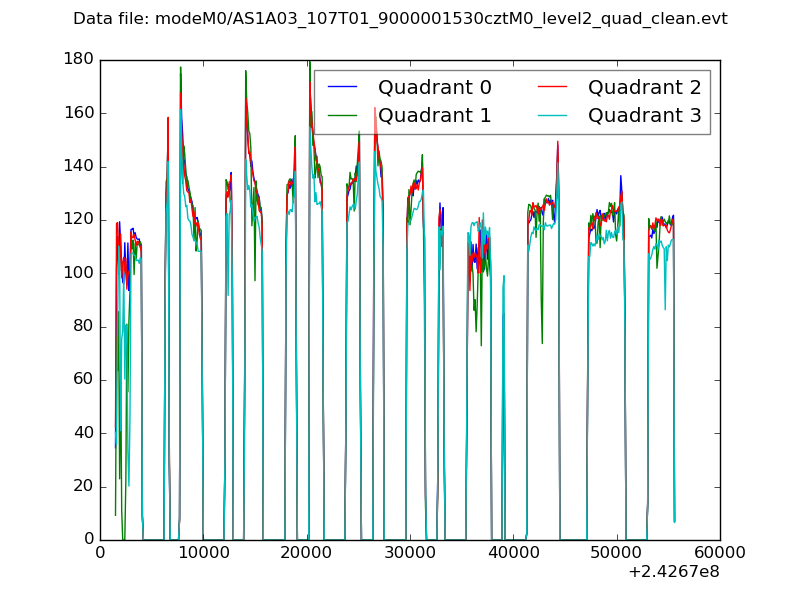 |
|
| Module-wise count rates for Quadrant A Data is divided into 100 sec bins |
 |
 |
| Module-wise count rates for Quadrant B Data is divided into 100 sec bins |
 |
 |
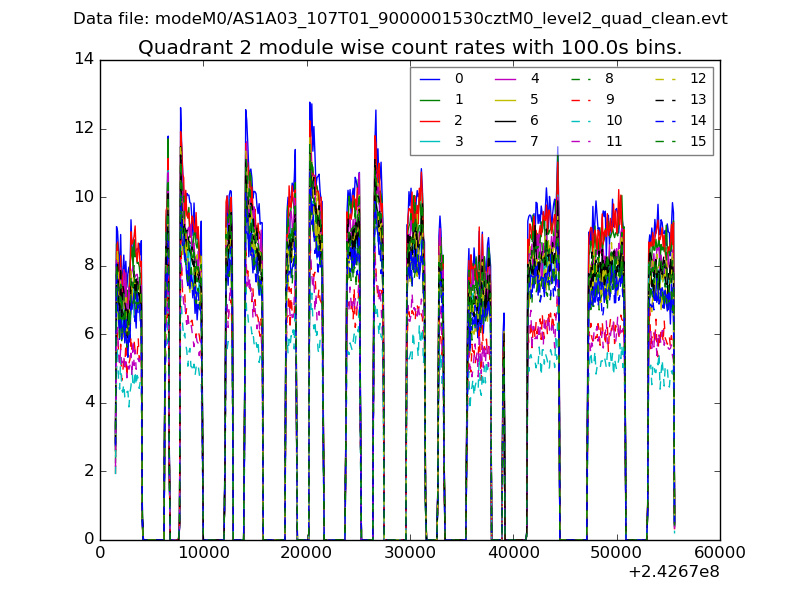
| Module-wise count rates for Quadrant C Data is divided into 100 sec bins |
 |
 |
| Module-wise count rates for Quadrant D Data is divided into 100 sec bins |
 |
 |
| Parameter | Plot |
|---|---|
| CZT HV Monitor |  |
| D_VDD | 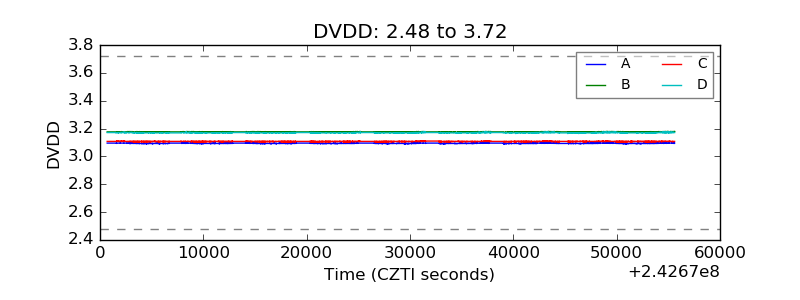 |
| Temperature 1 |  |
| Veto HV Monitor | 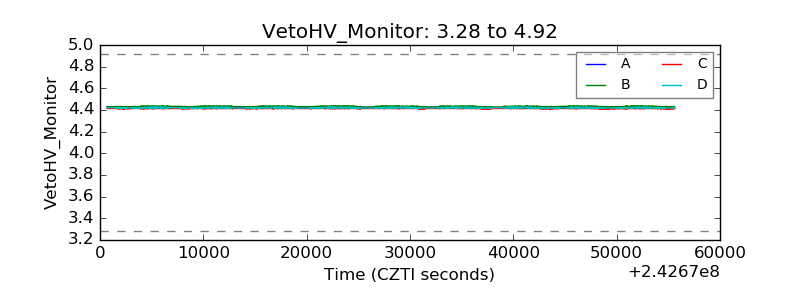 |
| Veto LLD | 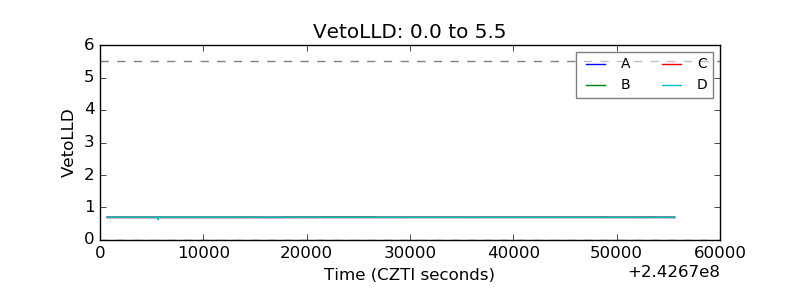 |
| Alpha Counter |  |
| _CPM_Rate | 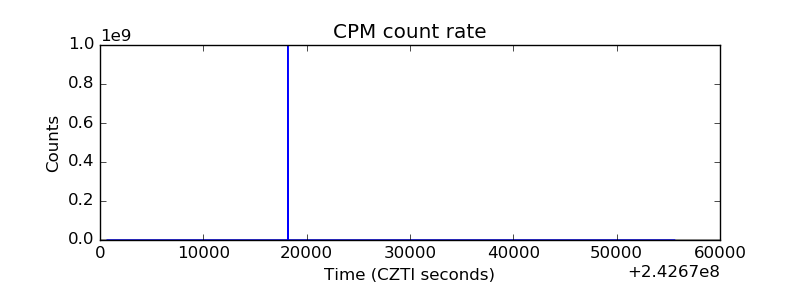 |
| CZT Counter | 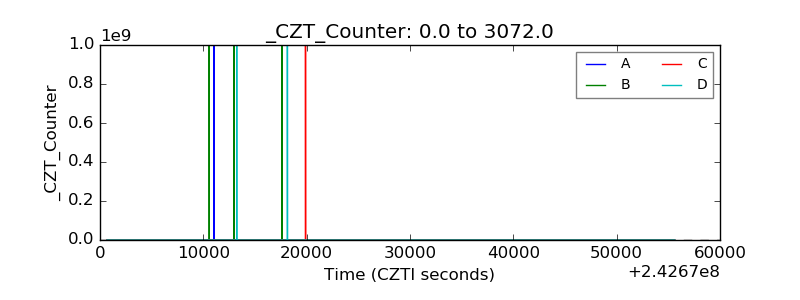 |
| +2.5 Volts monitor | 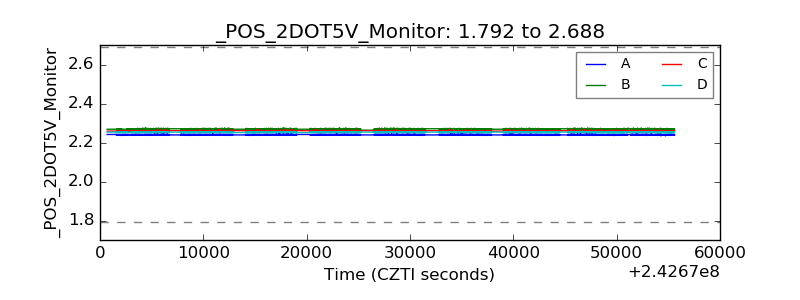 |
| +5 Volts monitor | 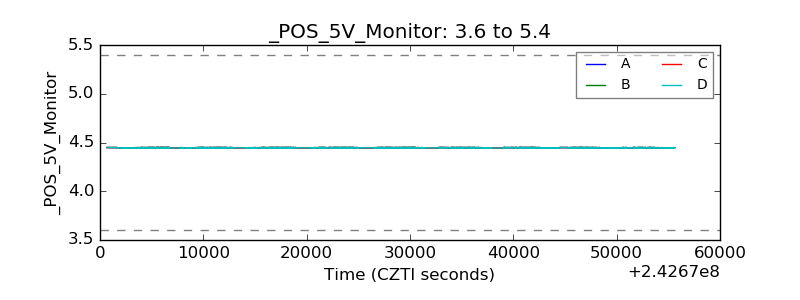 |
| _ROLL_ROT | 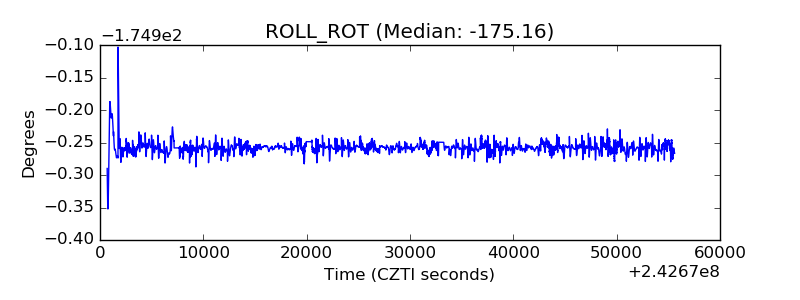 |
| _Roll_DEC | 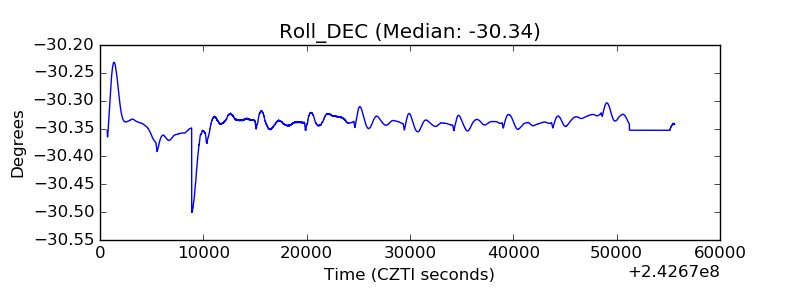 |
| _Roll_RA | 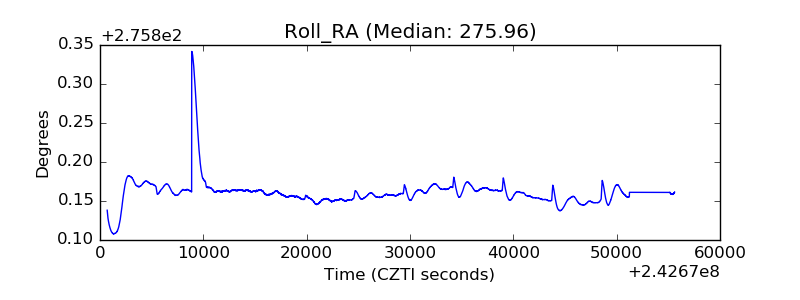 |
| Veto Counter |  |