| Param | Original file | Final file |
|---|---|---|
| Filename | modeM0/AS1A03_107T01_9000001530_10546cztM0_level2.evt | modeM0/AS1A03_107T01_9000001530_10546cztM0_level2_quad_clean.evt |
| Size (bytes) | 60,963,840 | 17,614,080 |
| Size | 58.1 MB | 16.8 MB |
| Events in quadrant A | 541,015 | 147,633 |
| Events in quadrant B | 254,891 | 65,427 |
| Events in quadrant C | 536,495 | 149,872 |
| Events in quadrant D | 447,240 | 97,684 |
| Mode SS | |||
|---|---|---|---|
| Quadrant | BADHDUFLAG | Total packets | Discarded packets |
| A | 0 | 56 | 30 |
| B | 0 | 56 | 32 |
| C | 0 | 56 | 28 |
| D | 0 | 55 | 28 |
| Mode M9 | |||
|---|---|---|---|
| Quadrant | BADHDUFLAG | Total packets | Discarded packets |
| A | 0 | 16 | 7 |
| B | 0 | 18 | 9 |
| C | 0 | 18 | 9 |
| D | 0 | 16 | 7 |
| Mode M0 | |||
|---|---|---|---|
| Quadrant | BADHDUFLAG | Total packets | Discarded packets |
| A | 0 | 6021 | 3750 |
| B | 0 | 12110 | 11105 |
| C | 0 | 6128 | 3784 |
| D | 0 | 7510 | 5801 |
| Quadrant | Total seconds | Saturated seconds | Saturation percentage |
|---|---|---|---|
| A | 1136 | 2 | 0.176056% |
| B | 503 | 1 | 0.198807% |
| C | 1173 | 1 | 0.085251% |
| D | 804 | 1 | 0.124378% |
Noise dominated data is calculated using 1-second bins in cleaned event files. If a bin has >2000 counts, and if more than 50% of those come from <1% of pixels, then it is considered to be noise-dominated and hence unusable.
| Quadrant | # 1 sec bins | Bins with >0 counts | Bins with >2000 counts | High rate bins dominated by noise | Noise dominated (total time) | Noise dominated (detector-on time) | Marked lightcurve |
|---|---|---|---|---|---|---|---|
| A | 1489 | 1363 | 0 | 0 | 0.00% | 0.00% | 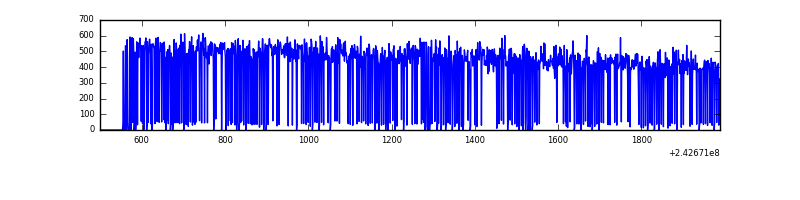 |
| B | 1489 | 681 | 0 | 0 | 0.00% | 0.00% | 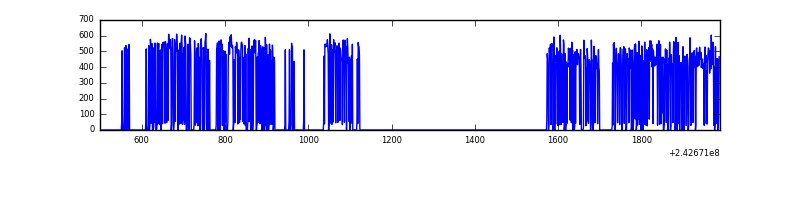 |
| C | 1489 | 1377 | 0 | 0 | 0.00% | 0.00% | 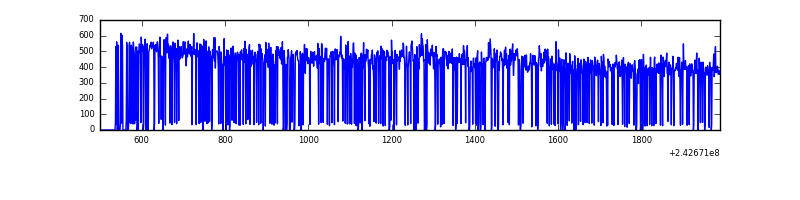 |
| D | 1488 | 1031 | 0 | 0 | 0.00% | 0.00% | 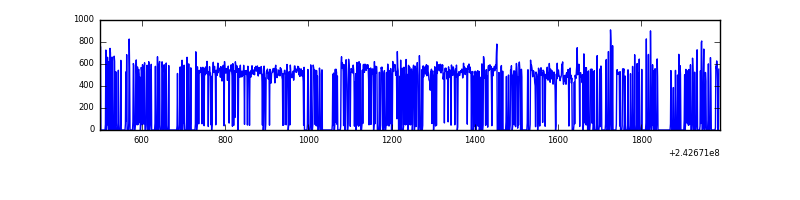 |
Top three noisy pixels from each quadrant. If the there are fewer than three noisy pixels in the level2.evt file, extra rows are filled as -1
| Pixel properties | Quadrant properties | ||||||
|---|---|---|---|---|---|---|---|
| Quadrant | DetID | PixID | Counts | Sigma | Mean | Median | Sigma |
| A | 1 | 162 | 3287 | 104.39 | 137 | 135 | 30.2 |
| A | 13 | 251 | 2161 | 67.1 | 137 | 135 | 30.2 |
| A | 15 | 239 | 1748 | 53.42 | 137 | 135 | 30.2 |
| B | 11 | 51 | 8612 | 632.93 | 59 | 58 | 13.5 |
| B | 4 | 239 | 6049 | 443.29 | 59 | 58 | 13.5 |
| B | 0 | 229 | 2679 | 193.93 | 59 | 58 | 13.5 |
| C | 4 | 175 | 11502 | 346.96 | 134 | 134 | 32.8 |
| C | 4 | 174 | 1086 | 29.06 | 134 | 134 | 32.8 |
| C | 13 | 61 | 1069 | 28.54 | 134 | 134 | 32.8 |
| D | 8 | 195 | 44512 | 1818.53 | 92 | 89 | 24.4 |
| D | 2 | 16 | 39081 | 1596.2 | 92 | 89 | 24.4 |
| D | 1 | 52 | 11602 | 471.3 | 92 | 89 | 24.4 |
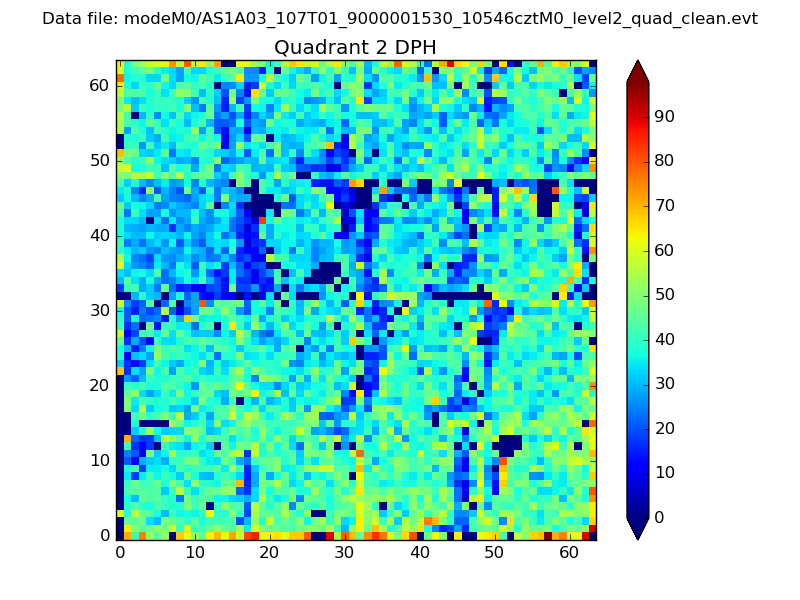
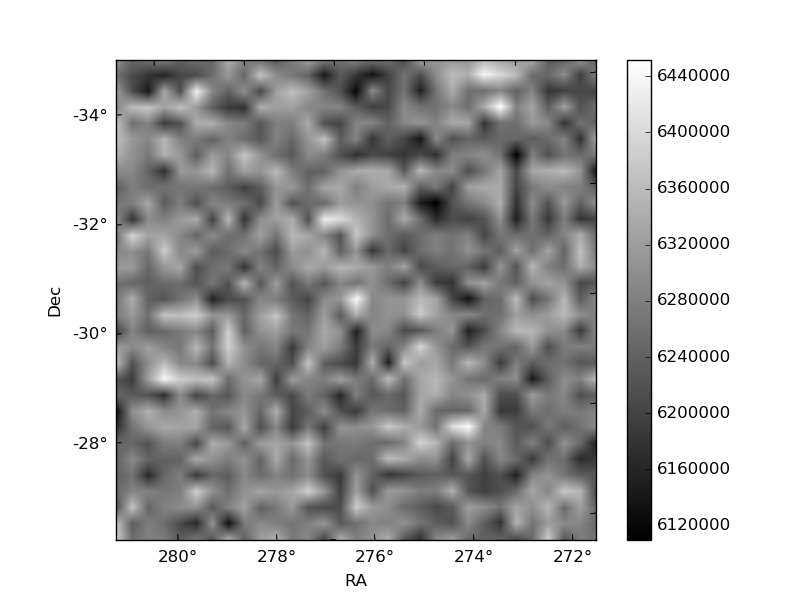
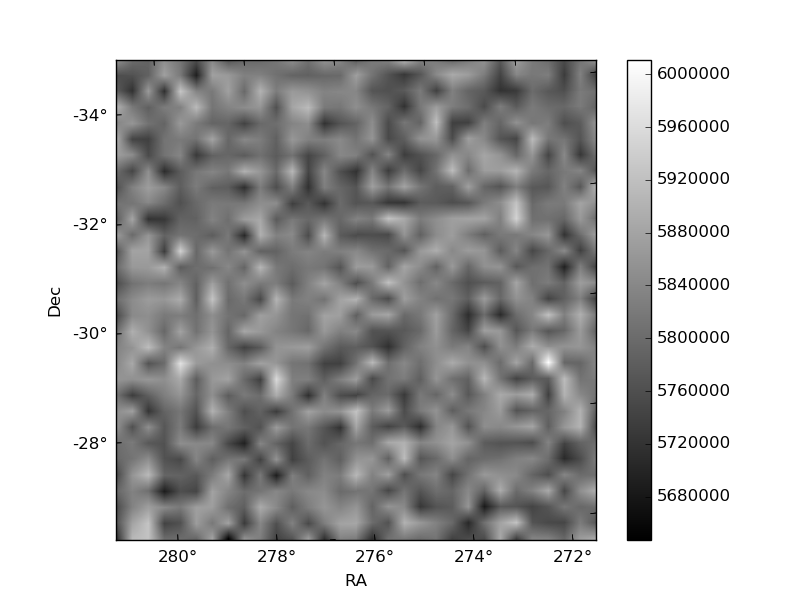
Histogram calculated using DETX and DETY for each event in the final _common_clean file
| Quadrant A | 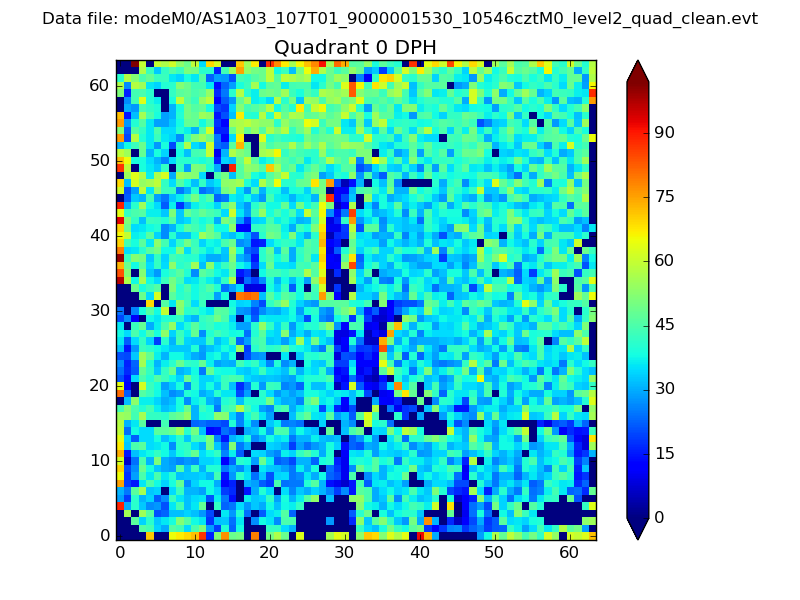 |
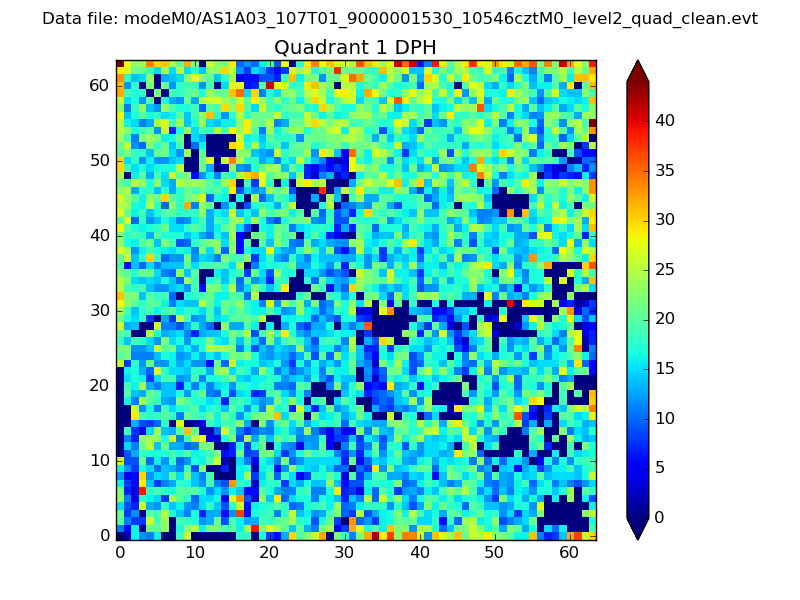 |
Quadrant B |
|---|---|---|---|
| Quadrant D | 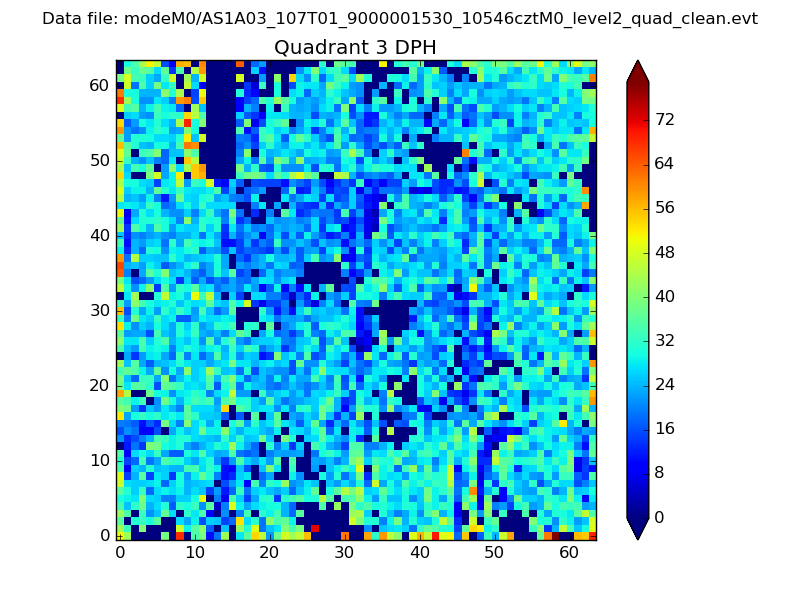 |
 |
Quadrant C |
| Plot type | Count rate plots | Images |
|---|---|---|
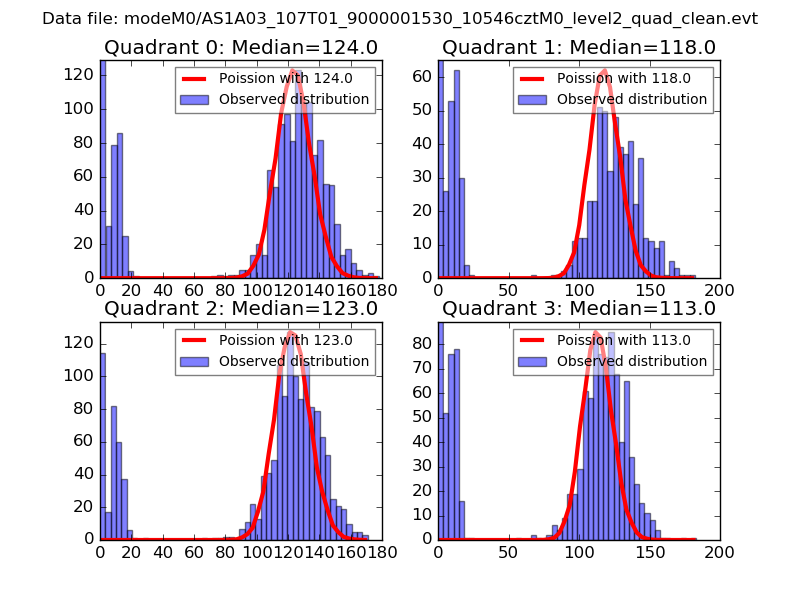
| Comparison with Poisson distribution Blue bars denote a histogram of data divided into 1 sec bins. Red curve is a Poisson curve with rate = median count rate of data. |
 |
 |
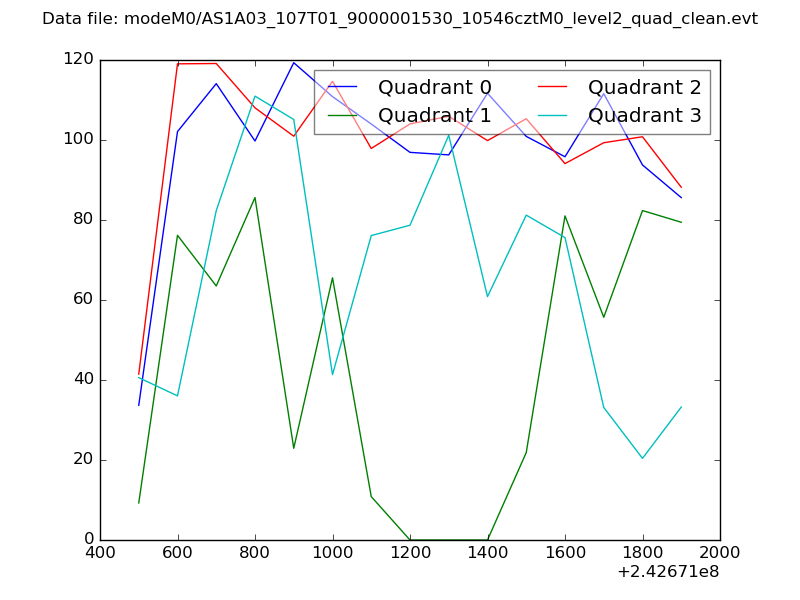
| Quadrant-wise count rates Data is divided into 100 sec bins |
 |
|
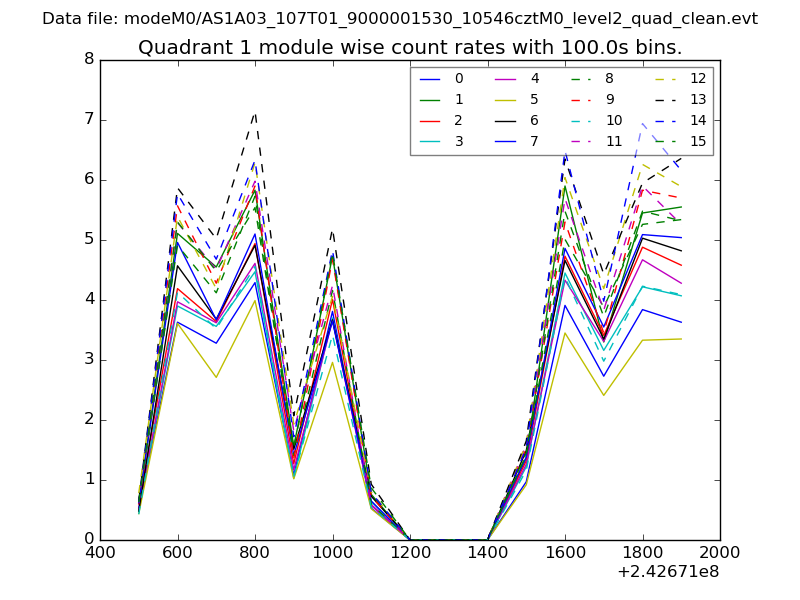
| Module-wise count rates for Quadrant A Data is divided into 100 sec bins |
 |
 |
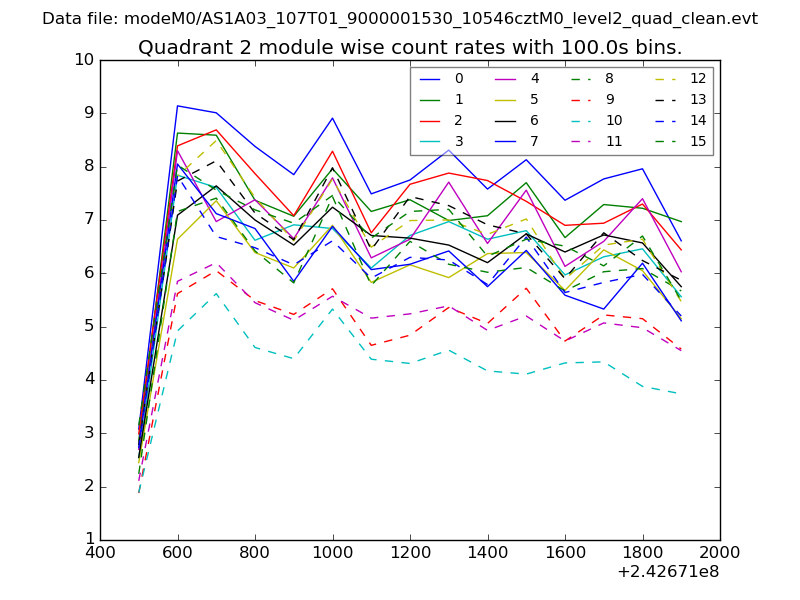
| Module-wise count rates for Quadrant B Data is divided into 100 sec bins |
 |
 |
| Module-wise count rates for Quadrant C Data is divided into 100 sec bins |
 |
 |
| Module-wise count rates for Quadrant D Data is divided into 100 sec bins |
 |
 |
| Parameter | Plot |
|---|---|
| CZT HV Monitor | 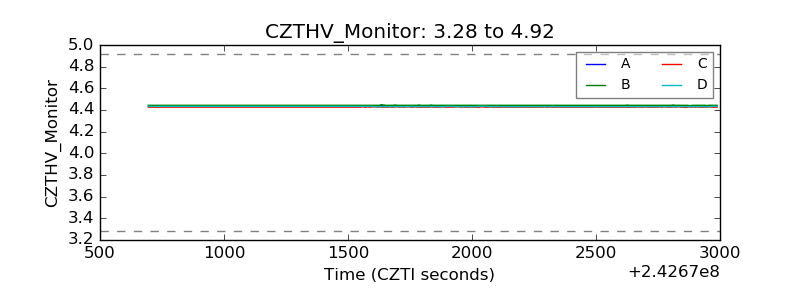 |
| D_VDD | 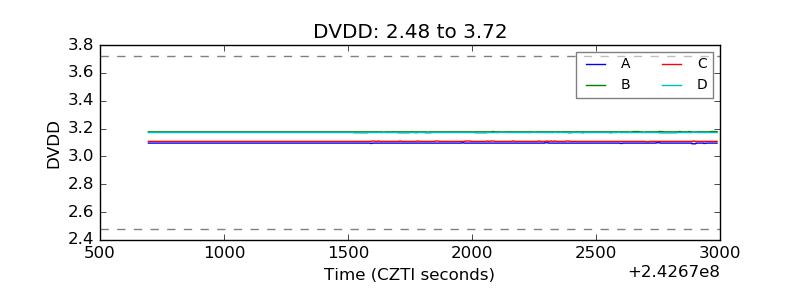 |
| Temperature 1 | 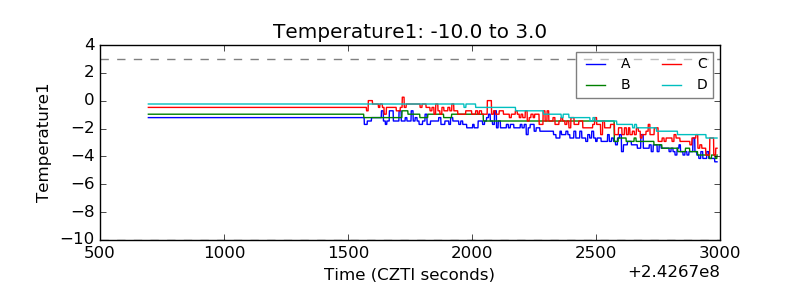 |
| Veto HV Monitor | 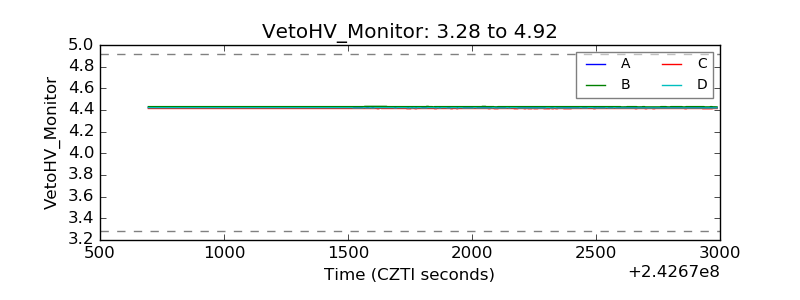 |
| Veto LLD | 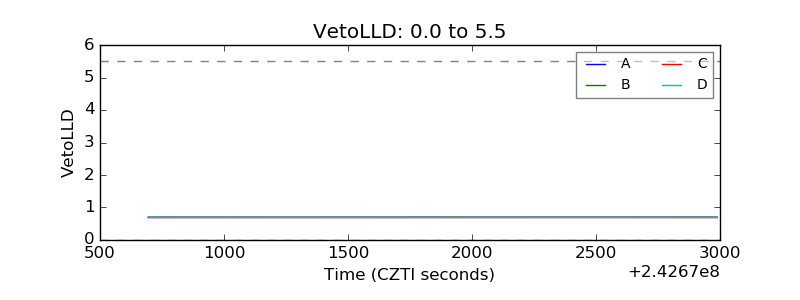 |
| Alpha Counter | 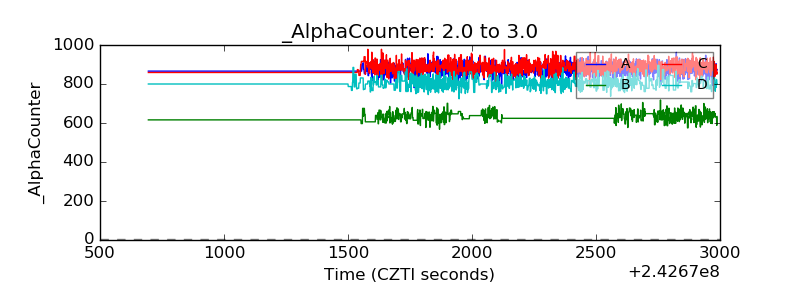 |
| _CPM_Rate | 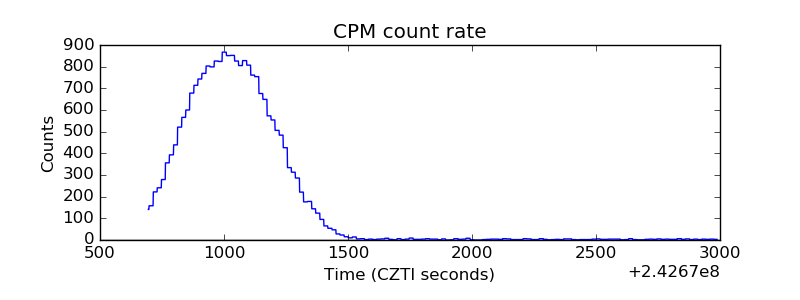 |
| CZT Counter | 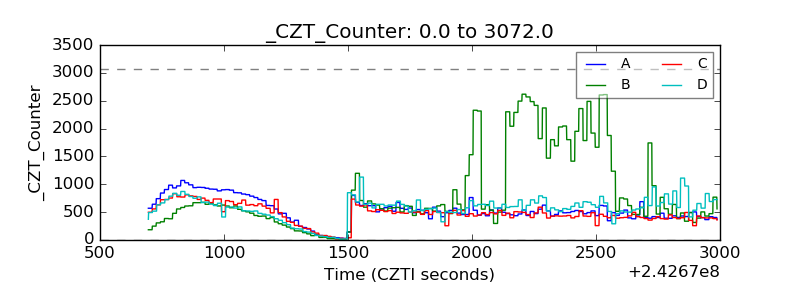 |
| +2.5 Volts monitor |  |
| +5 Volts monitor | 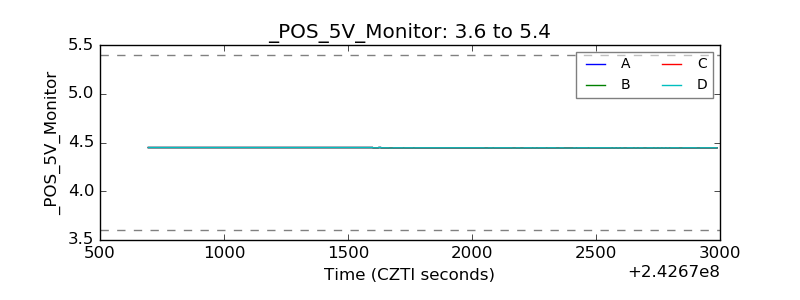 |
| _ROLL_ROT | 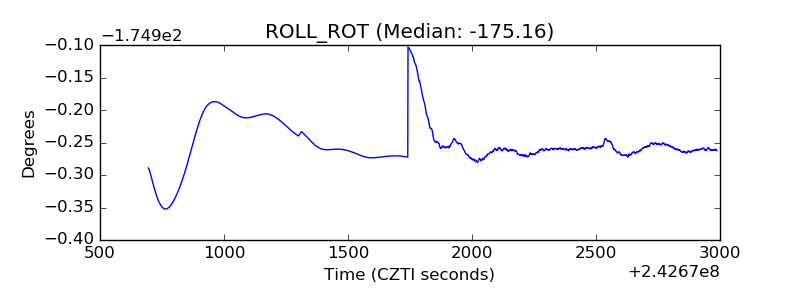 |
| _Roll_DEC | 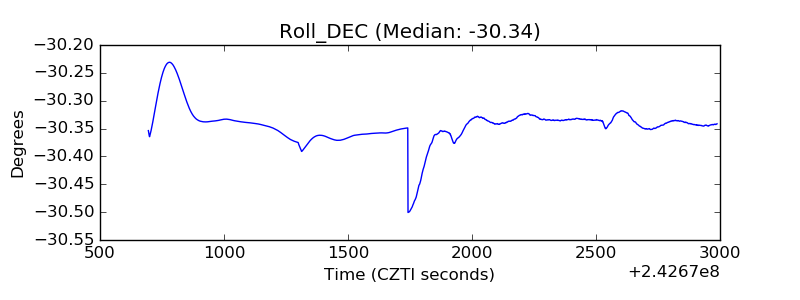 |
| _Roll_RA | 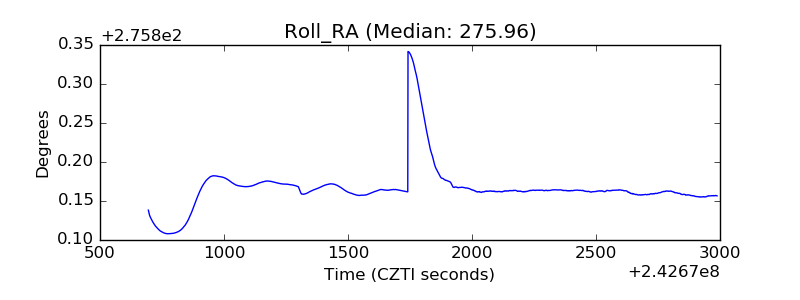 |
| Veto Counter | 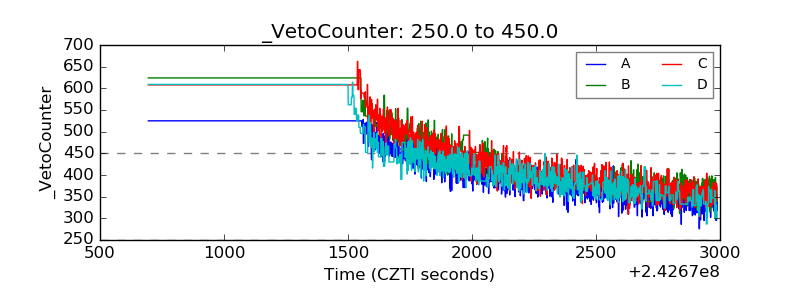 |