| Param | Original file | Final file |
|---|---|---|
| Filename | modeM0/AS1A03_107T01_9000001530_10549cztM0_level2.evt | modeM0/AS1A03_107T01_9000001530_10549cztM0_level2_quad_clean.evt |
| Size (bytes) | 125,994,240 | 21,960,000 |
| Size | 120.2 MB | 20.9 MB |
| Events in quadrant A | 860,861 | 143,594 |
| Events in quadrant B | 875,962 | 124,613 |
| Events in quadrant C | 877,955 | 156,616 |
| Events in quadrant D | 1,078,014 | 110,876 |
| Mode SS | |||
|---|---|---|---|
| Quadrant | BADHDUFLAG | Total packets | Discarded packets |
| A | 0 | 224 | 192 |
| B | 0 | 226 | 187 |
| C | 0 | 221 | 181 |
| D | 0 | 217 | 175 |
| Mode M9 | |||
|---|---|---|---|
| Quadrant | BADHDUFLAG | Total packets | Discarded packets |
| A | 0 | 22 | 13 |
| B | 0 | 22 | 13 |
| C | 0 | 23 | 15 |
| D | 0 | 22 | 15 |
| Mode M0 | |||
|---|---|---|---|
| Quadrant | BADHDUFLAG | Total packets | Discarded packets |
| A | 0 | 21936 | 18199 |
| B | 0 | 28729 | 25153 |
| C | 0 | 22273 | 18432 |
| D | 0 | 28505 | 24279 |
| Quadrant | Total seconds | Saturated seconds | Saturation percentage |
|---|---|---|---|
| A | 1806 | 6 | 0.332226% |
| B | 1571 | 10 | 0.636537% |
| C | 1908 | 1 | 0.052411% |
| D | 1698 | 5 | 0.294464% |
Noise dominated data is calculated using 1-second bins in cleaned event files. If a bin has >2000 counts, and if more than 50% of those come from <1% of pixels, then it is considered to be noise-dominated and hence unusable.
| Quadrant | # 1 sec bins | Bins with >0 counts | Bins with >2000 counts | High rate bins dominated by noise | Noise dominated (total time) | Noise dominated (detector-on time) | Marked lightcurve |
|---|---|---|---|---|---|---|---|
| A | 6651 | 2507 | 0 | 0 | 0.00% | 0.00% | 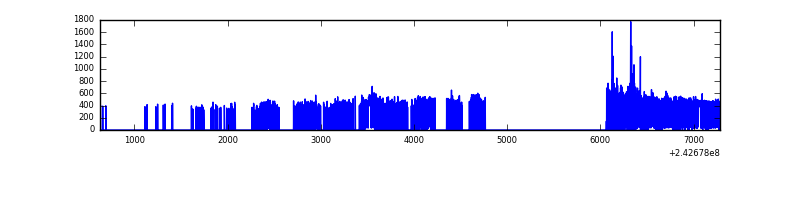 |
| B | 6344 | 2236 | 0 | 0 | 0.00% | 0.00% | 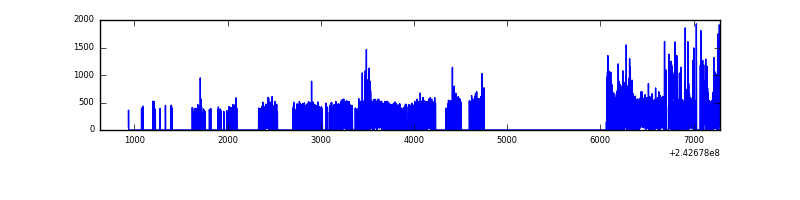 |
| C | 6620 | 2579 | 0 | 0 | 0.00% | 0.00% | 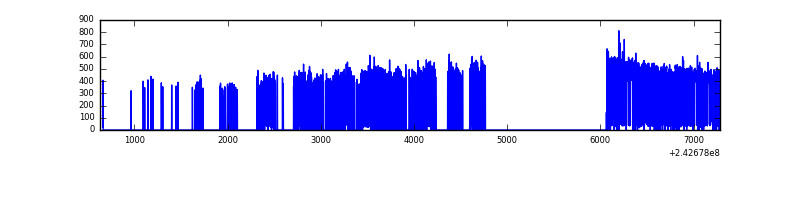 |
| D | 6652 | 2316 | 1 | 1 | 0.02% | 0.04% | 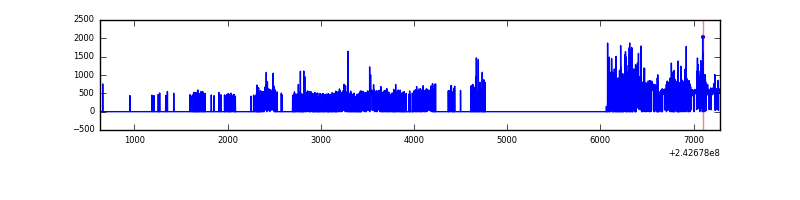 |
Top three noisy pixels from each quadrant. If the there are fewer than three noisy pixels in the level2.evt file, extra rows are filled as -1
| Pixel properties | Quadrant properties | ||||||
|---|---|---|---|---|---|---|---|
| Quadrant | DetID | PixID | Counts | Sigma | Mean | Median | Sigma |
| A | 15 | 174 | 17708 | 382.35 | 216 | 211 | 45.8 |
| A | 8 | 5 | 3110 | 63.35 | 216 | 211 | 45.8 |
| A | 1 | 162 | 2819 | 56.99 | 216 | 211 | 45.8 |
| B | 4 | 239 | 108190 | 2817.32 | 192 | 187 | 38.3 |
| B | 4 | 81 | 5737 | 144.78 | 192 | 187 | 38.3 |
| B | 0 | 214 | 4268 | 106.46 | 192 | 187 | 38.3 |
| C | 4 | 175 | 2360 | 40.26 | 223 | 225 | 53.0 |
| C | 14 | 234 | 1701 | 27.84 | 223 | 225 | 53.0 |
| C | 13 | 61 | 1632 | 26.53 | 223 | 225 | 53.0 |
| D | 8 | 195 | 133693 | 2760.69 | 190 | 185 | 48.4 |
| D | 1 | 52 | 110626 | 2283.7 | 190 | 185 | 48.4 |
| D | 2 | 16 | 60032 | 1237.52 | 190 | 185 | 48.4 |
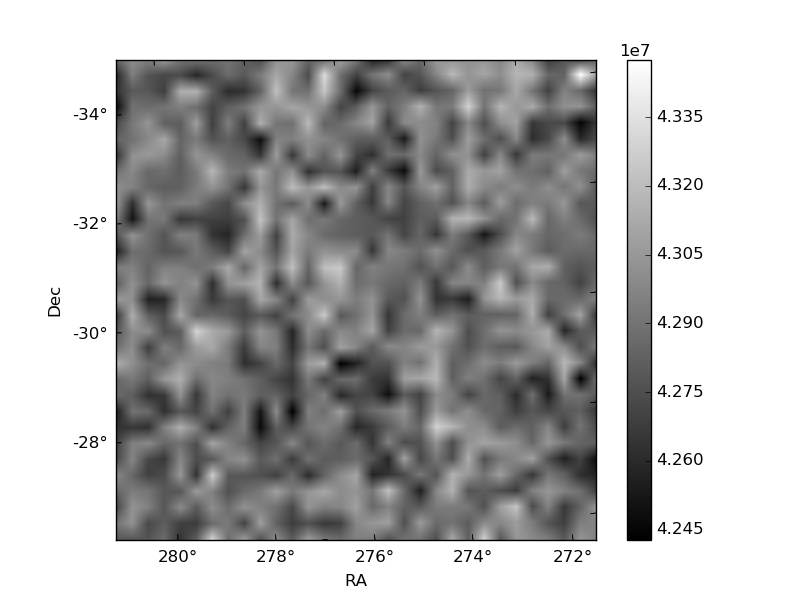
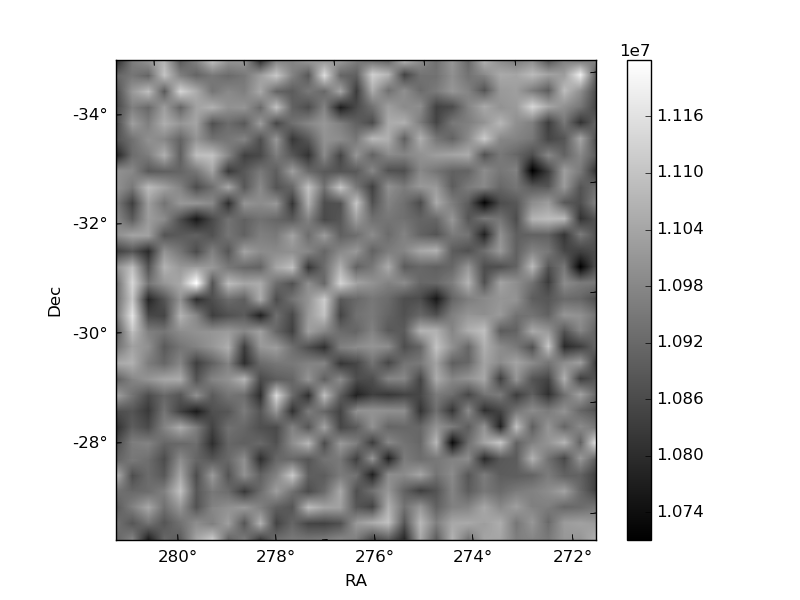
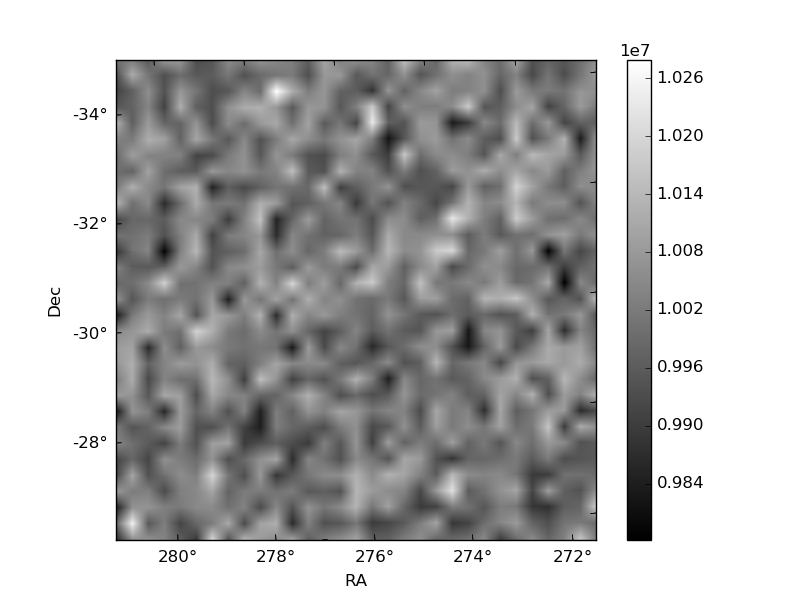
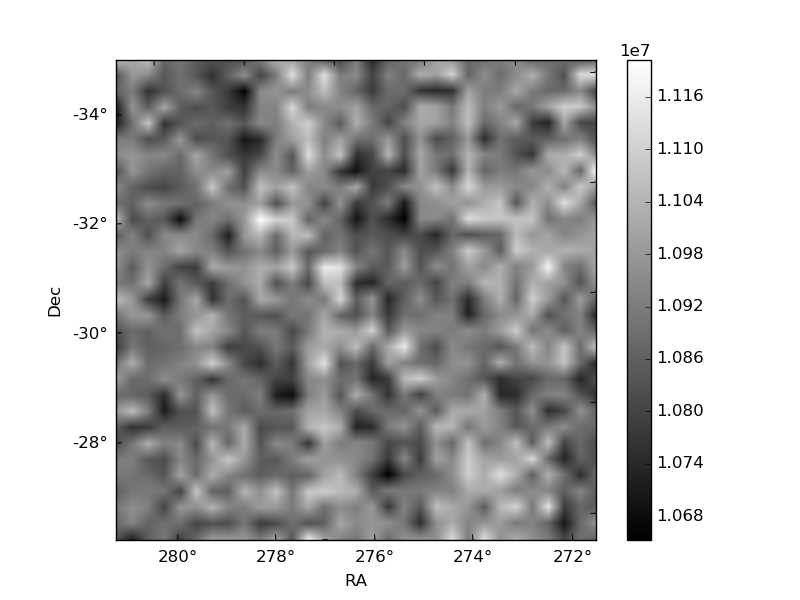
Histogram calculated using DETX and DETY for each event in the final _common_clean file
| Quadrant A | 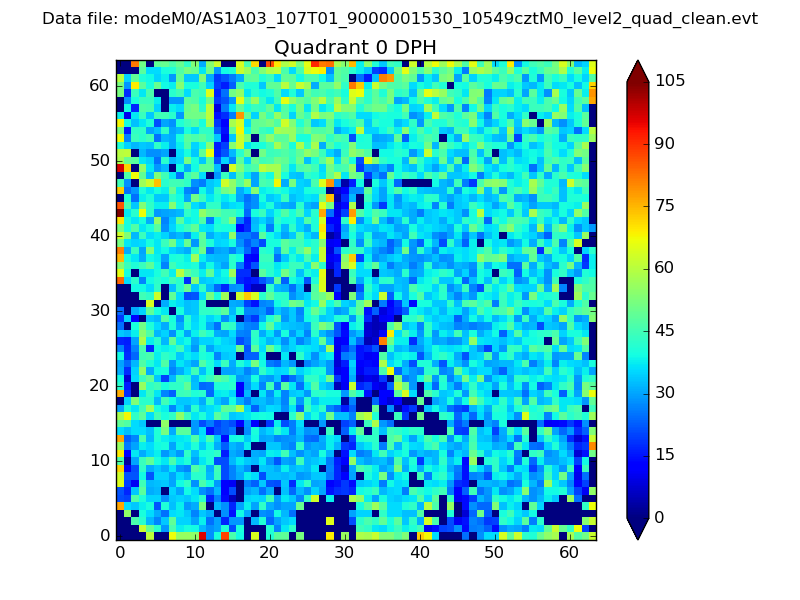 |
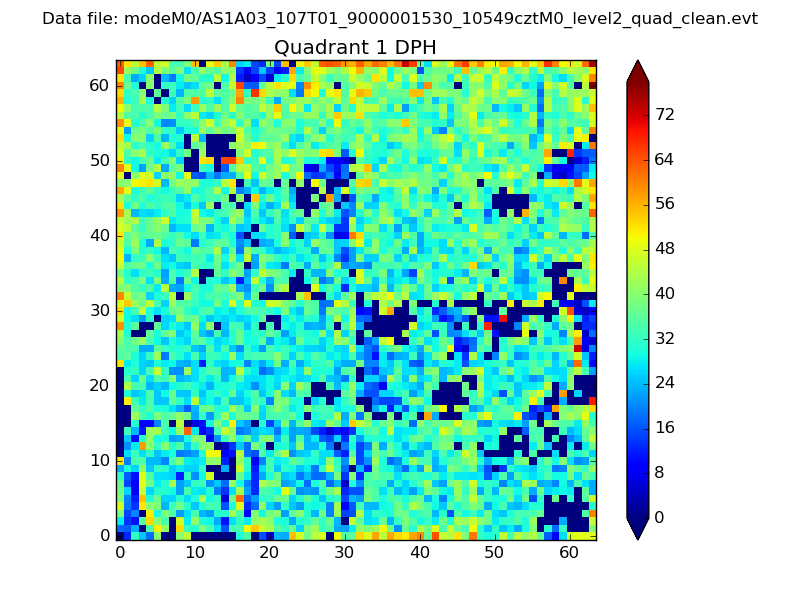 |
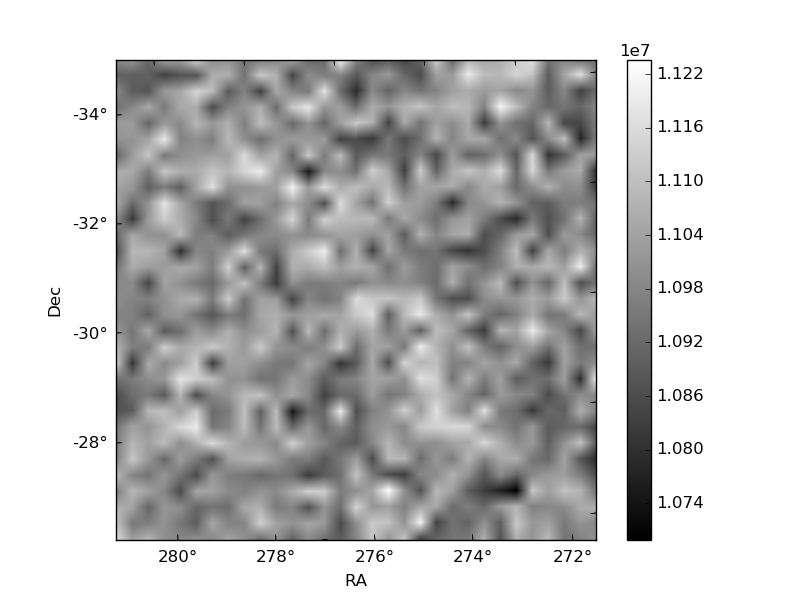
Quadrant B |
|---|---|---|---|
| Quadrant D | 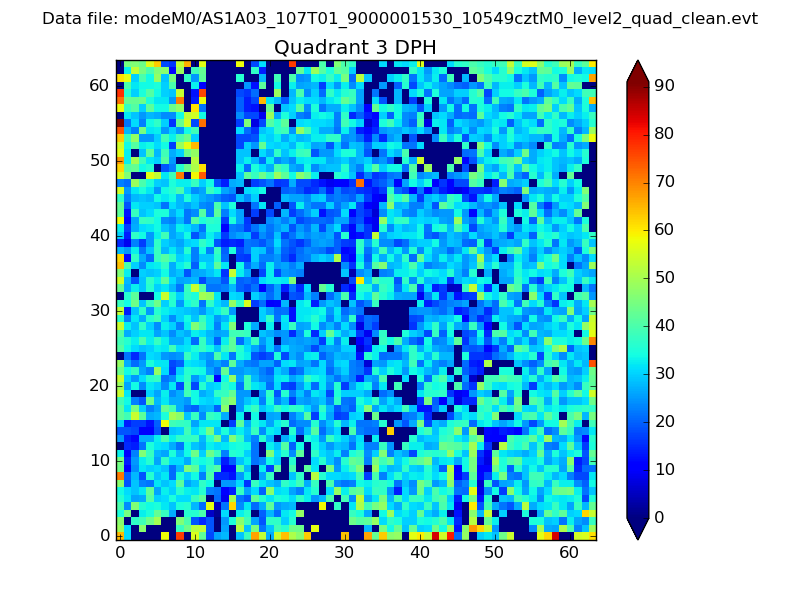 |
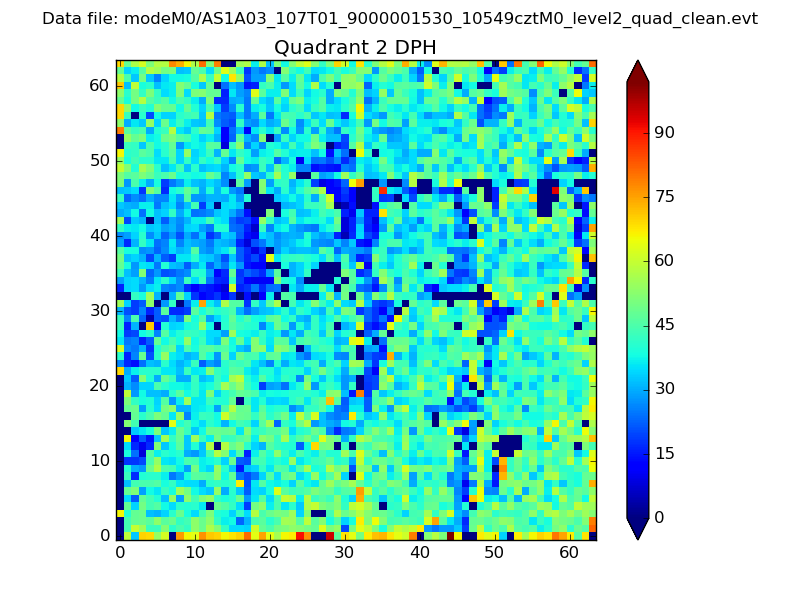 |
Quadrant C |
| Plot type | Count rate plots | Images |
|---|---|---|
| Comparison with Poisson distribution Blue bars denote a histogram of data divided into 1 sec bins. Red curve is a Poisson curve with rate = median count rate of data. |
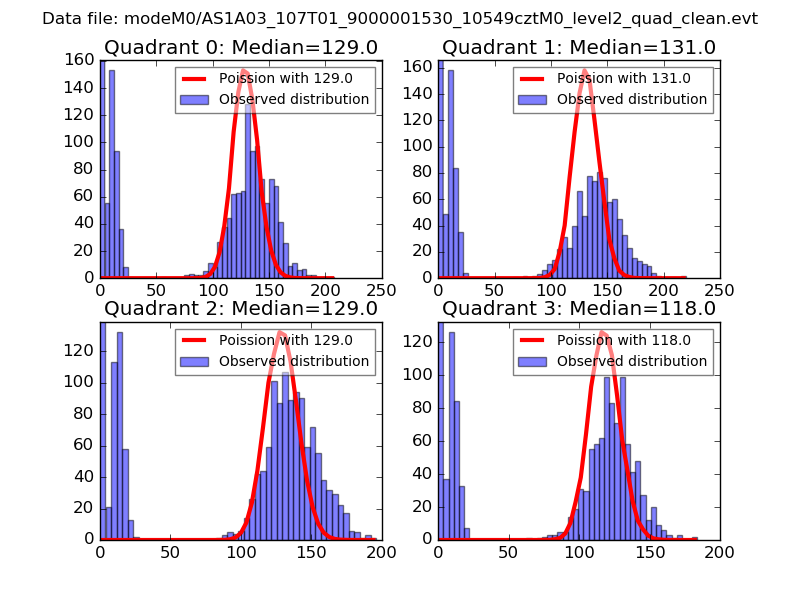 |
 |
| Quadrant-wise count rates Data is divided into 100 sec bins |
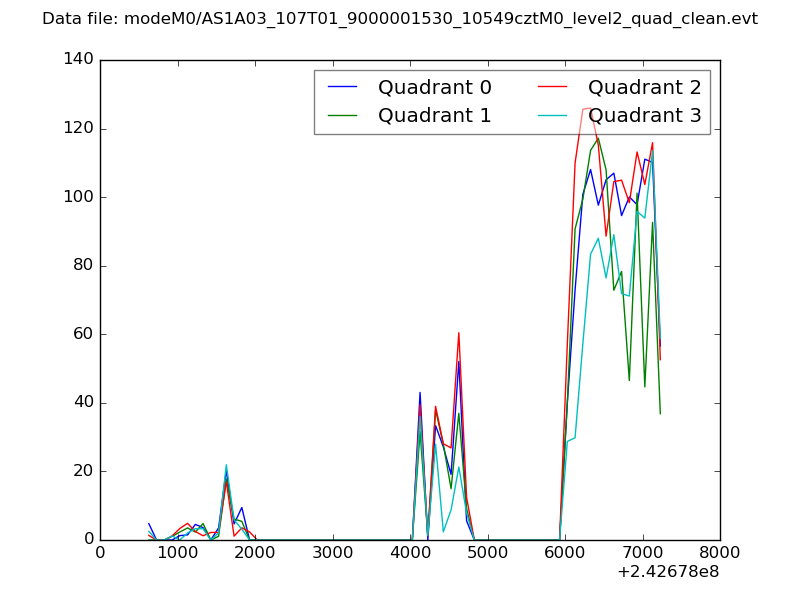 |
|
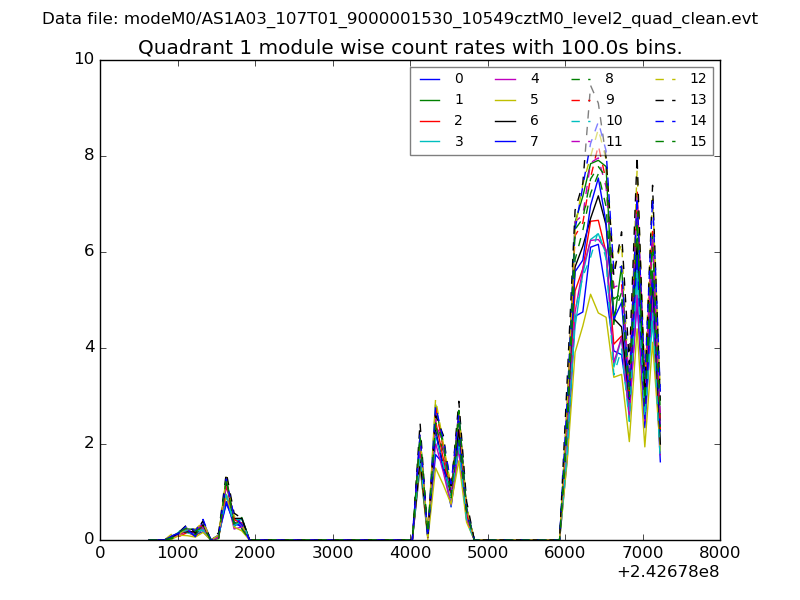
| Module-wise count rates for Quadrant A Data is divided into 100 sec bins |
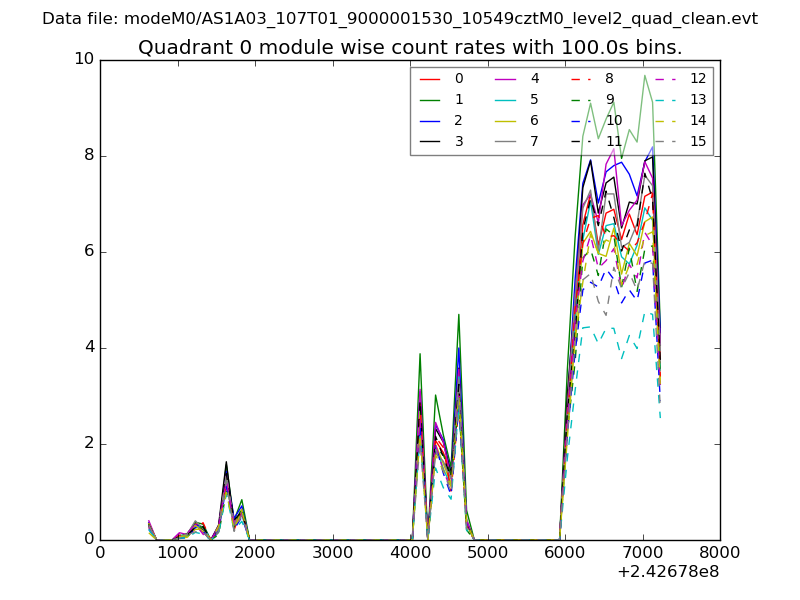 |
 |
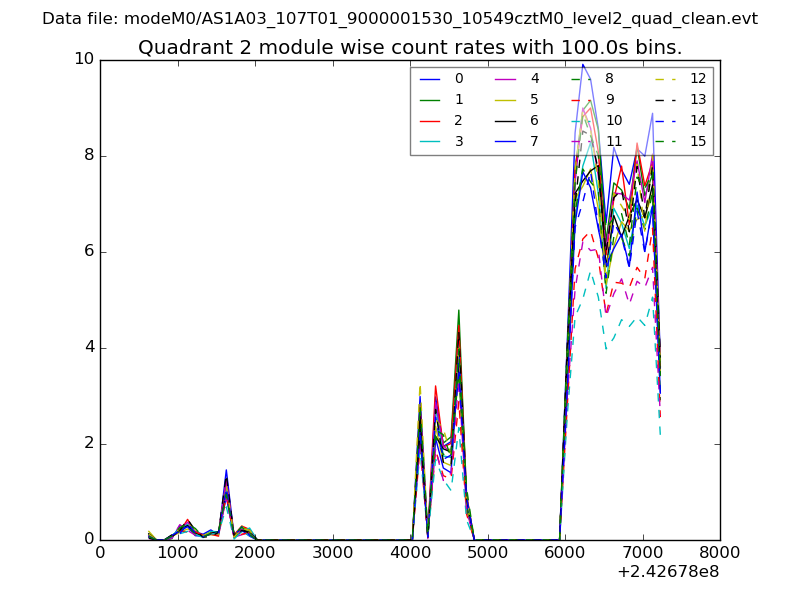
| Module-wise count rates for Quadrant B Data is divided into 100 sec bins |
 |
 |
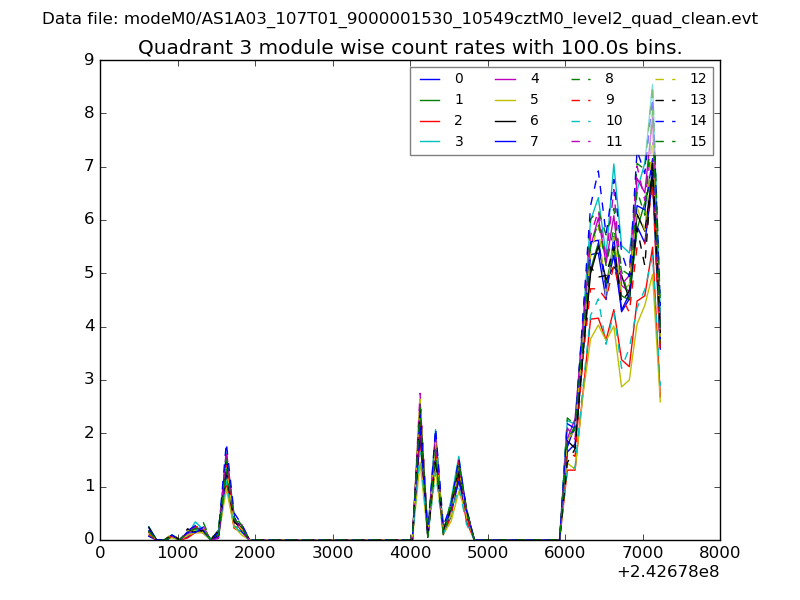
| Module-wise count rates for Quadrant C Data is divided into 100 sec bins |
 |
 |
| Module-wise count rates for Quadrant D Data is divided into 100 sec bins |
 |
 |
| Parameter | Plot |
|---|---|
| CZT HV Monitor |  |
| D_VDD | 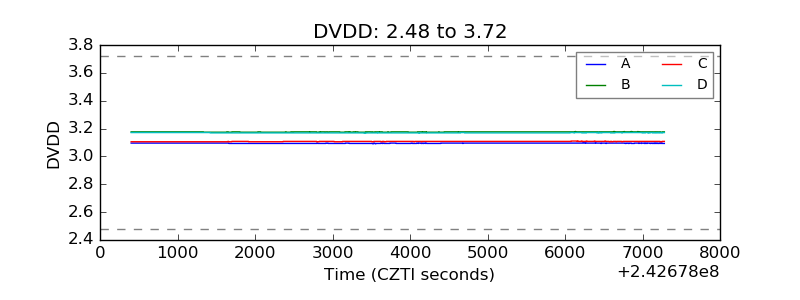 |
| Temperature 1 |  |
| Veto HV Monitor | 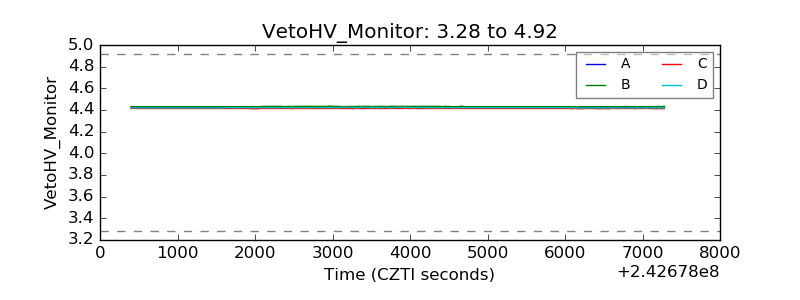 |
| Veto LLD | 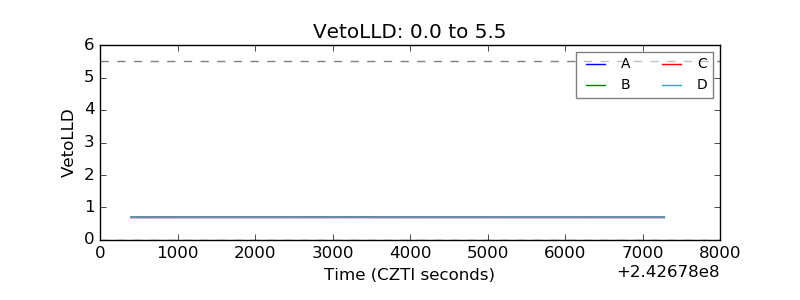 |
| Alpha Counter | 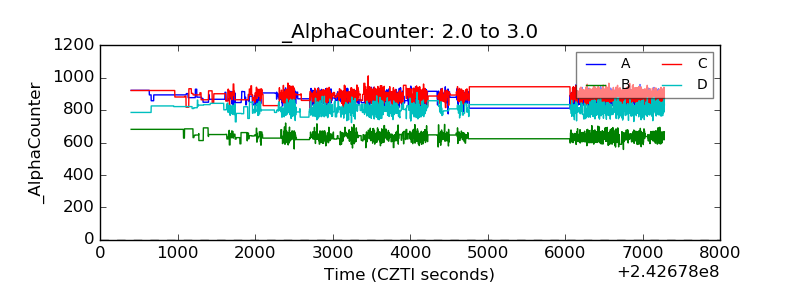 |
| _CPM_Rate | 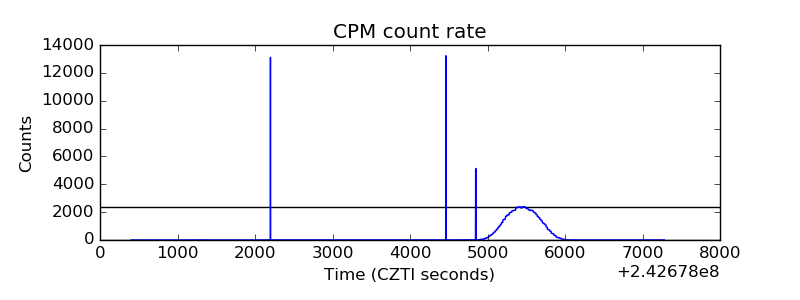 |
| CZT Counter | 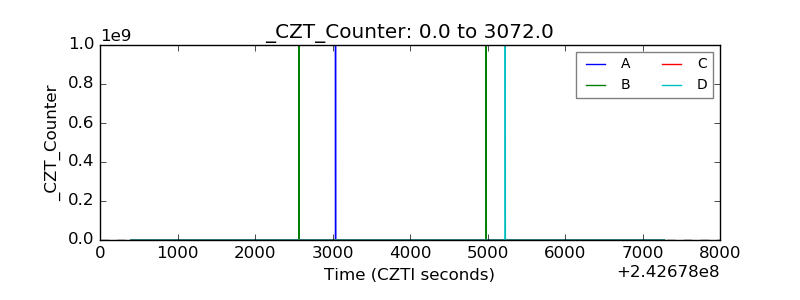 |
| +2.5 Volts monitor |  |
| +5 Volts monitor | 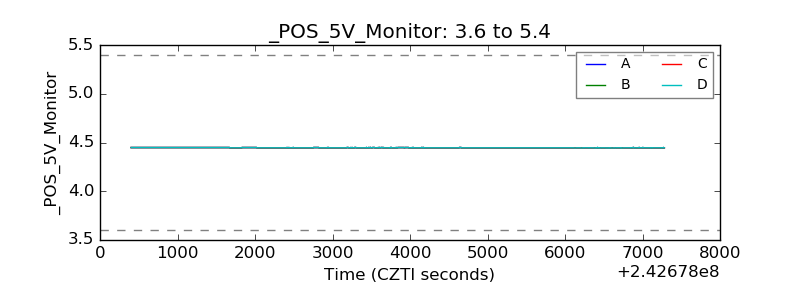 |
| _ROLL_ROT |  |
| _Roll_DEC | 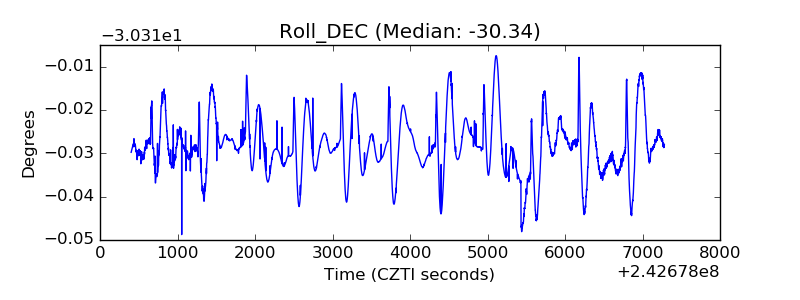 |
| _Roll_RA | 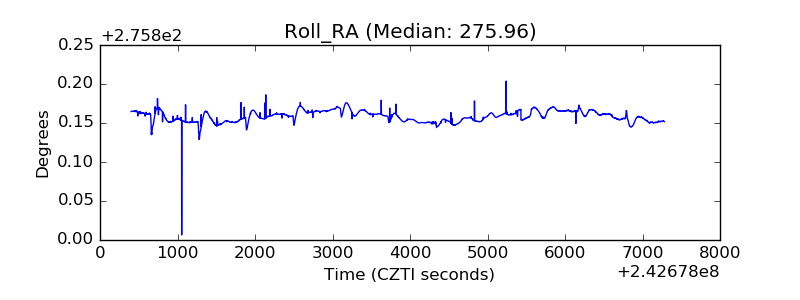 |
| Veto Counter | 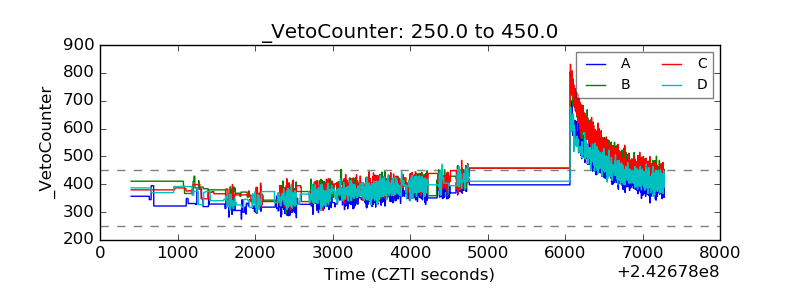 |