| Param | Original file | Final file |
|---|---|---|
| Filename | modeM0/AS1A03_107T01_9000001530_10552cztM0_level2.evt | modeM0/AS1A03_107T01_9000001530_10552cztM0_level2_quad_clean.evt |
| Size (bytes) | 1,821,885,120 | 284,411,520 |
| Size | 1.7 GB | 271.2 MB |
| Events in quadrant A | 11,576,556 | 1,769,180 |
| Events in quadrant B | 15,761,367 | 1,694,024 |
| Events in quadrant C | 11,234,992 | 1,765,650 |
| Events in quadrant D | 14,931,380 | 1,682,368 |
| Mode SS | |||
|---|---|---|---|
| Quadrant | BADHDUFLAG | Total packets | Discarded packets |
| A | 0 | 670 | 154 |
| B | 0 | 670 | 157 |
| C | 0 | 670 | 152 |
| D | 0 | 659 | 142 |
| Mode M9 | |||
|---|---|---|---|
| Quadrant | BADHDUFLAG | Total packets | Discarded packets |
| A | 0 | 79 | 18 |
| B | 0 | 86 | 25 |
| C | 0 | 86 | 25 |
| D | 0 | 79 | 18 |
| Mode M0 | |||
|---|---|---|---|
| Quadrant | BADHDUFLAG | Total packets | Discarded packets |
| A | 0 | 66671 | 15746 |
| B | 0 | 87808 | 25338 |
| C | 0 | 66936 | 16586 |
| D | 0 | 76320 | 15919 |
| Quadrant | Total seconds | Saturated seconds | Saturation percentage |
|---|---|---|---|
| A | 24690 | 145 | 0.587282% |
| B | 24006 | 1213 | 5.052903% |
| C | 24706 | 89 | 0.360236% |
| D | 25538 | 260 | 1.018091% |
Noise dominated data is calculated using 1-second bins in cleaned event files. If a bin has >2000 counts, and if more than 50% of those come from <1% of pixels, then it is considered to be noise-dominated and hence unusable.
| Quadrant | # 1 sec bins | Bins with >0 counts | Bins with >2000 counts | High rate bins dominated by noise | Noise dominated (total time) | Noise dominated (detector-on time) | Marked lightcurve |
|---|---|---|---|---|---|---|---|
| A | 31981 | 25655 | 9 | 9 | 0.03% | 0.04% | 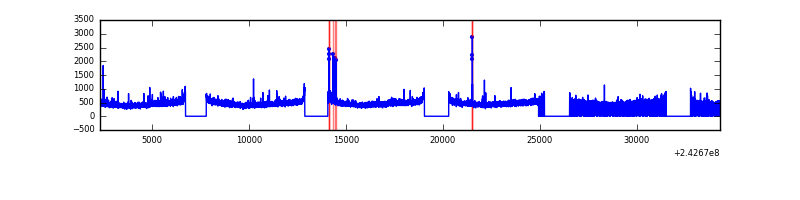 |
| B | 31981 | 25055 | 820 | 820 | 2.56% | 3.27% | 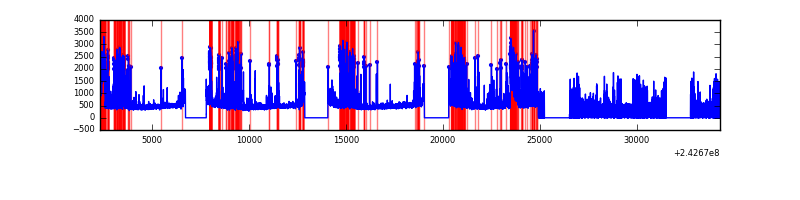 |
| C | 31980 | 25645 | 1 | 1 | 0.00% | 0.00% | 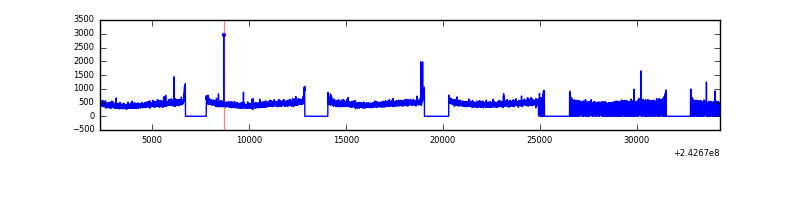 |
| D | 31981 | 25814 | 177 | 177 | 0.55% | 0.69% | 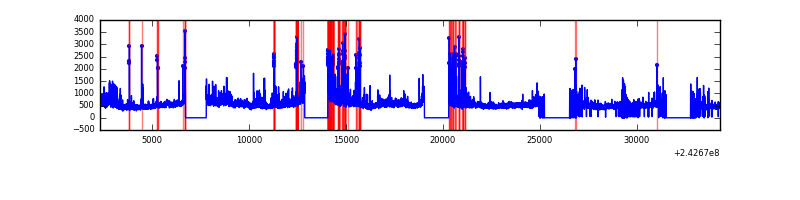 |
Top three noisy pixels from each quadrant. If the there are fewer than three noisy pixels in the level2.evt file, extra rows are filled as -1
| Pixel properties | Quadrant properties | ||||||
|---|---|---|---|---|---|---|---|
| Quadrant | DetID | PixID | Counts | Sigma | Mean | Median | Sigma |
| A | 13 | 251 | 79471 | 129.93 | 2935 | 2882 | 589.4 |
| A | 1 | 162 | 68862 | 111.94 | 2935 | 2882 | 589.4 |
| A | 15 | 174 | 59836 | 96.62 | 2935 | 2882 | 589.4 |
| B | 4 | 239 | 4121321 | 7723.77 | 2844 | 2780 | 533.2 |
| B | 11 | 51 | 222427 | 411.92 | 2844 | 2780 | 533.2 |
| B | 0 | 214 | 125624 | 230.38 | 2844 | 2780 | 533.2 |
| C | 4 | 175 | 26581 | 35.89 | 2864 | 2886 | 660.3 |
| C | 3 | 254 | 25959 | 34.94 | 2864 | 2886 | 660.3 |
| C | 13 | 61 | 21221 | 27.77 | 2864 | 2886 | 660.3 |
| D | 8 | 195 | 1618474 | 2317.34 | 2896 | 2818 | 697.2 |
| D | 1 | 52 | 1184919 | 1695.49 | 2896 | 2818 | 697.2 |
| D | 2 | 16 | 670366 | 957.47 | 2896 | 2818 | 697.2 |
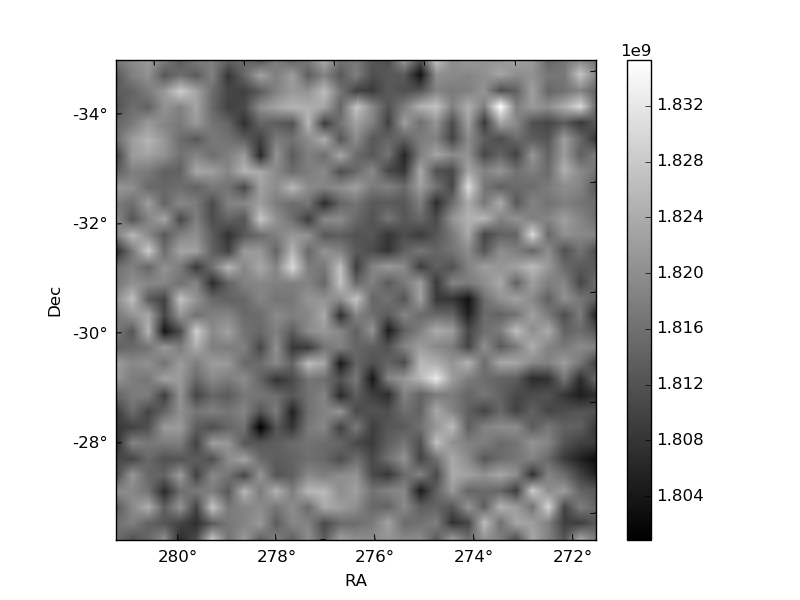
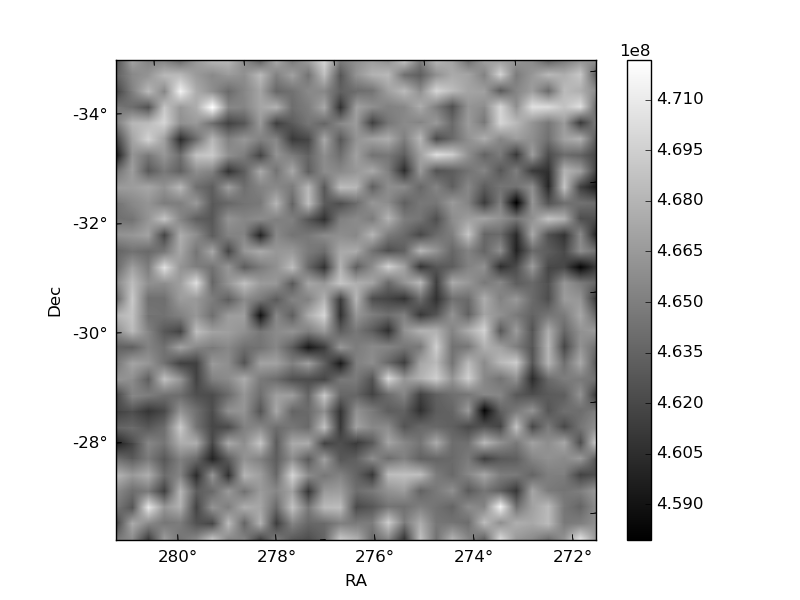
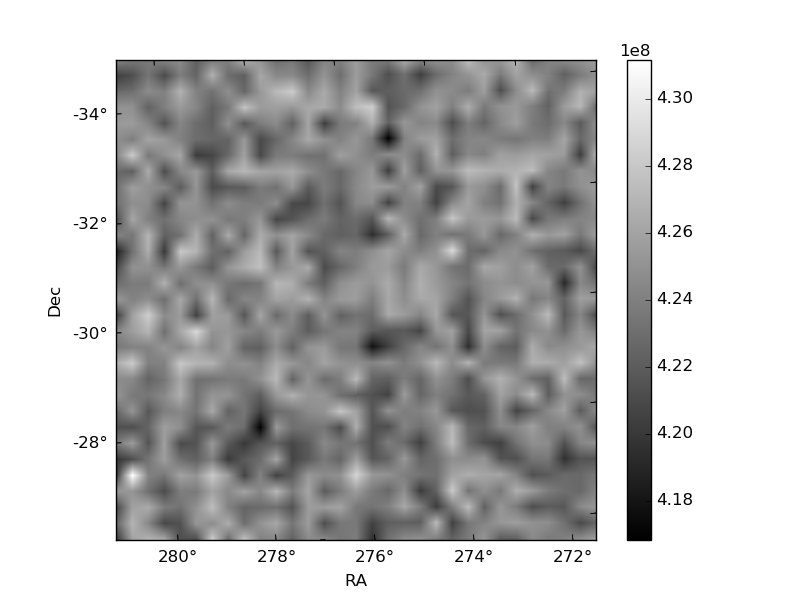
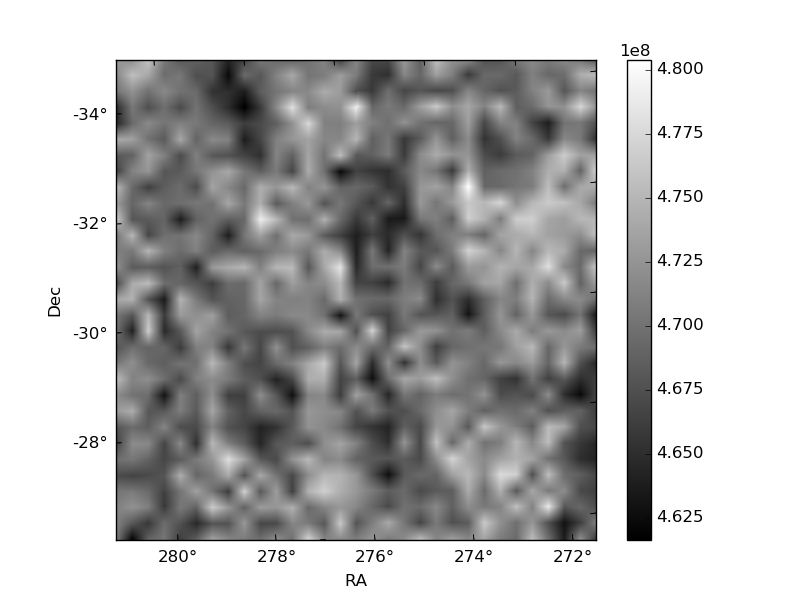
Histogram calculated using DETX and DETY for each event in the final _common_clean file
| Quadrant A | 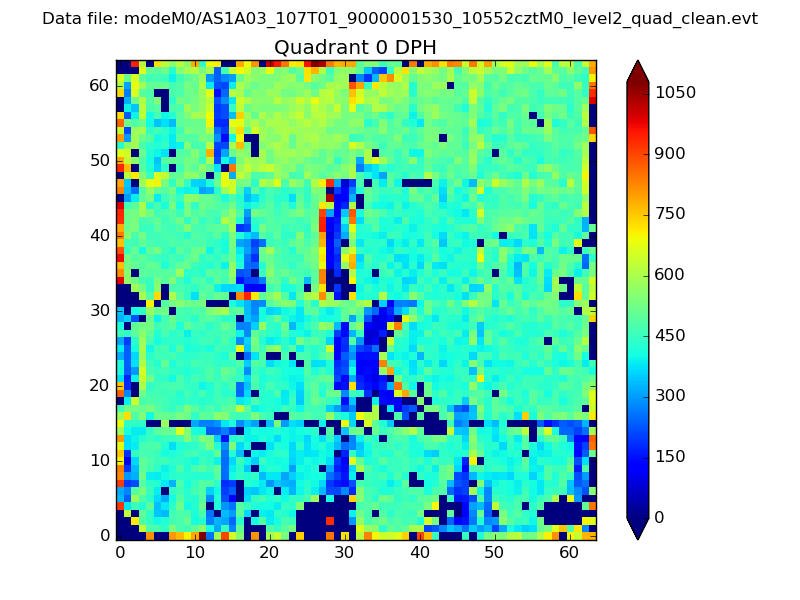 |
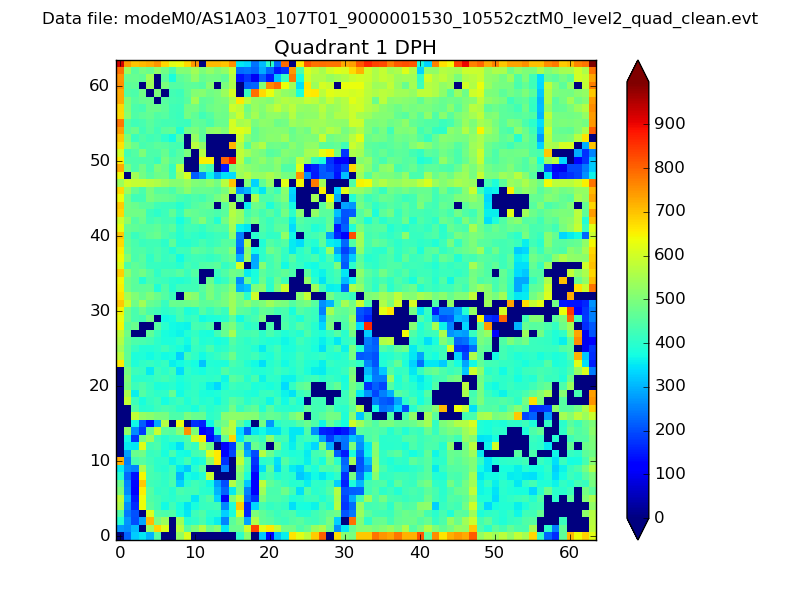 |
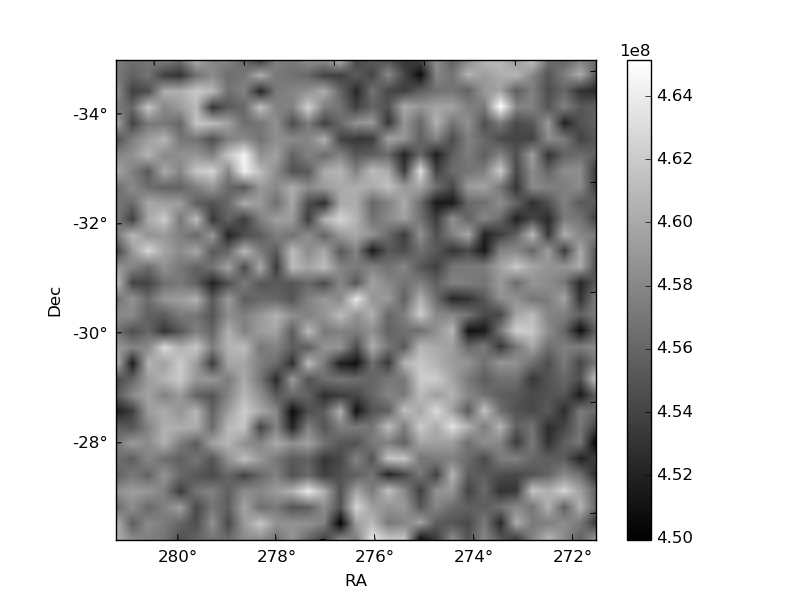
Quadrant B |
|---|---|---|---|
| Quadrant D | 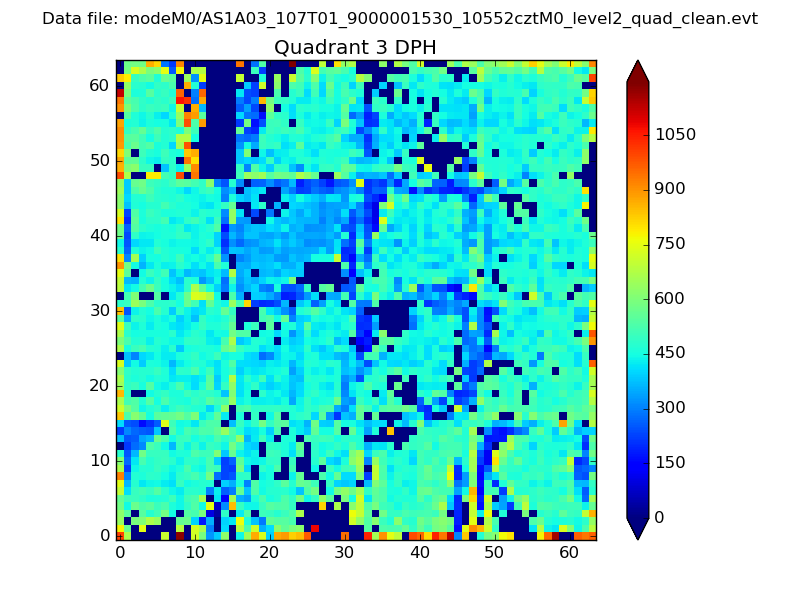 |
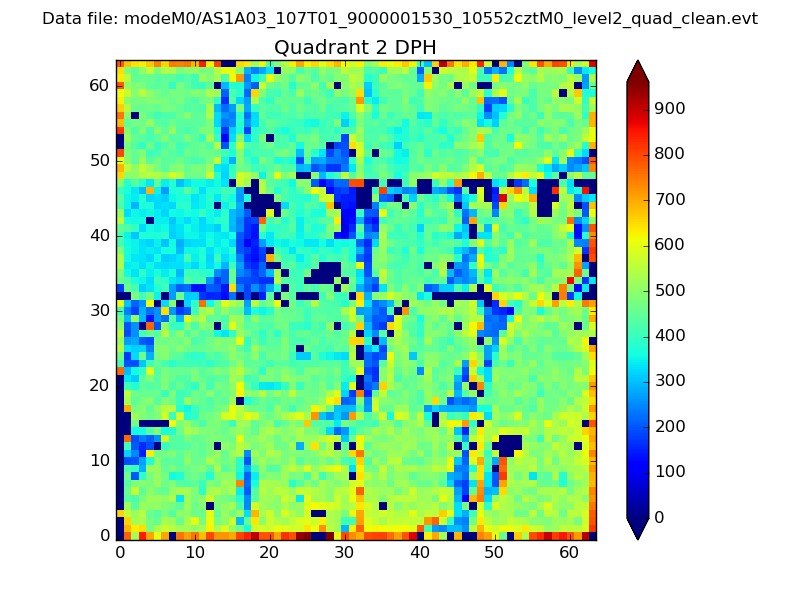 |
Quadrant C |
| Plot type | Count rate plots | Images |
|---|---|---|
| Comparison with Poisson distribution Blue bars denote a histogram of data divided into 1 sec bins. Red curve is a Poisson curve with rate = median count rate of data. |
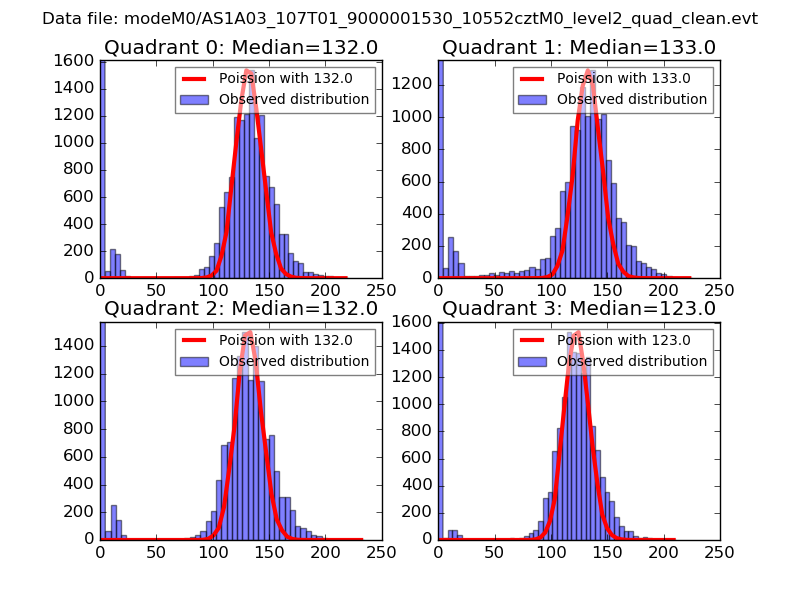 |
 |
| Quadrant-wise count rates Data is divided into 100 sec bins |
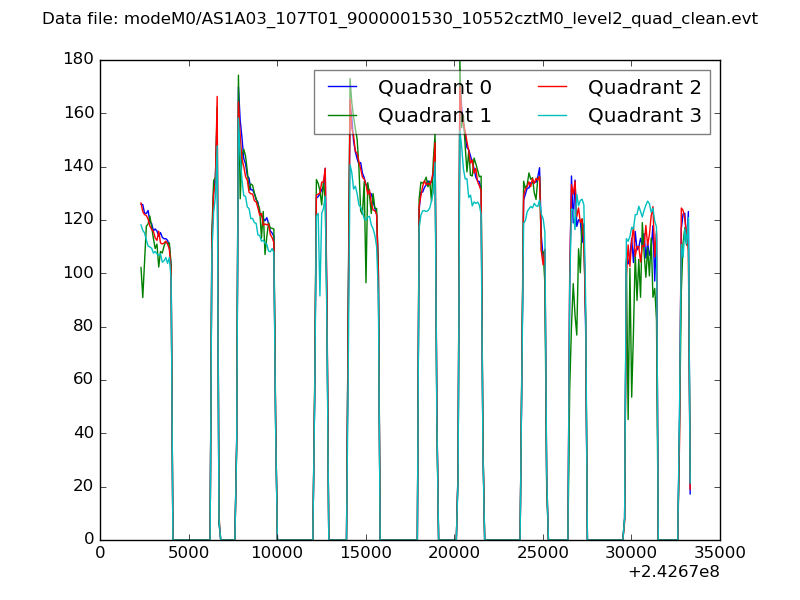 |
|
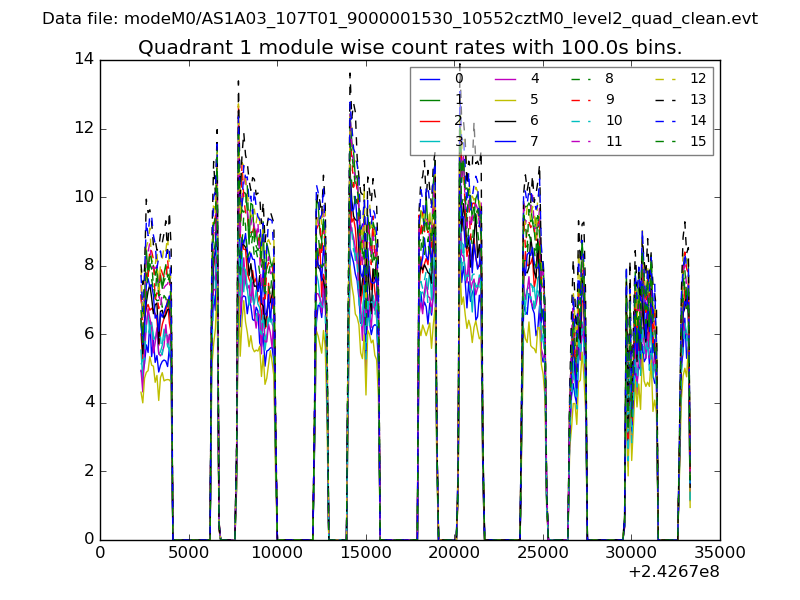
| Module-wise count rates for Quadrant A Data is divided into 100 sec bins |
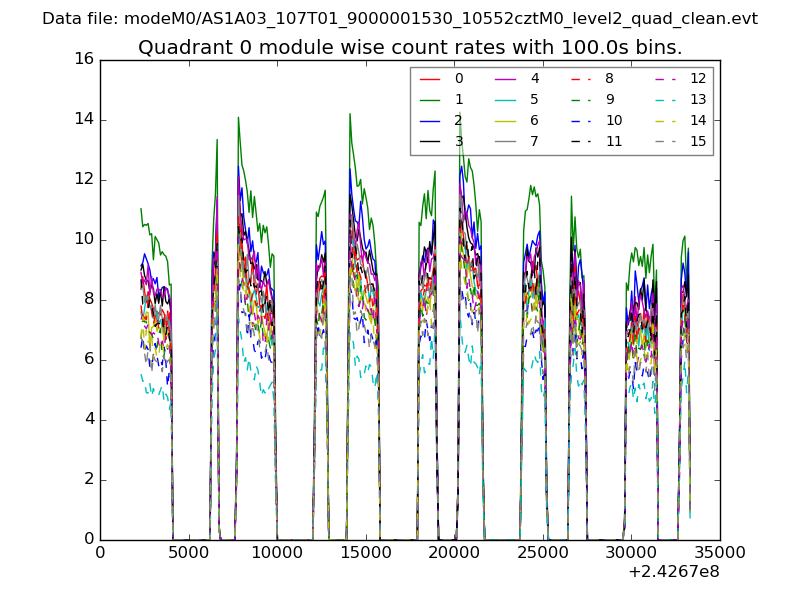 |
 |
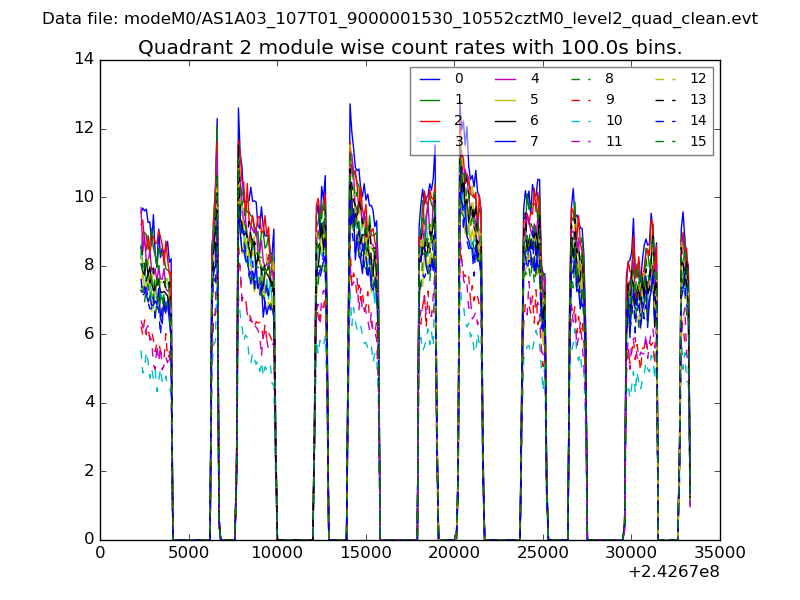
| Module-wise count rates for Quadrant B Data is divided into 100 sec bins |
 |
 |
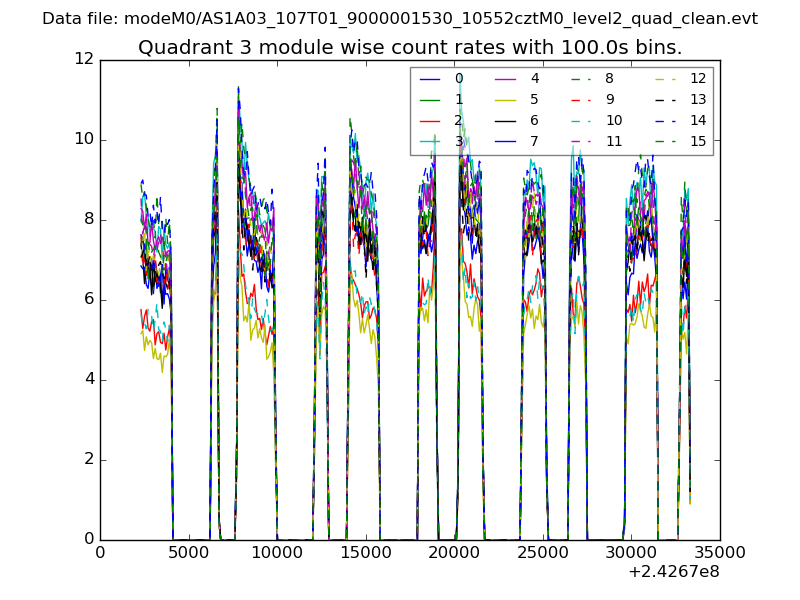
| Module-wise count rates for Quadrant C Data is divided into 100 sec bins |
 |
 |
| Module-wise count rates for Quadrant D Data is divided into 100 sec bins |
 |
 |
| Parameter | Plot |
|---|---|
| CZT HV Monitor | 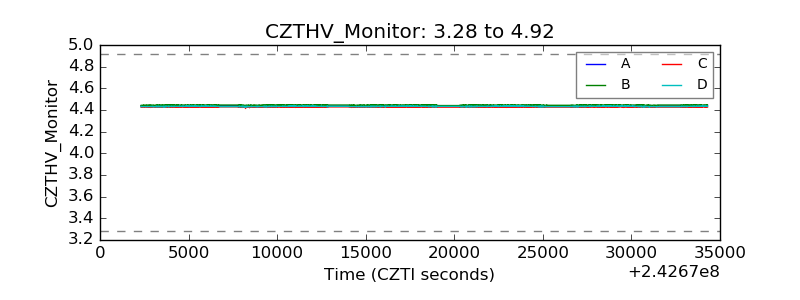 |
| D_VDD | 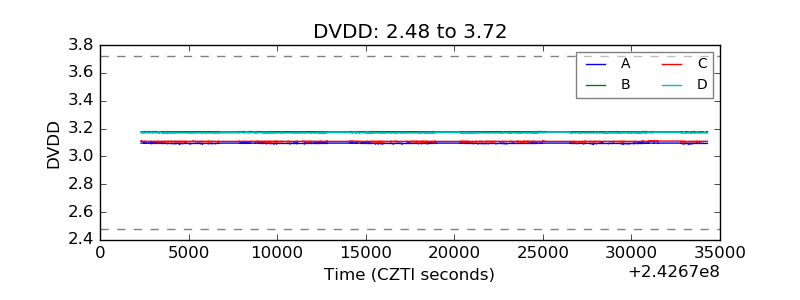 |
| Temperature 1 | 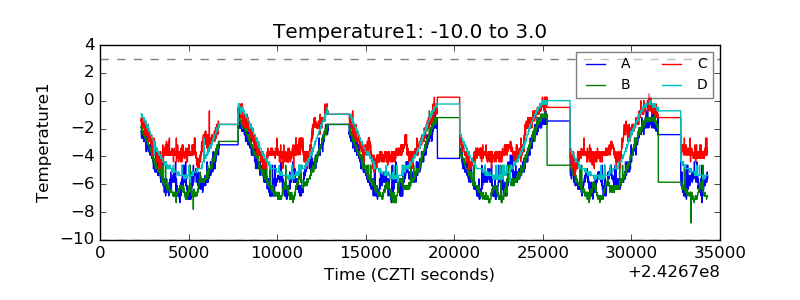 |
| Veto HV Monitor | 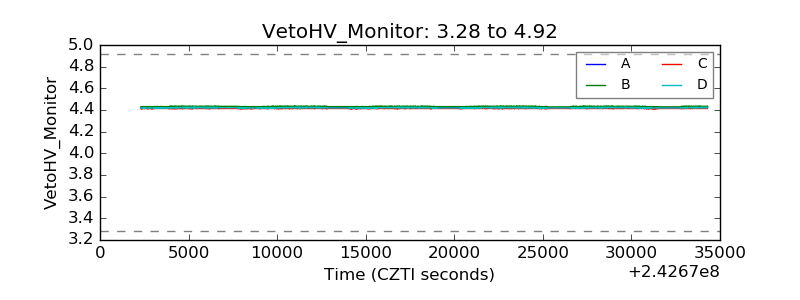 |
| Veto LLD | 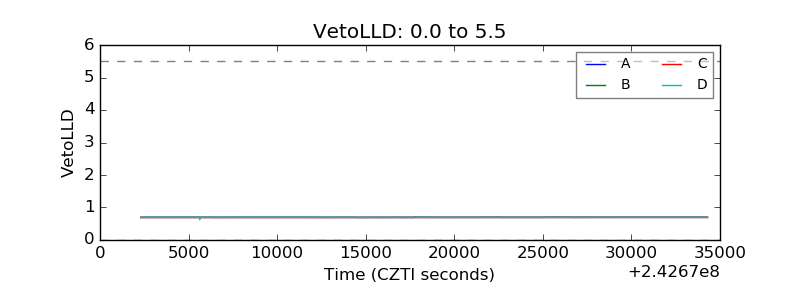 |
| Alpha Counter | 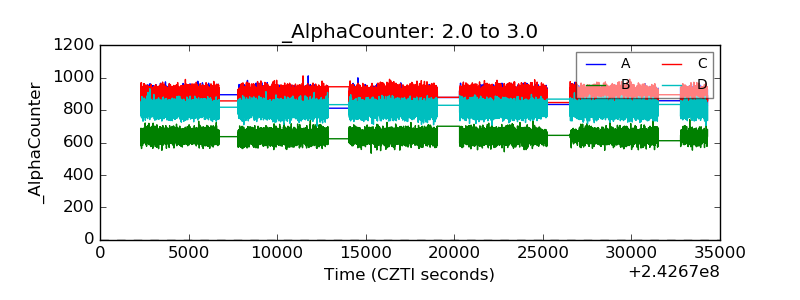 |
| _CPM_Rate | 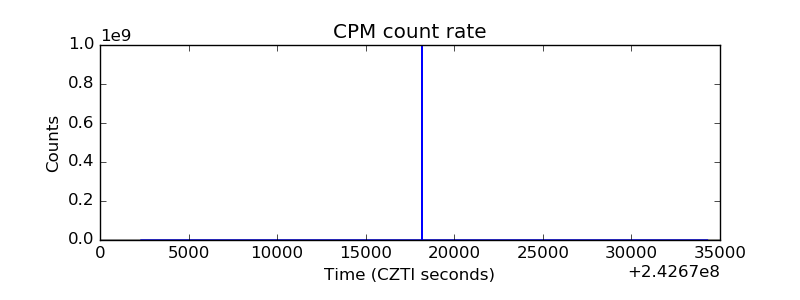 |
| CZT Counter | 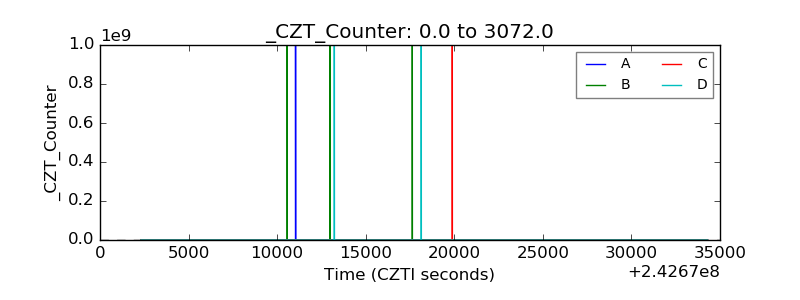 |
| +2.5 Volts monitor | 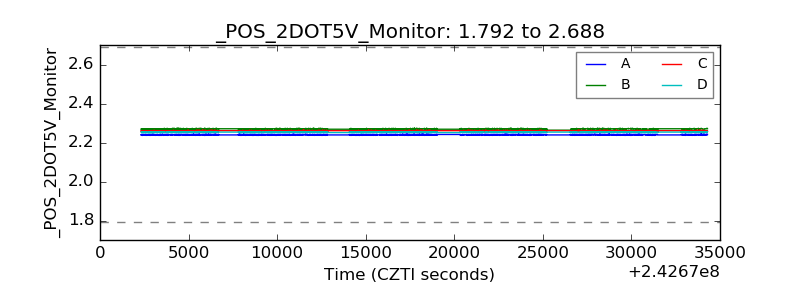 |
| +5 Volts monitor |  |
| _ROLL_ROT | 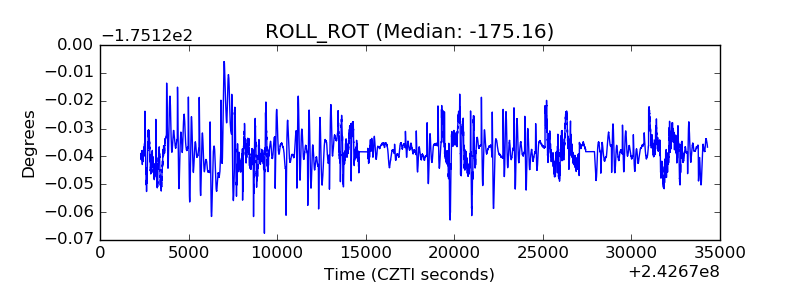 |
| _Roll_DEC | 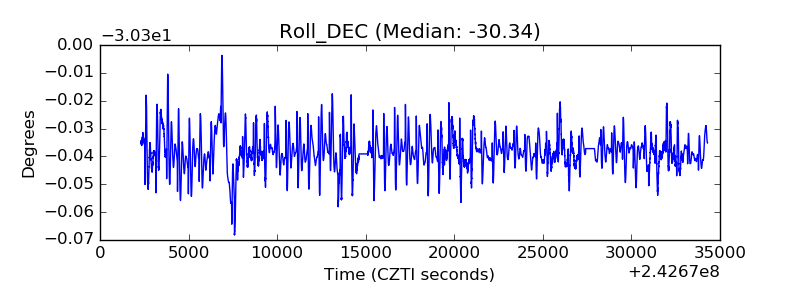 |
| _Roll_RA | 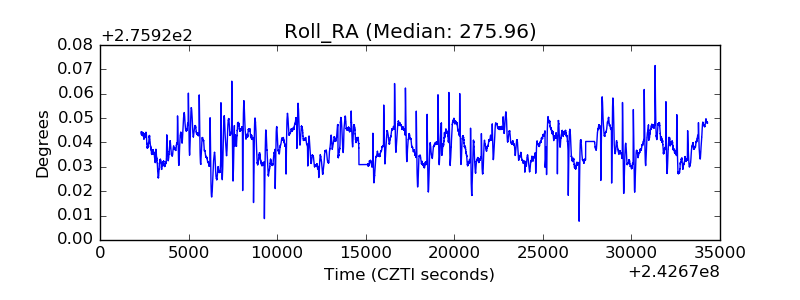 |
| Veto Counter | 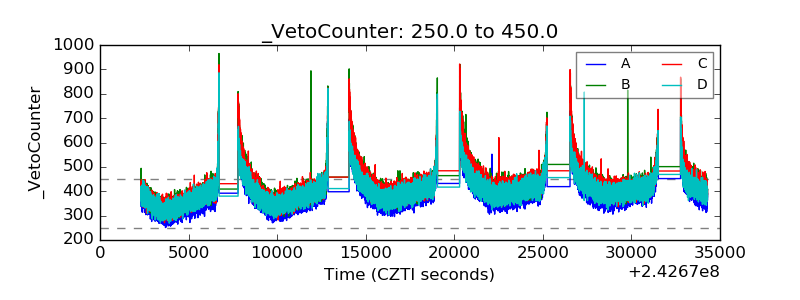 |