| Param | Original file | Final file |
|---|---|---|
| Filename | modeM0/AS1A03_107T01_9000001530_10553cztM0_level2.evt | modeM0/AS1A03_107T01_9000001530_10553cztM0_level2_quad_clean.evt |
| Size (bytes) | 2,272,775,040 | 356,944,320 |
| Size | 2.1 GB | 340.4 MB |
| Events in quadrant A | 14,454,522 | 2,224,139 |
| Events in quadrant B | 20,103,013 | 2,165,111 |
| Events in quadrant C | 13,999,733 | 2,212,963 |
| Events in quadrant D | 18,200,761 | 2,097,889 |
| Mode SS | |||
|---|---|---|---|
| Quadrant | BADHDUFLAG | Total packets | Discarded packets |
| A | 0 | 786 | 154 |
| B | 0 | 786 | 148 |
| C | 0 | 786 | 149 |
| D | 0 | 772 | 140 |
| Mode M9 | |||
|---|---|---|---|
| Quadrant | BADHDUFLAG | Total packets | Discarded packets |
| A | 0 | 103 | 21 |
| B | 0 | 106 | 24 |
| C | 0 | 106 | 24 |
| D | 0 | 98 | 16 |
| Mode M0 | |||
|---|---|---|---|
| Quadrant | BADHDUFLAG | Total packets | Discarded packets |
| A | 0 | 78746 | 15520 |
| B | 0 | 102077 | 22734 |
| C | 0 | 78945 | 16486 |
| D | 0 | 88817 | 14892 |
| Quadrant | Total seconds | Saturated seconds | Saturation percentage |
|---|---|---|---|
| A | 30597 | 165 | 0.539269% |
| B | 30094 | 1663 | 5.526018% |
| C | 30596 | 108 | 0.352987% |
| D | 31527 | 282 | 0.894471% |
Noise dominated data is calculated using 1-second bins in cleaned event files. If a bin has >2000 counts, and if more than 50% of those come from <1% of pixels, then it is considered to be noise-dominated and hence unusable.
| Quadrant | # 1 sec bins | Bins with >0 counts | Bins with >2000 counts | High rate bins dominated by noise | Noise dominated (total time) | Noise dominated (detector-on time) | Marked lightcurve |
|---|---|---|---|---|---|---|---|
| A | 38994 | 31562 | 9 | 9 | 0.02% | 0.03% | 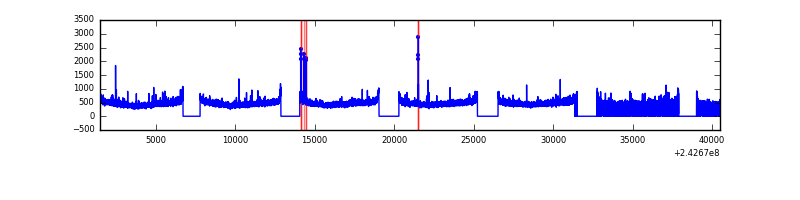 |
| B | 38995 | 31126 | 1142 | 1142 | 2.93% | 3.67% | 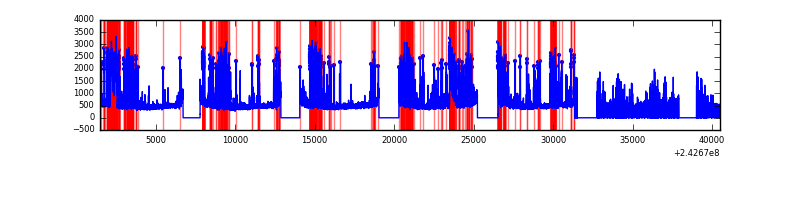 |
| C | 38995 | 31533 | 2 | 2 | 0.01% | 0.01% | 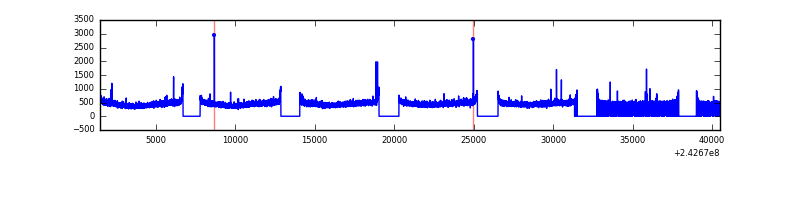 |
| D | 38995 | 31737 | 183 | 183 | 0.47% | 0.58% | 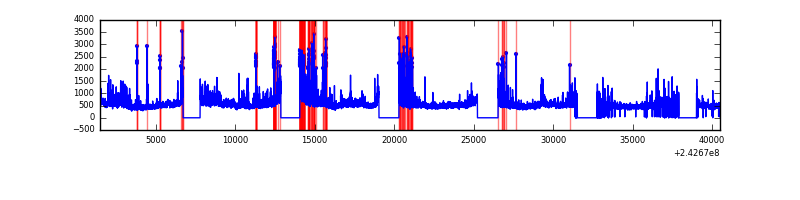 |
Top three noisy pixels from each quadrant. If the there are fewer than three noisy pixels in the level2.evt file, extra rows are filled as -1
| Pixel properties | Quadrant properties | ||||||
|---|---|---|---|---|---|---|---|
| Quadrant | DetID | PixID | Counts | Sigma | Mean | Median | Sigma |
| A | 13 | 251 | 105034 | 137.98 | 3659 | 3594 | 735.2 |
| A | 1 | 162 | 101341 | 132.95 | 3659 | 3594 | 735.2 |
| A | 15 | 174 | 63771 | 81.85 | 3659 | 3594 | 735.2 |
| B | 4 | 239 | 5381014 | 8018.5 | 3577 | 3492 | 670.6 |
| B | 11 | 51 | 287743 | 423.85 | 3577 | 3492 | 670.6 |
| B | 0 | 214 | 152053 | 221.52 | 3577 | 3492 | 670.6 |
| C | 14 | 234 | 38862 | 42.91 | 3565 | 3594 | 821.9 |
| C | 4 | 175 | 38263 | 42.18 | 3565 | 3594 | 821.9 |
| C | 3 | 254 | 28349 | 30.12 | 3565 | 3594 | 821.9 |
| D | 8 | 195 | 1900997 | 2176.43 | 3603 | 3505 | 871.8 |
| D | 1 | 52 | 1248995 | 1428.58 | 3603 | 3505 | 871.8 |
| D | 2 | 16 | 799999 | 913.58 | 3603 | 3505 | 871.8 |
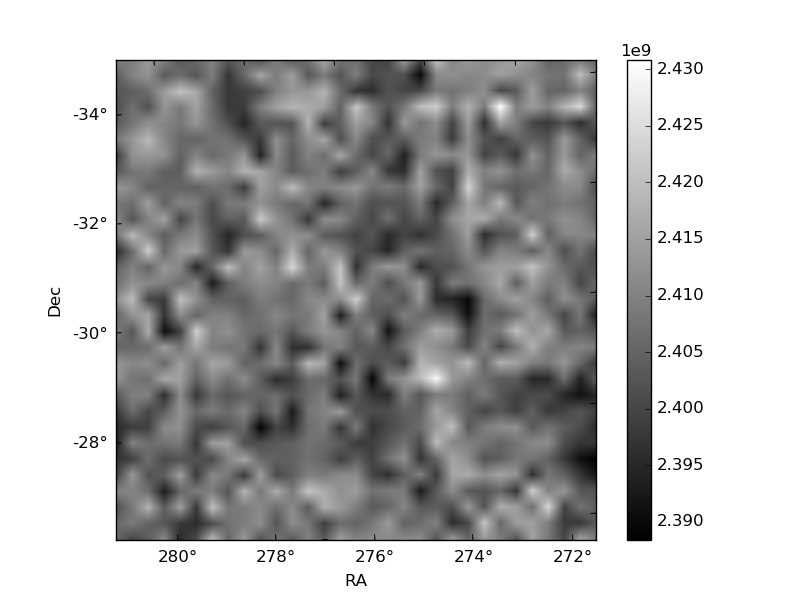
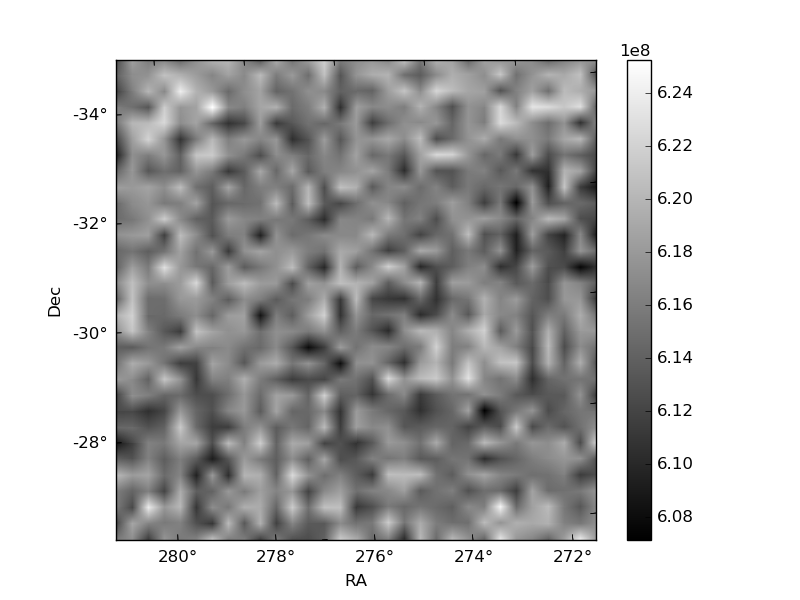
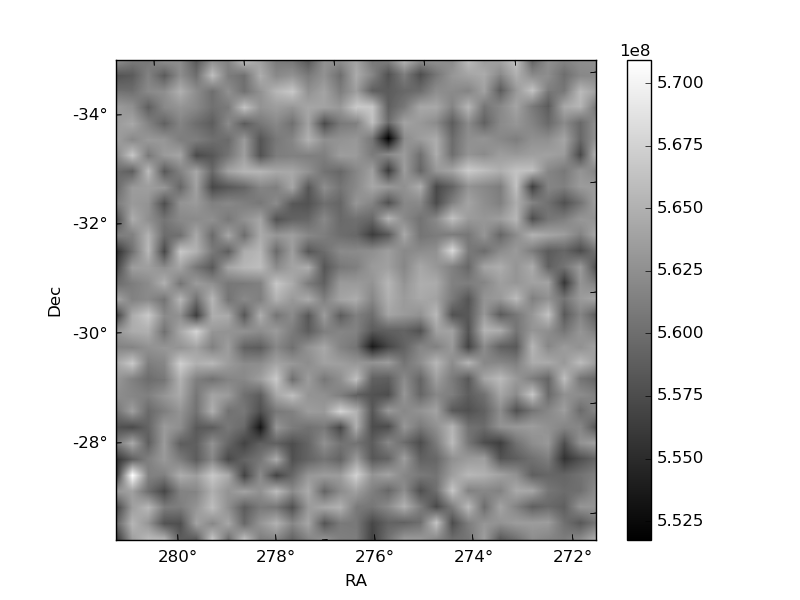
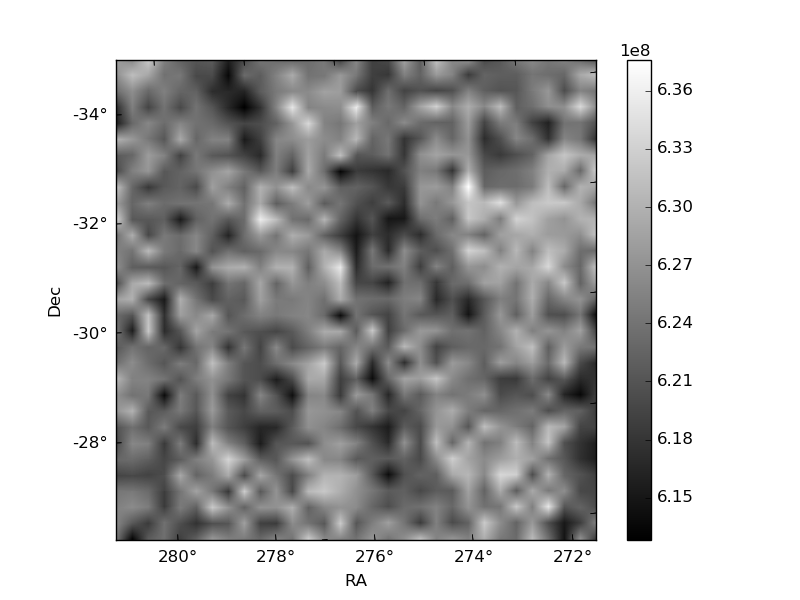
Histogram calculated using DETX and DETY for each event in the final _common_clean file
| Quadrant A | 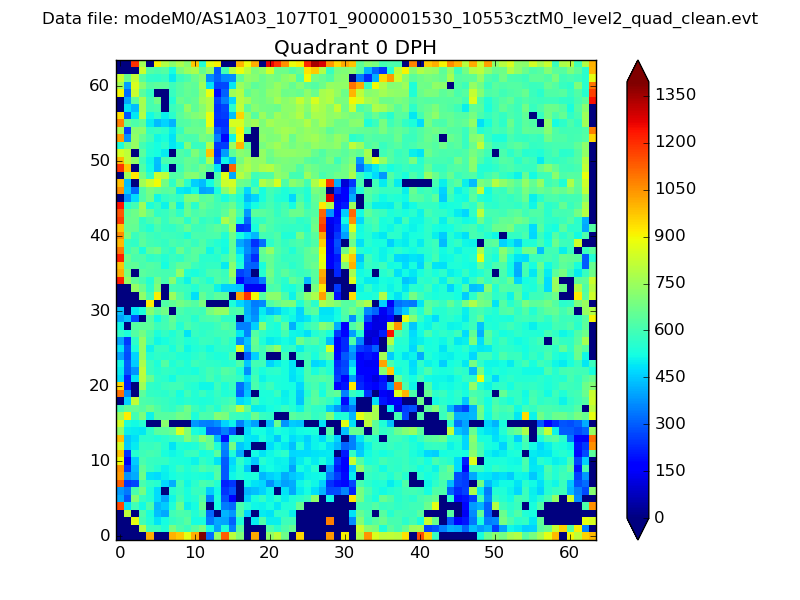 |
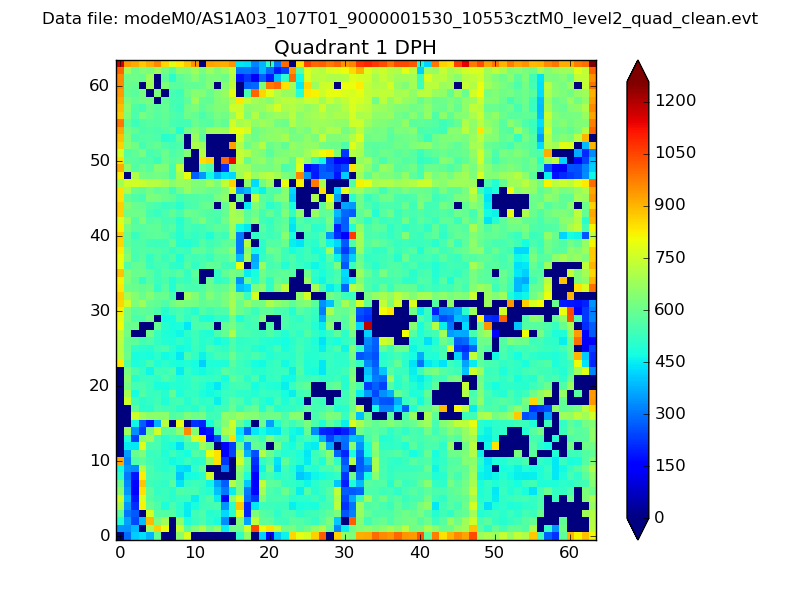 |
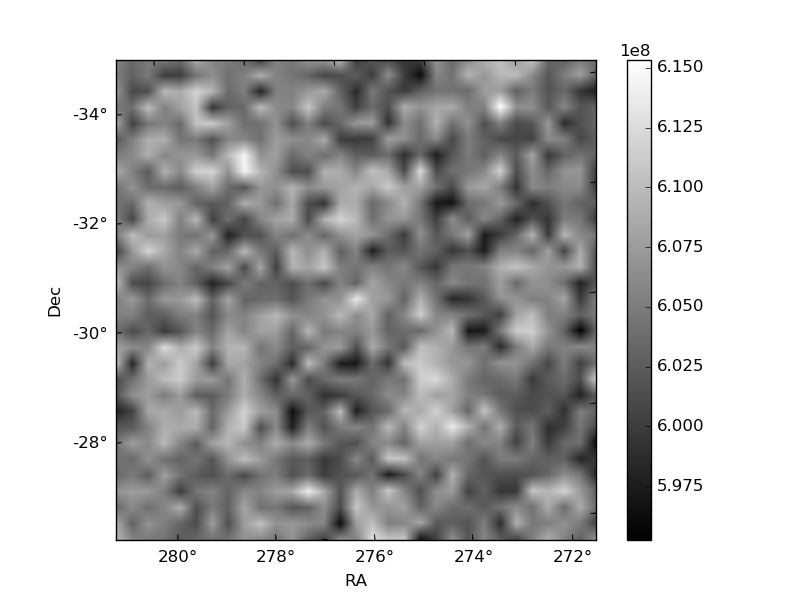
Quadrant B |
|---|---|---|---|
| Quadrant D | 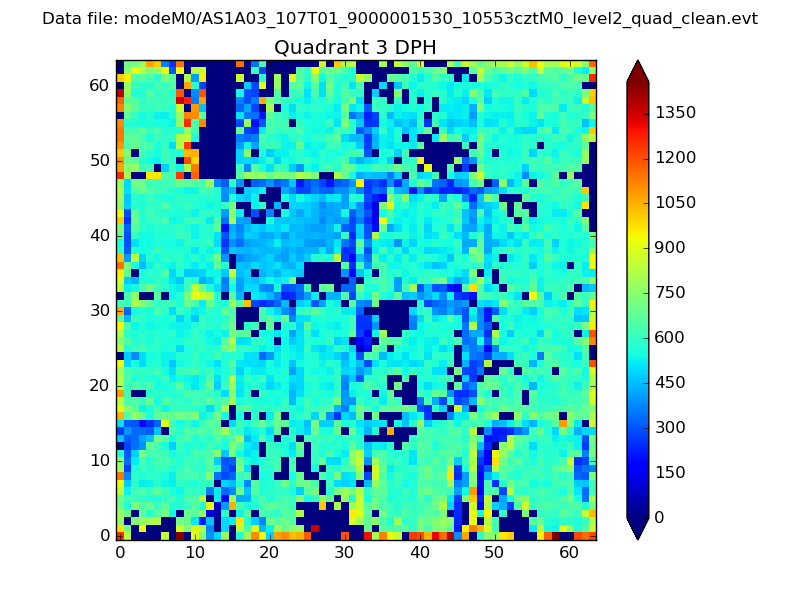 |
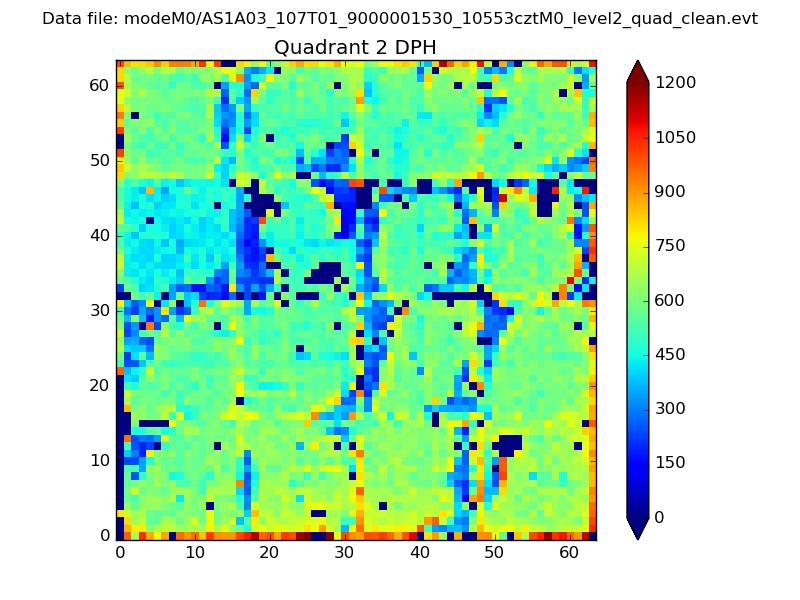 |
Quadrant C |
| Plot type | Count rate plots | Images |
|---|---|---|
| Comparison with Poisson distribution Blue bars denote a histogram of data divided into 1 sec bins. Red curve is a Poisson curve with rate = median count rate of data. |
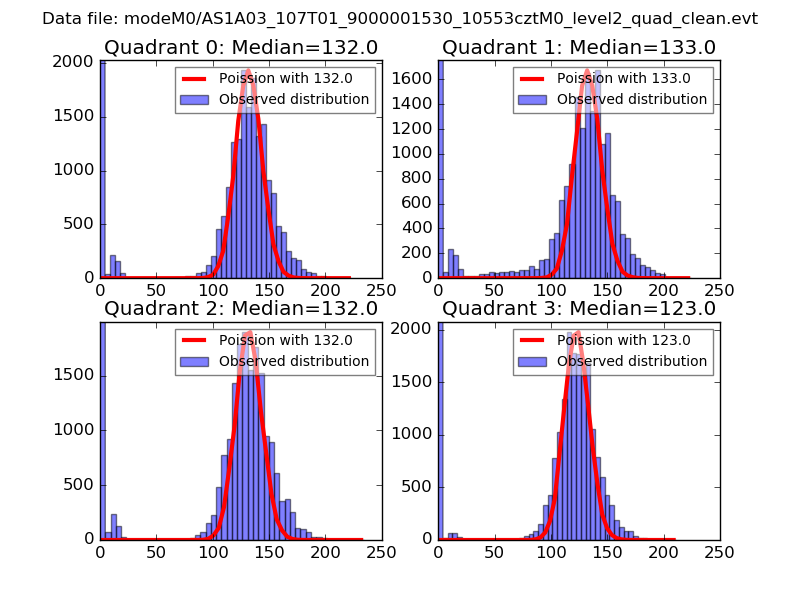 |
 |
| Quadrant-wise count rates Data is divided into 100 sec bins |
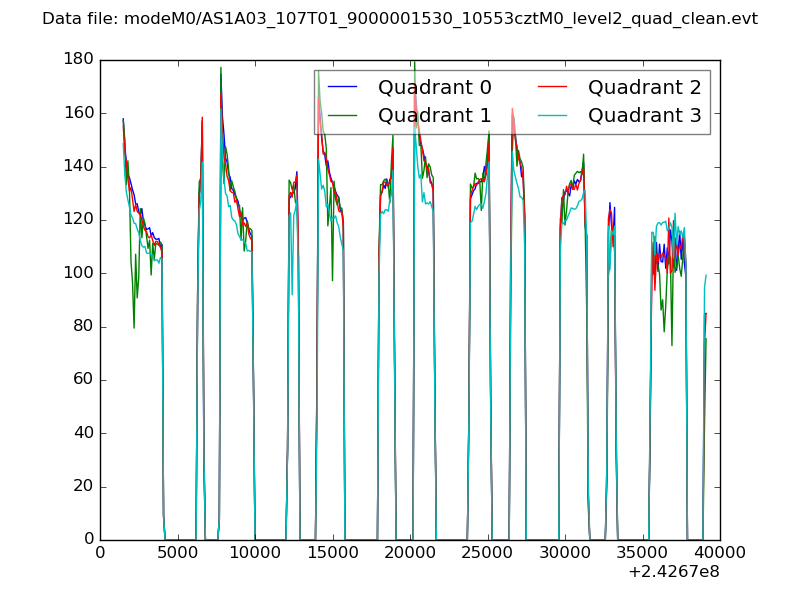 |
|
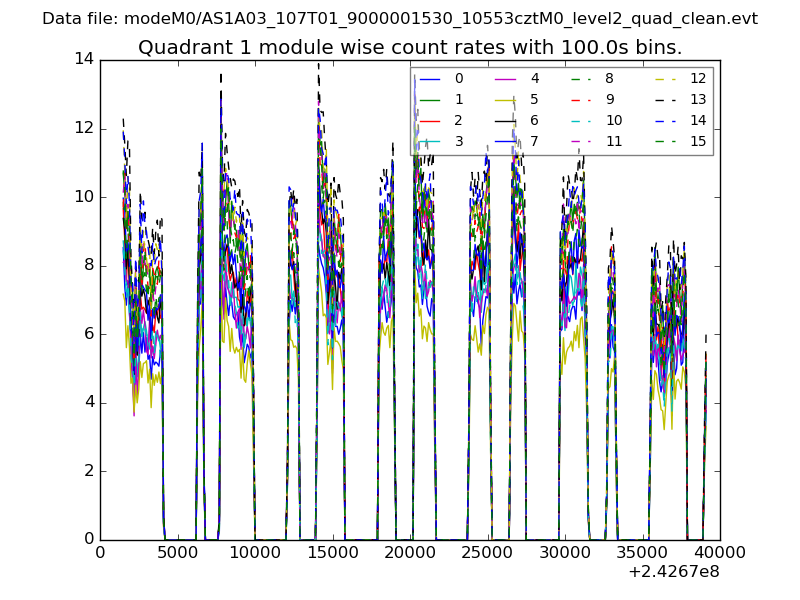
| Module-wise count rates for Quadrant A Data is divided into 100 sec bins |
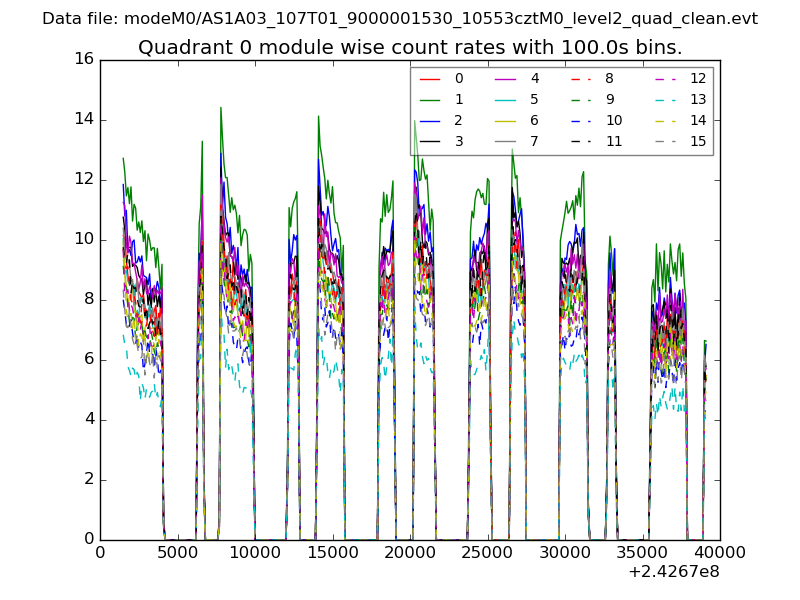 |
 |
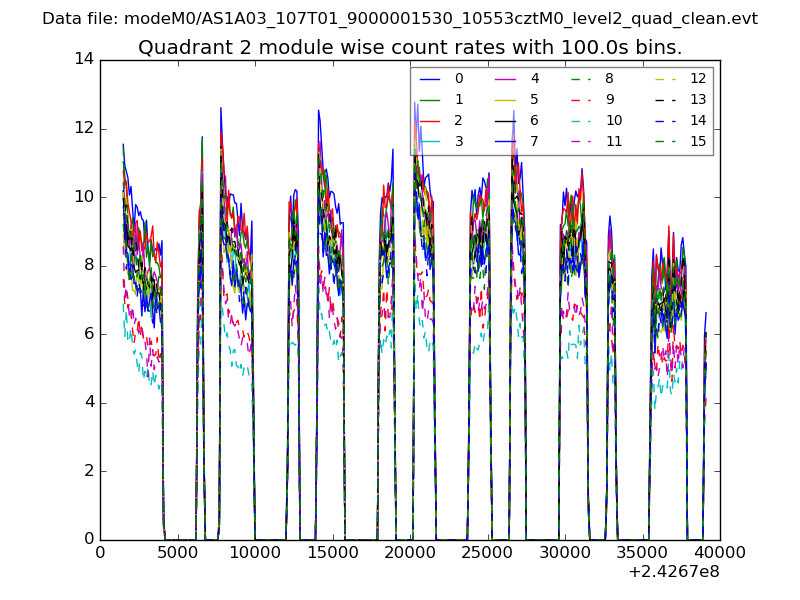
| Module-wise count rates for Quadrant B Data is divided into 100 sec bins |
 |
 |
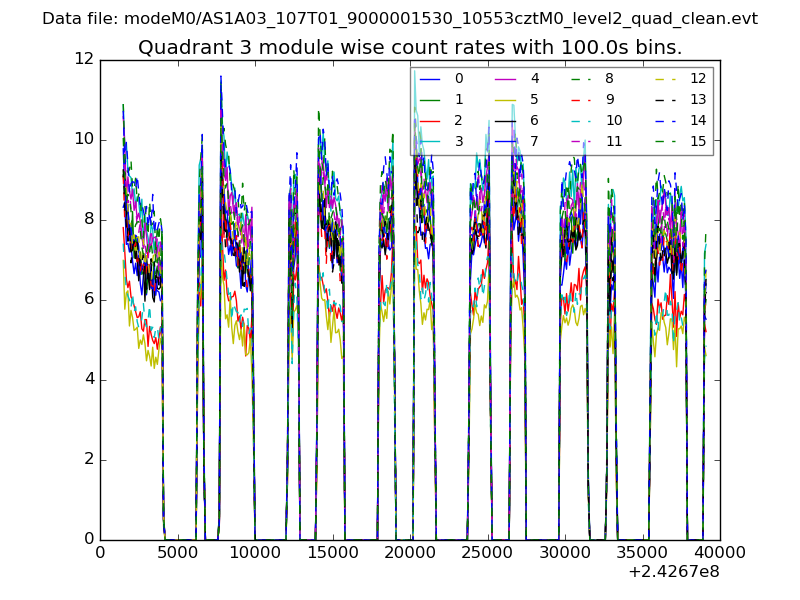
| Module-wise count rates for Quadrant C Data is divided into 100 sec bins |
 |
 |
| Module-wise count rates for Quadrant D Data is divided into 100 sec bins |
 |
 |
| Parameter | Plot |
|---|---|
| CZT HV Monitor | 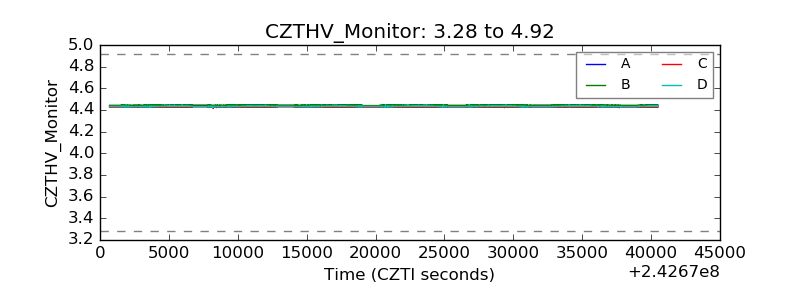 |
| D_VDD | 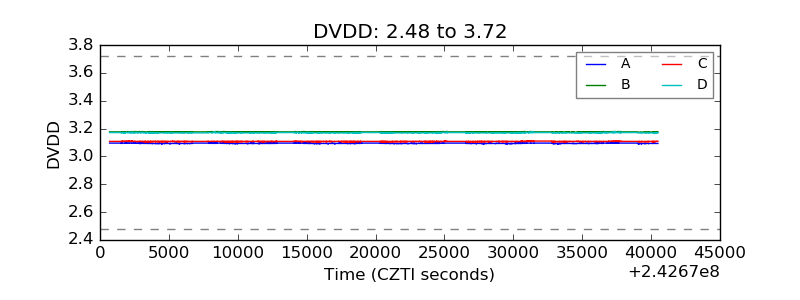 |
| Temperature 1 | 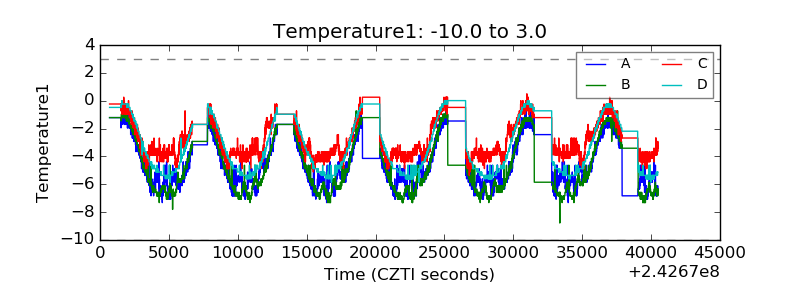 |
| Veto HV Monitor | 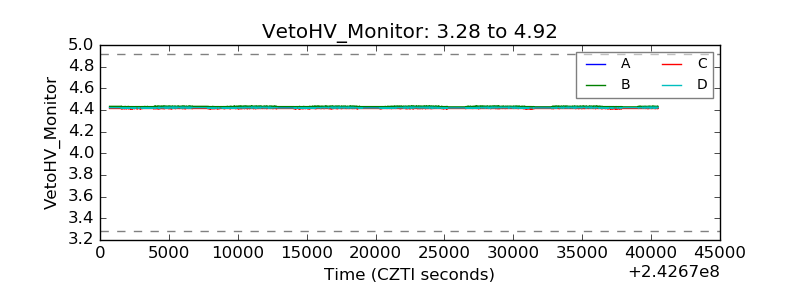 |
| Veto LLD | 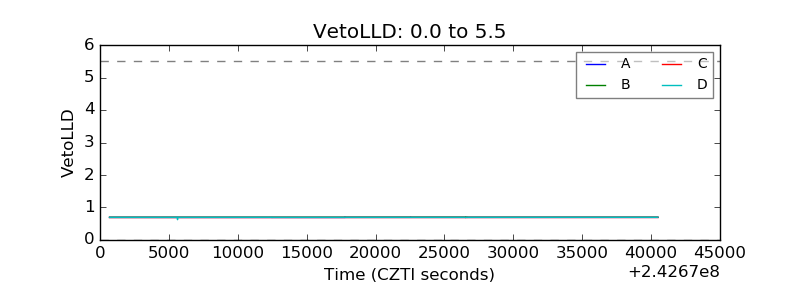 |
| Alpha Counter | 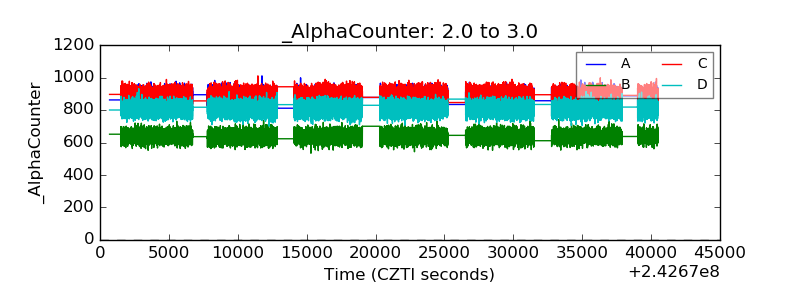 |
| _CPM_Rate | 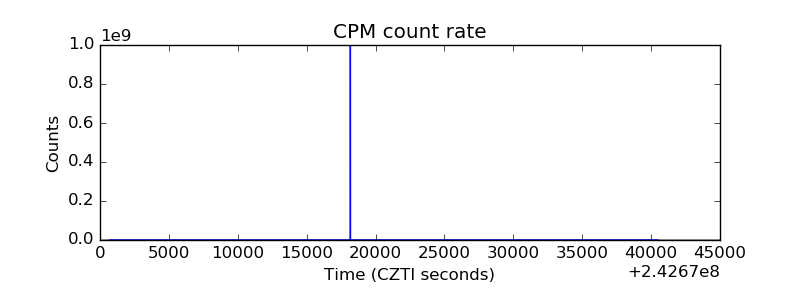 |
| CZT Counter | 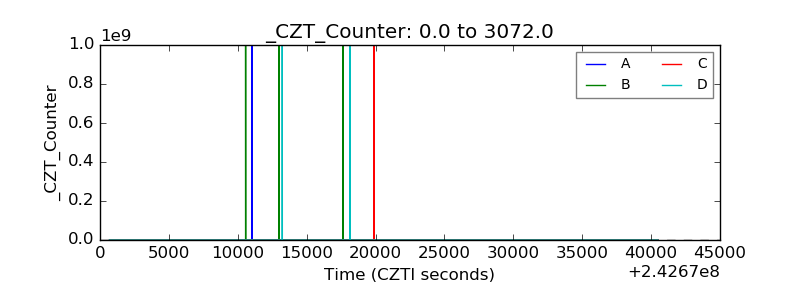 |
| +2.5 Volts monitor |  |
| +5 Volts monitor |  |
| _ROLL_ROT |  |
| _Roll_DEC |  |
| _Roll_RA | 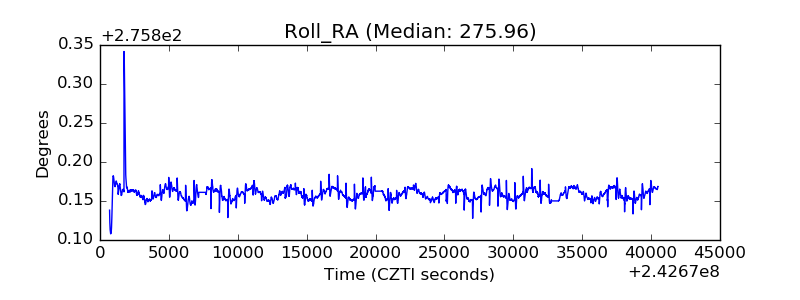 |
| Veto Counter | 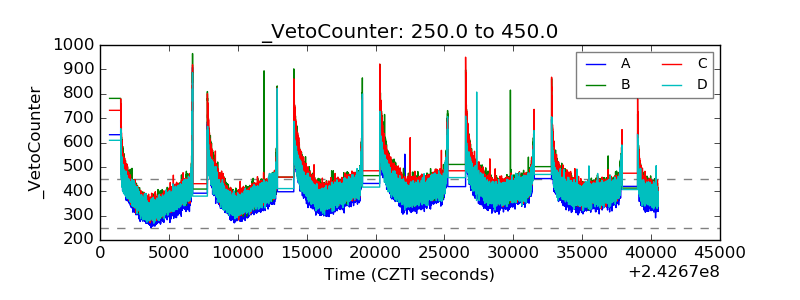 |