| Param | Original file | Final file |
|---|---|---|
| Filename | modeM0/AS1A03_107T01_9000001530_10556cztM0_level2.evt | modeM0/AS1A03_107T01_9000001530_10556cztM0_level2_quad_clean.evt |
| Size (bytes) | 394,485,120 | 60,062,400 |
| Size | 376.2 MB | 57.3 MB |
| Events in quadrant A | 2,513,360 | 370,907 |
| Events in quadrant B | 3,107,716 | 368,764 |
| Events in quadrant C | 2,411,947 | 370,796 |
| Events in quadrant D | 3,561,655 | 345,578 |
| Mode SS | |||
|---|---|---|---|
| Quadrant | BADHDUFLAG | Total packets | Discarded packets |
| A | 0 | 108 | 0 |
| B | 0 | 108 | 0 |
| C | 0 | 108 | 0 |
| D | 0 | 108 | 0 |
| Mode M9 | |||
|---|---|---|---|
| Quadrant | BADHDUFLAG | Total packets | Discarded packets |
| A | 0 | 1 | 0 |
| B | 0 | 1 | 0 |
| C | 0 | 1 | 0 |
| D | 0 | 1 | 0 |
| Mode M0 | |||
|---|---|---|---|
| Quadrant | BADHDUFLAG | Total packets | Discarded packets |
| A | 0 | 10935 | 1 |
| B | 0 | 12607 | 1 |
| C | 0 | 10897 | 1 |
| D | 0 | 13754 | 1 |
| Quadrant | Total seconds | Saturated seconds | Saturation percentage |
|---|---|---|---|
| A | 5165 | 242 | 4.685382% |
| B | 5165 | 382 | 7.395934% |
| C | 5165 | 199 | 3.852856% |
| D | 5165 | 457 | 8.848015% |
Noise dominated data is calculated using 1-second bins in cleaned event files. If a bin has >2000 counts, and if more than 50% of those come from <1% of pixels, then it is considered to be noise-dominated and hence unusable.
| Quadrant | # 1 sec bins | Bins with >0 counts | Bins with >2000 counts | High rate bins dominated by noise | Noise dominated (total time) | Noise dominated (detector-on time) | Marked lightcurve |
|---|---|---|---|---|---|---|---|
| A | 5330 | 5167 | 1 | 1 | 0.02% | 0.02% | 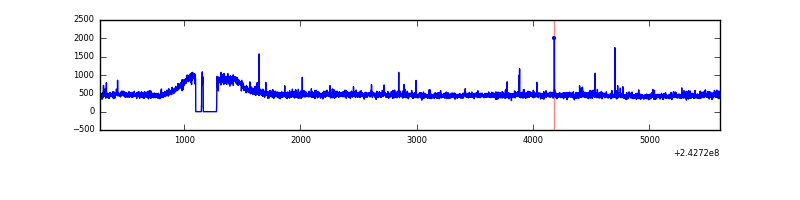 |
| B | 5330 | 5167 | 78 | 78 | 1.46% | 1.51% | 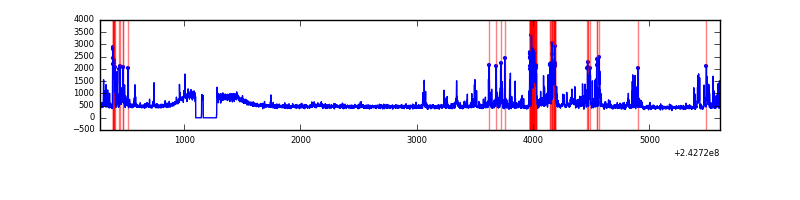 |
| C | 5330 | 5167 | 0 | 0 | 0.00% | 0.00% | 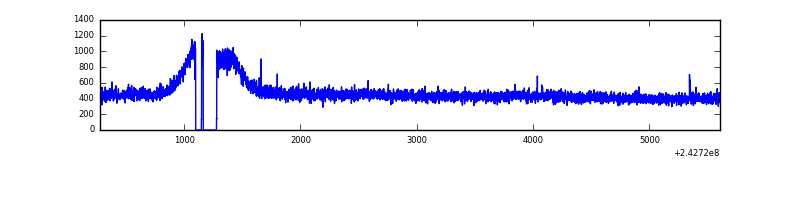 |
| D | 5330 | 5167 | 185 | 185 | 3.47% | 3.58% | 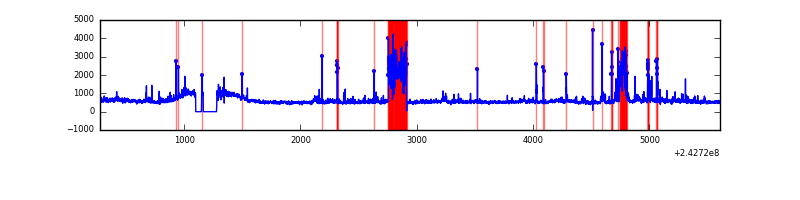 |
Top three noisy pixels from each quadrant. If the there are fewer than three noisy pixels in the level2.evt file, extra rows are filled as -1
| Pixel properties | Quadrant properties | ||||||
|---|---|---|---|---|---|---|---|
| Quadrant | DetID | PixID | Counts | Sigma | Mean | Median | Sigma |
| A | 1 | 162 | 32347 | 240.89 | 633 | 616 | 131.7 |
| A | 8 | 5 | 13432 | 97.29 | 633 | 616 | 131.7 |
| A | 1 | 161 | 7843 | 54.86 | 633 | 616 | 131.7 |
| B | 4 | 239 | 577962 | 4624.95 | 628 | 612 | 124.8 |
| B | 0 | 214 | 29762 | 233.51 | 628 | 612 | 124.8 |
| B | 11 | 51 | 24348 | 190.14 | 628 | 612 | 124.8 |
| C | 13 | 61 | 4624 | 27.38 | 617 | 617 | 146.3 |
| C | 4 | 175 | 3173 | 17.47 | 617 | 617 | 146.3 |
| C | 1 | 3 | 1855 | 8.46 | 617 | 617 | 146.3 |
| D | 1 | 52 | 657786 | 4491.62 | 593 | 575 | 146.3 |
| D | 8 | 195 | 351764 | 2400.16 | 593 | 575 | 146.3 |
| D | 2 | 16 | 163948 | 1116.55 | 593 | 575 | 146.3 |
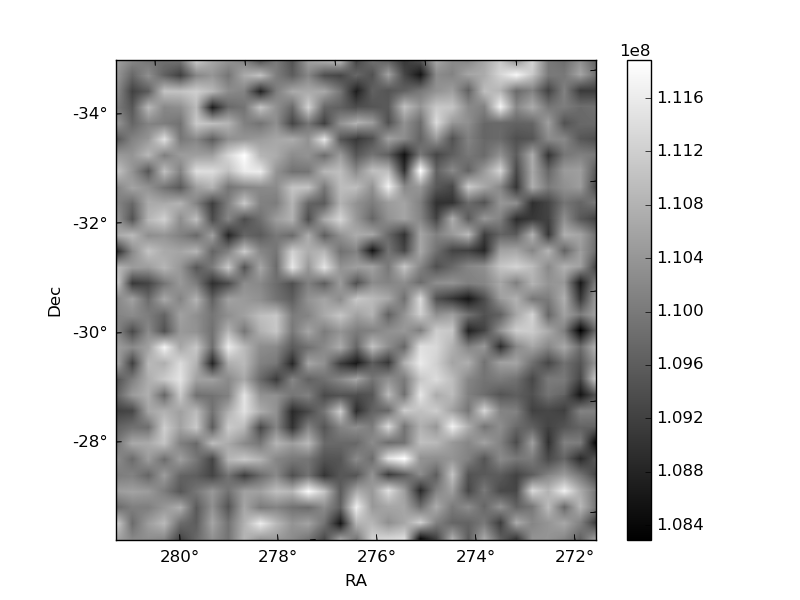
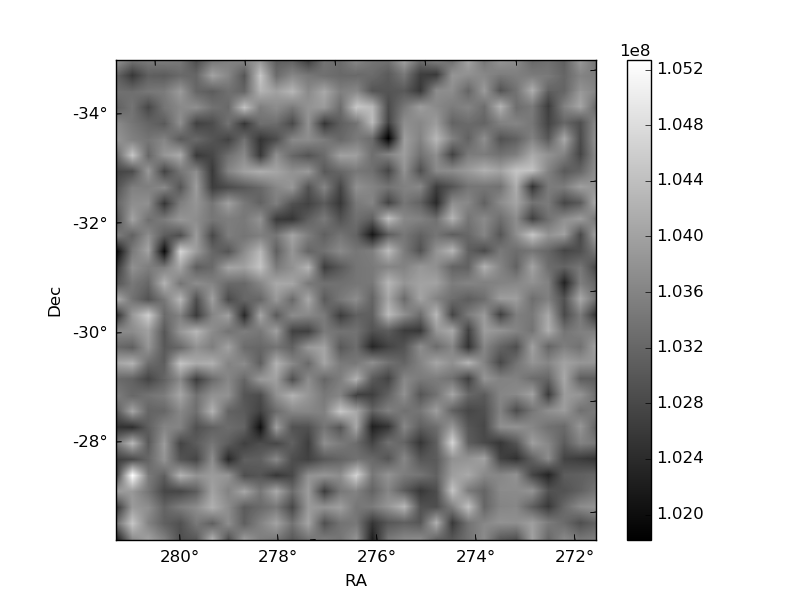
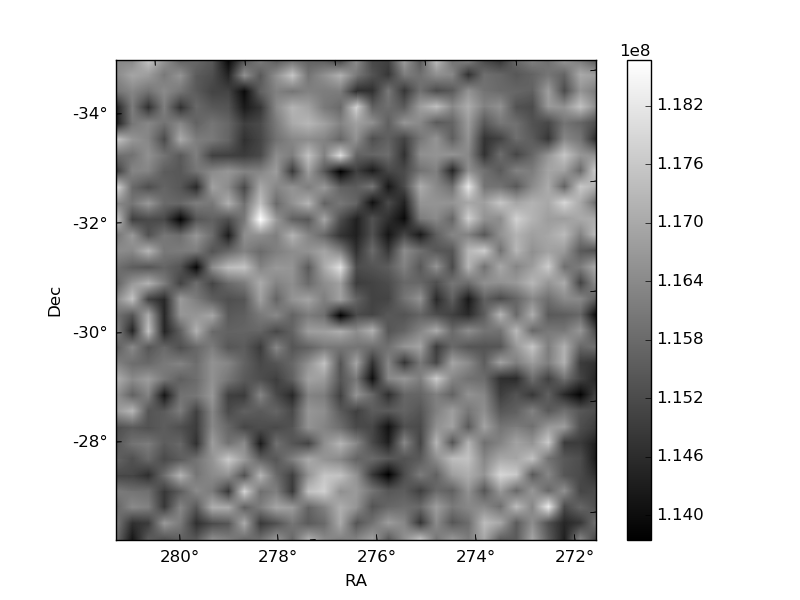
Histogram calculated using DETX and DETY for each event in the final _common_clean file
| Quadrant A | 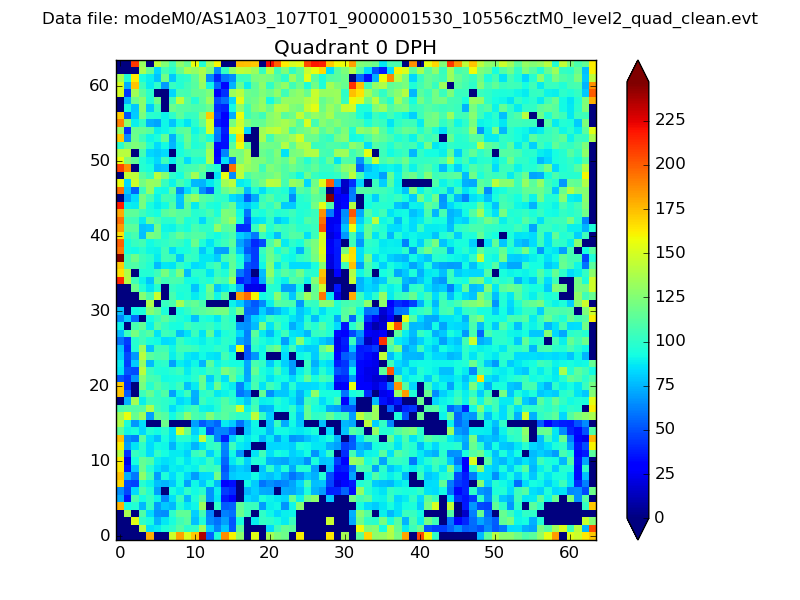 |
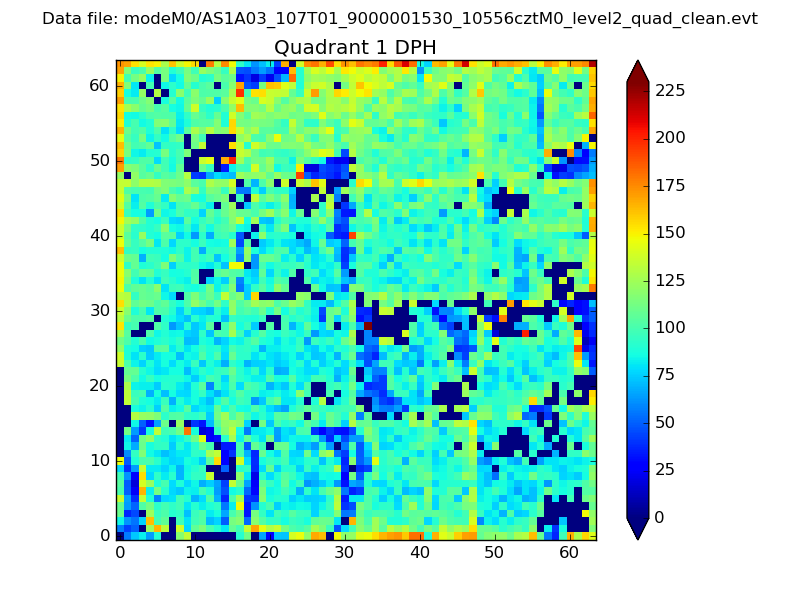 |
Quadrant B |
|---|---|---|---|
| Quadrant D | 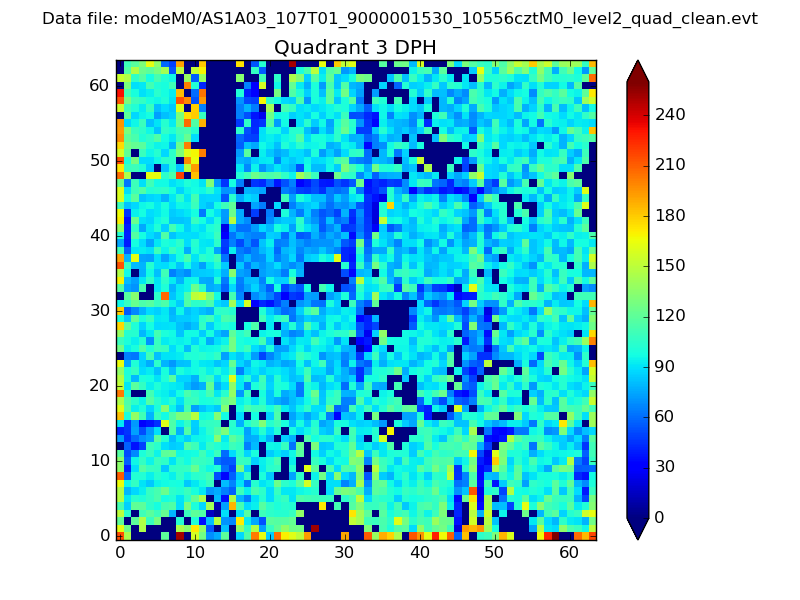 |
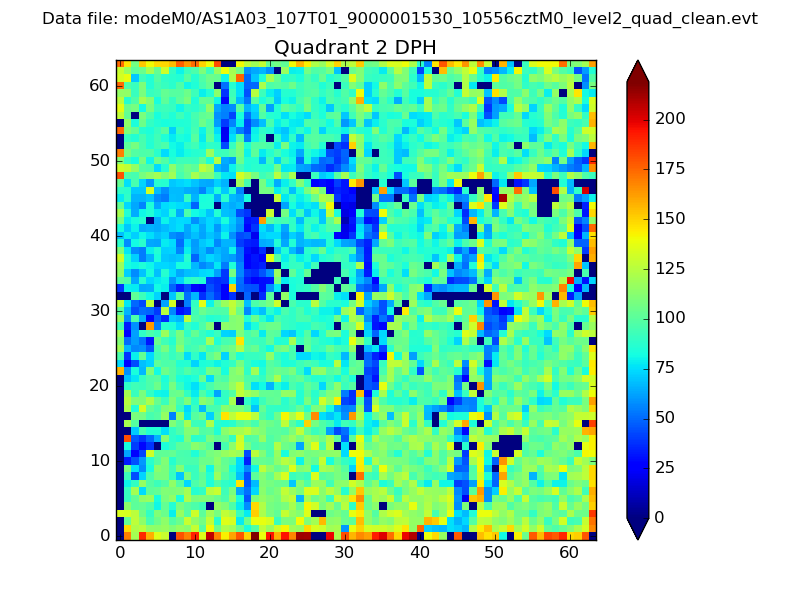 |
Quadrant C |
| Plot type | Count rate plots | Images |
|---|---|---|
| Comparison with Poisson distribution Blue bars denote a histogram of data divided into 1 sec bins. Red curve is a Poisson curve with rate = median count rate of data. |
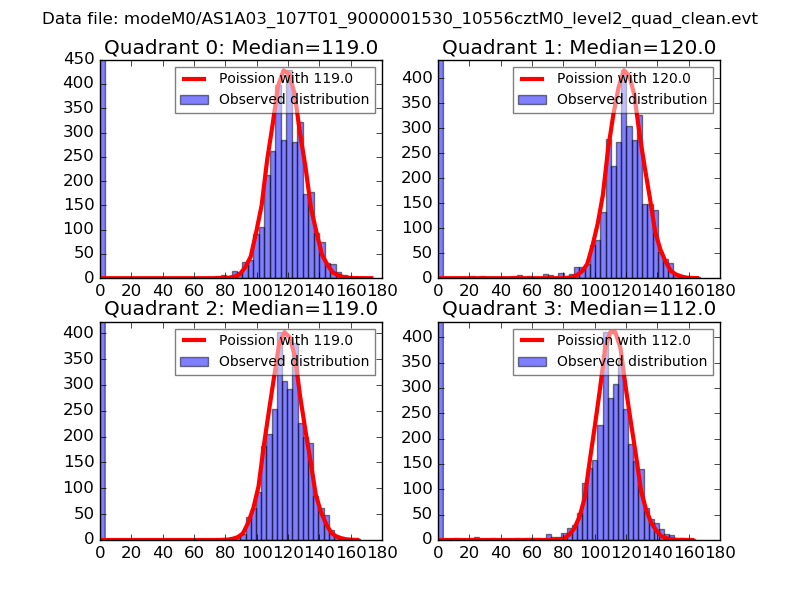 |
 |
| Quadrant-wise count rates Data is divided into 100 sec bins |
 |
|
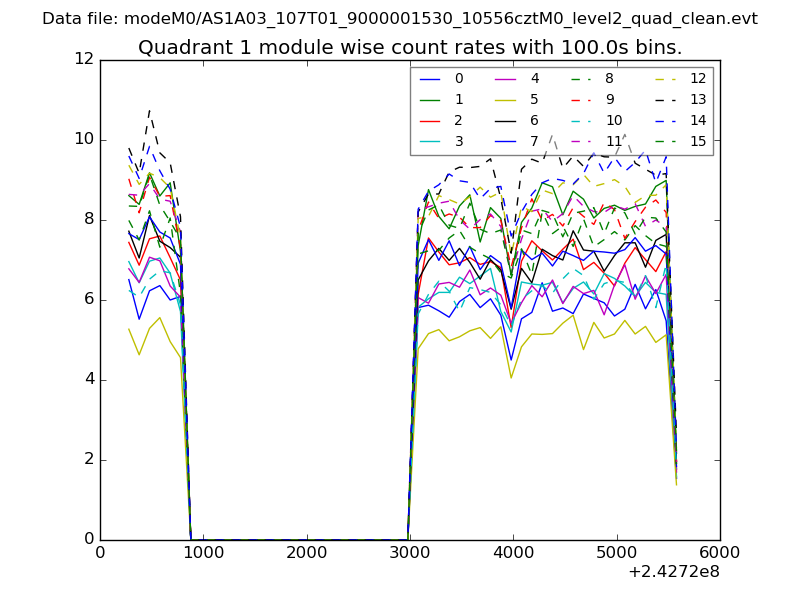
| Module-wise count rates for Quadrant A Data is divided into 100 sec bins |
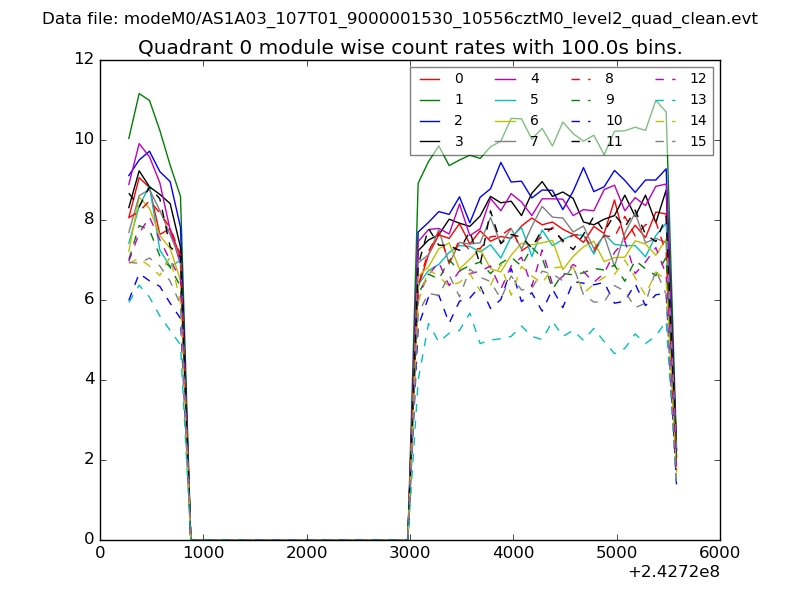 |
 |
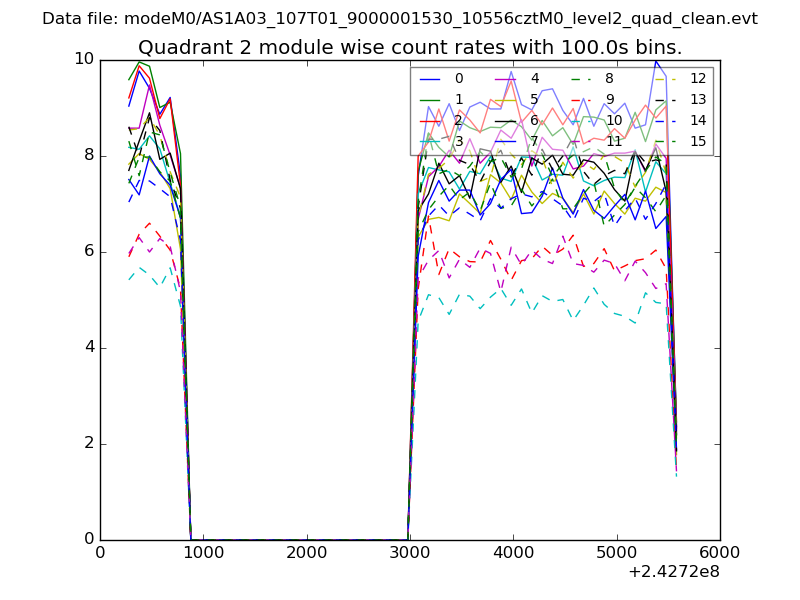
| Module-wise count rates for Quadrant B Data is divided into 100 sec bins |
 |
 |
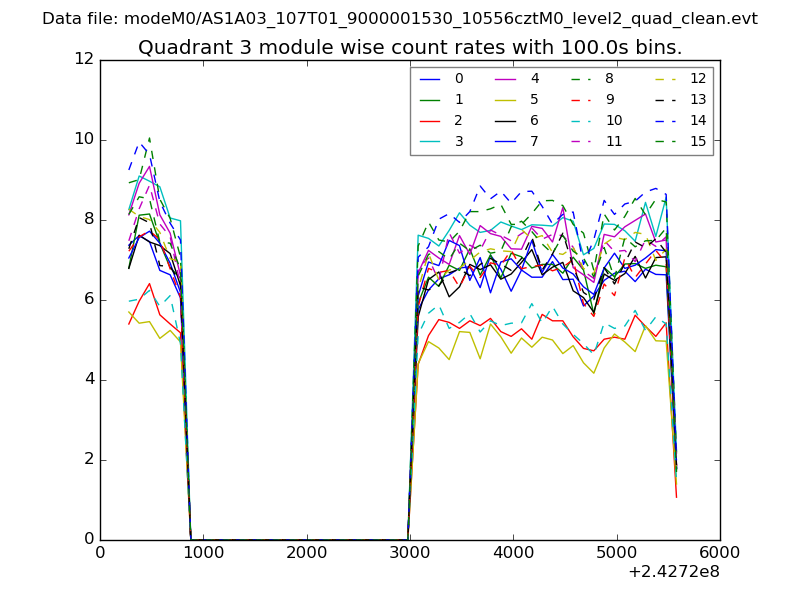
| Module-wise count rates for Quadrant C Data is divided into 100 sec bins |
 |
 |
| Module-wise count rates for Quadrant D Data is divided into 100 sec bins |
 |
 |
| Parameter | Plot |
|---|---|
| CZT HV Monitor | 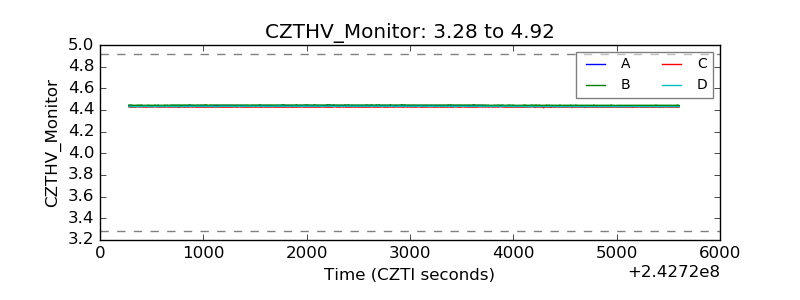 |
| D_VDD | 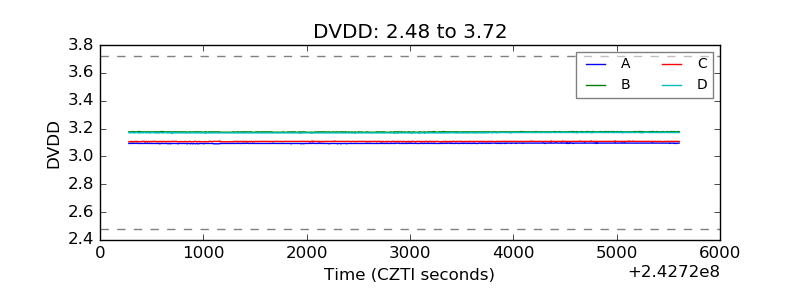 |
| Temperature 1 |  |
| Veto HV Monitor | 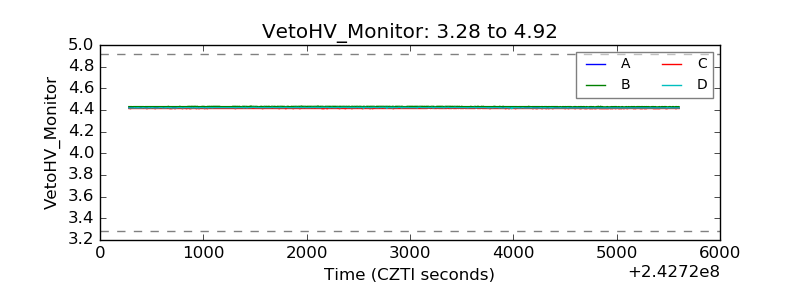 |
| Veto LLD | 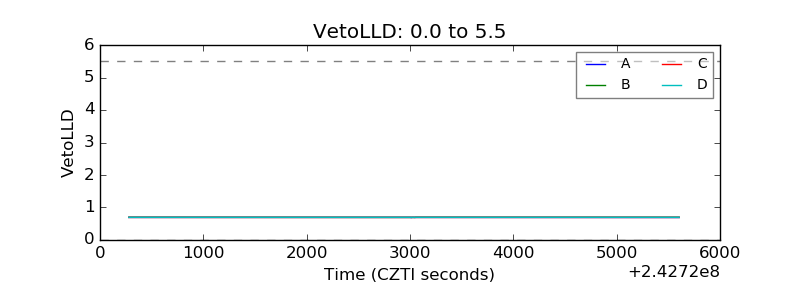 |
| Alpha Counter | 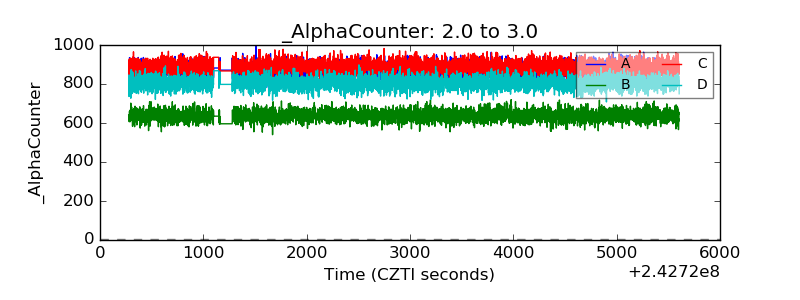 |
| _CPM_Rate | 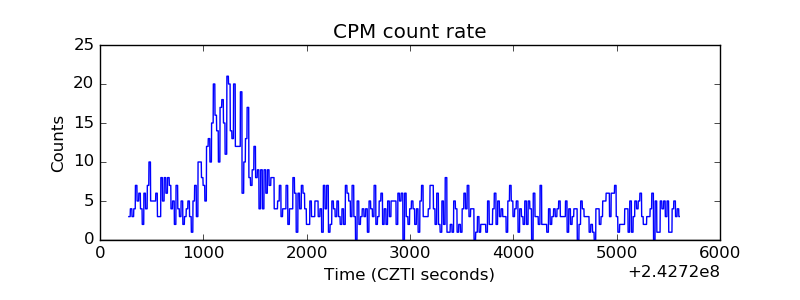 |
| CZT Counter | 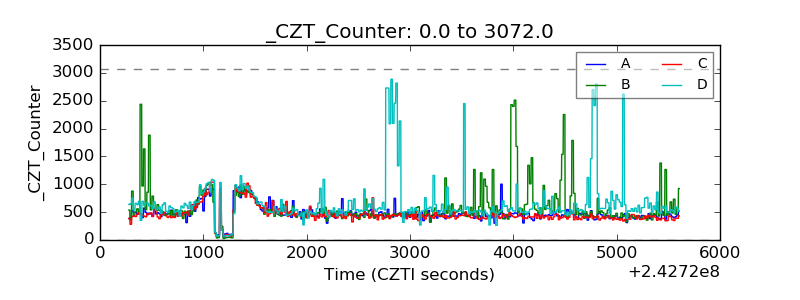 |
| +2.5 Volts monitor |  |
| +5 Volts monitor |  |
| _ROLL_ROT | 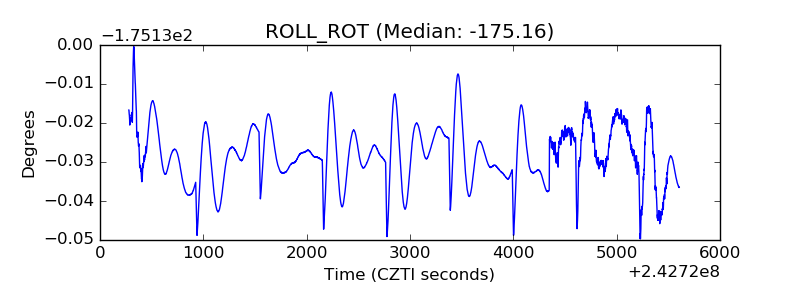 |
| _Roll_DEC | 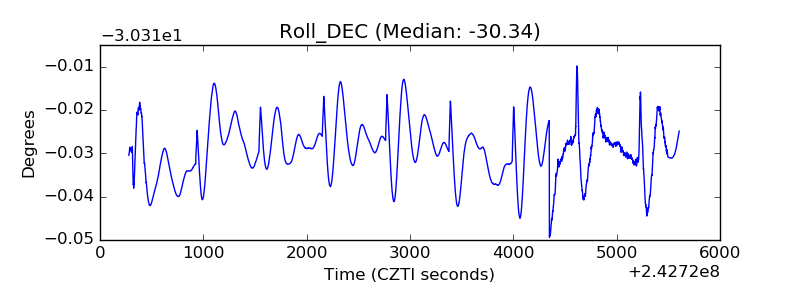 |
| _Roll_RA | 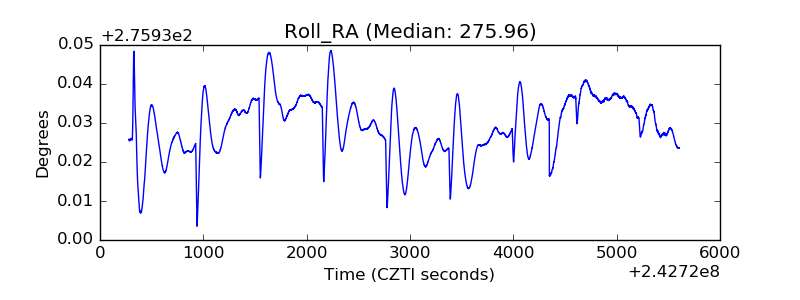 |
| Veto Counter | 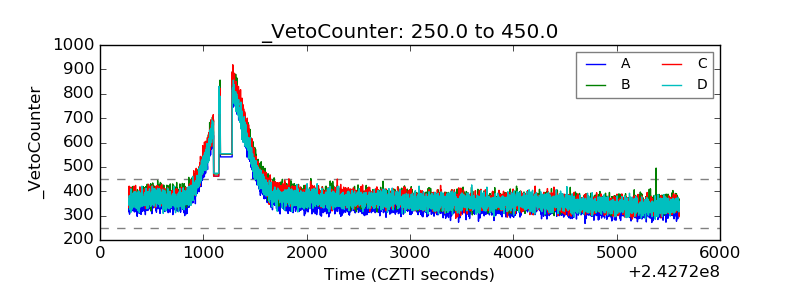 |