| Param | Original file | Final file |
|---|---|---|
| Filename | modeM0/AS1G07_079T01_9000001528cztM0_level2.fits | modeM0/AS1G07_079T01_9000001528cztM0_level2_quad_clean.evt |
| Size (bytes) | 135,720,000 | 139,608,000 |
| Size | 129.4 MB | 133.1 MB |
| Events in quadrant A | 795,682 | 815,792 |
| Events in quadrant B | 765,542 | 813,451 |
| Events in quadrant C | 807,052 | 806,826 |
| Events in quadrant D | 687,742 | 737,761 |
| Mode M9 | |||
|---|---|---|---|
| Quadrant | BADHDUFLAG | Total packets | Discarded packets |
| A | 0 | 16 | 0 |
| B | 0 | 16 | 0 |
| C | 0 | 16 | 0 |
| D | 0 | 16 | 0 |
| Mode M0 | |||
|---|---|---|---|
| Quadrant | BADHDUFLAG | Total packets | Discarded packets |
| A | 0 | 34646 | 0 |
| B | 0 | 39845 | 0 |
| C | 0 | 31185 | 0 |
| D | 0 | 37401 | 0 |
| Mode SS | |||
|---|---|---|---|
| Quadrant | BADHDUFLAG | Total packets | Discarded packets |
| A | 0 | 314 | 0 |
| B | 0 | 314 | 0 |
| C | 0 | 314 | 0 |
| D | 0 | 314 | 0 |
| Quadrant | Total seconds | Saturated seconds | Saturation percentage |
|---|---|---|---|
| A | 15259 | 427 | 2.798349% |
| B | 15259 | 992 | 6.501081% |
| C | 15259 | 241 | 1.579396% |
| D | 15259 | 309 | 2.025034% |
Noise dominated data is calculated using 1-second bins in cleaned event files. If a bin has >2000 counts, and if more than 50% of those come from <1% of pixels, then it is considered to be noise-dominated and hence unusable.
| Quadrant | # 1 sec bins | Bins with >0 counts | Bins with >2000 counts | High rate bins dominated by noise | Noise dominated (total time) | Noise dominated (detector-on time) | Marked lightcurve |
|---|---|---|---|---|---|---|---|
| A | 16934 | 15259 | 0 | 0 | 0.00% | 0.00% | 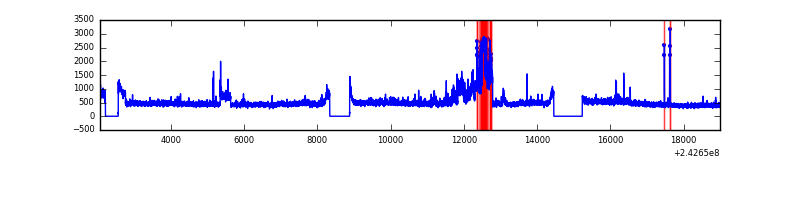 |
| B | 16933 | 15255 | 0 | 0 | 0.00% | 0.00% |  |
| C | 16934 | 15259 | 0 | 0 | 0.00% | 0.00% |  |
| D | 16933 | 15258 | 0 | 0 | 0.00% | 0.00% |  |
Top three noisy pixels from each quadrant. If the there are fewer than three noisy pixels in the level2.evt file, extra rows are filled as -1
| Pixel properties | Quadrant properties | ||||||
|---|---|---|---|---|---|---|---|
| Quadrant | DetID | PixID | Counts | Sigma | Mean | Median | Sigma |
| A | 0 | 29 | 797 | 11.02 | 206 | 193 | 54.8 |
| A | 7 | 110 | 633 | 8.03 | 206 | 193 | 54.8 |
| A | 9 | 19 | 631 | 7.99 | 206 | 193 | 54.8 |
| B | 2 | 9 | 643 | 10.4 | 201 | 190 | 43.6 |
| B | 14 | 254 | 509 | 7.32 | 201 | 190 | 43.6 |
| B | 3 | 17 | 505 | 7.23 | 201 | 190 | 43.6 |
| C | 1 | 80 | 619 | 7.33 | 212 | 196 | 57.7 |
| C | 1 | 81 | 594 | 6.9 | 212 | 196 | 57.7 |
| C | 12 | 241 | 587 | 6.78 | 212 | 196 | 57.7 |
| D | 7 | 5 | 514 | 6.17 | 196 | 177 | 54.6 |
| D | 6 | 231 | 507 | 6.04 | 196 | 177 | 54.6 |
| D | 3 | 14 | 500 | 5.91 | 196 | 177 | 54.6 |
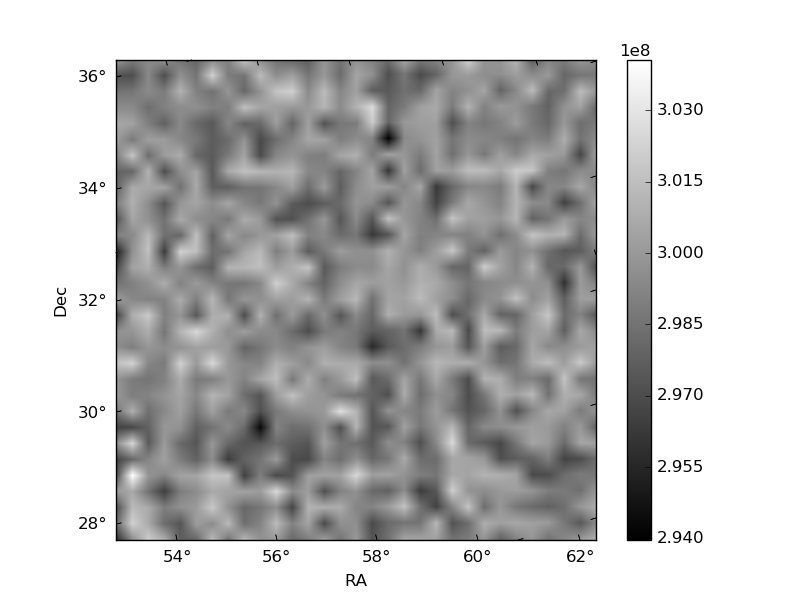
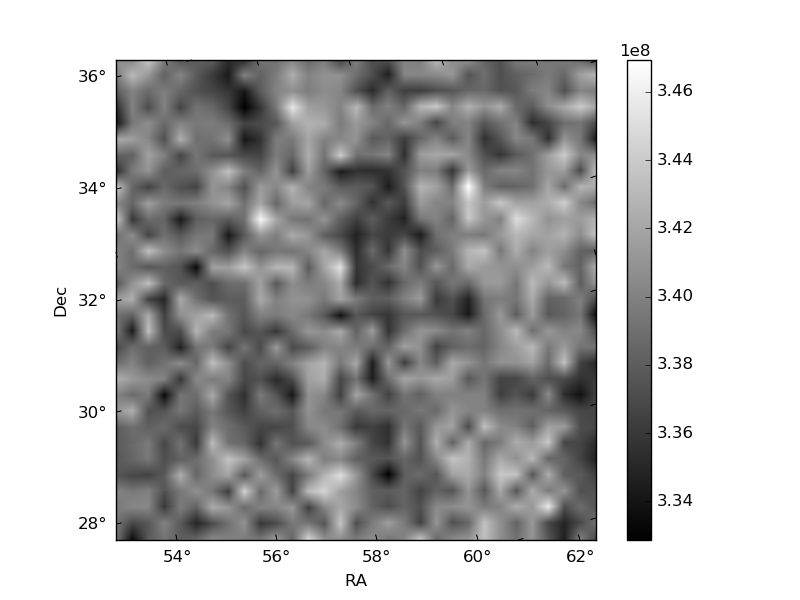
Histogram calculated using DETX and DETY for each event in the final _common_clean file
| Quadrant A |  |
 |
Quadrant B |
|---|---|---|---|
| Quadrant D | 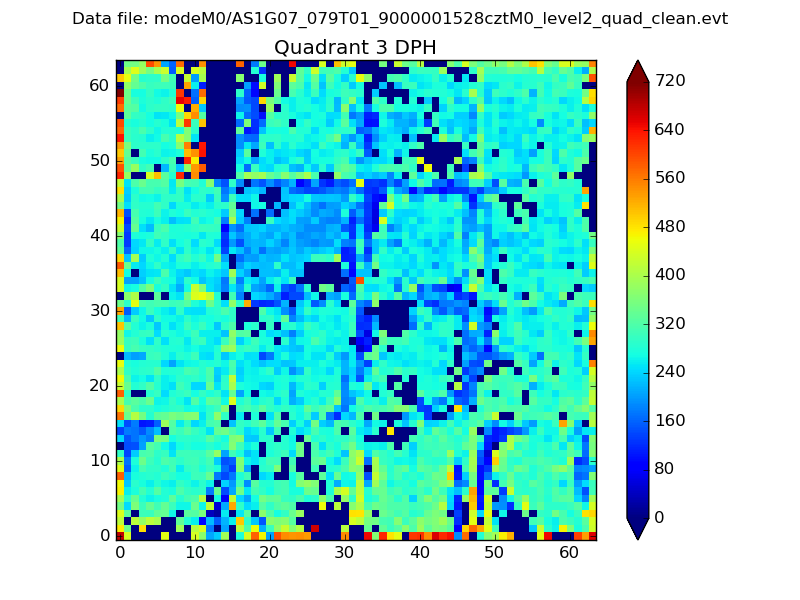 |
 |
Quadrant C |
| Plot type | Count rate plots | Images |
|---|---|---|
| Comparison with Poisson distribution Blue bars denote a histogram of data divided into 1 sec bins. Red curve is a Poisson curve with rate = median count rate of data. |
 |
 |
| Quadrant-wise count rates Data is divided into 100 sec bins |
 |
|
| Module-wise count rates for Quadrant A Data is divided into 100 sec bins |
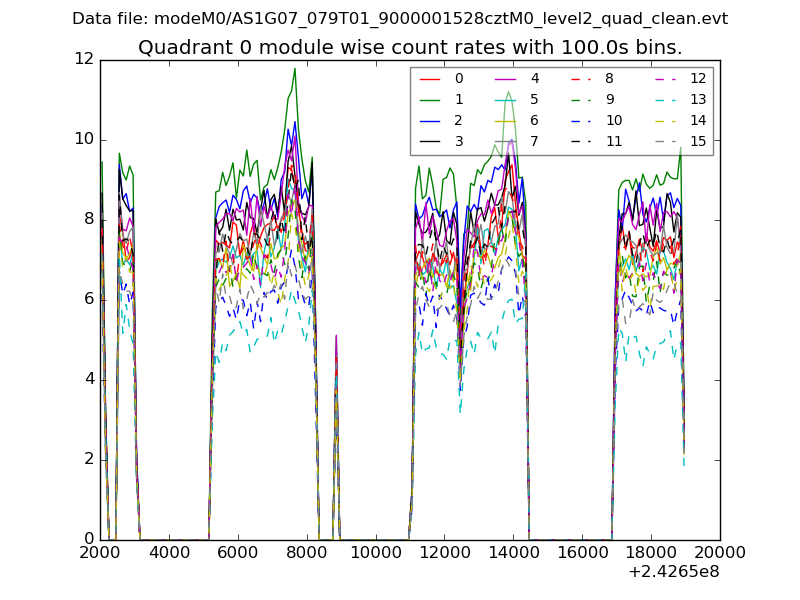 |
 |
| Module-wise count rates for Quadrant B Data is divided into 100 sec bins |
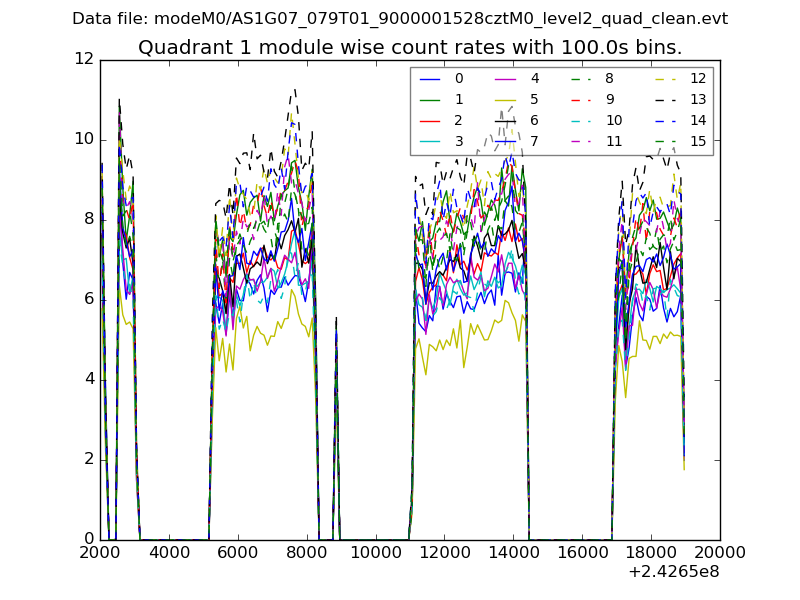 |
 |
| Module-wise count rates for Quadrant C Data is divided into 100 sec bins |
 |
 |
| Module-wise count rates for Quadrant D Data is divided into 100 sec bins |
 |
 |
| Parameter | Plot |
|---|---|
| CZT HV Monitor |  |
| D_VDD |  |
| Temperature 1 |  |
| Veto HV Monitor |  |
| Veto LLD |  |
| Alpha Counter |  |
| _CPM_Rate |  |
| CZT Counter | 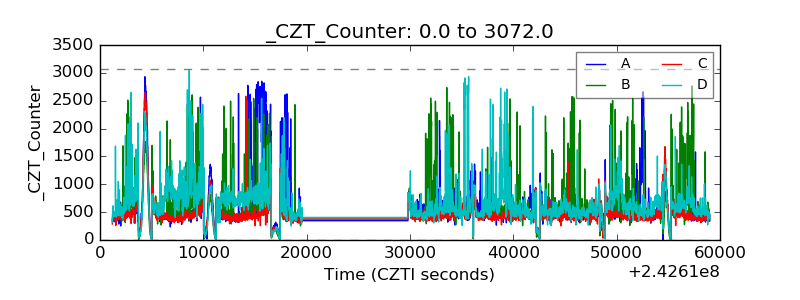 |
| +2.5 Volts monitor |  |
| +5 Volts monitor |  |
| _ROLL_ROT |  |
| _Roll_DEC |  |
| _Roll_RA |  |
| Veto Counter |  |