| Param | Original file | Final file |
|---|---|---|
| Filename | modeM0/AS1G07_079T01_9000001528_10537cztM0_level2.evt | modeM0/AS1G07_079T01_9000001528_10537cztM0_level2_quad_clean.evt |
| Size (bytes) | 297,668,160 | 48,055,680 |
| Size | 283.9 MB | 45.8 MB |
| Events in quadrant A | 1,820,000 | 294,380 |
| Events in quadrant B | 2,470,630 | 306,828 |
| Events in quadrant C | 1,779,739 | 303,997 |
| Events in quadrant D | 2,683,369 | 279,303 |
| Mode M9 | |||
|---|---|---|---|
| Quadrant | BADHDUFLAG | Total packets | Discarded packets |
| A | 0 | 13 | 0 |
| B | 0 | 13 | 0 |
| C | 0 | 13 | 0 |
| D | 0 | 13 | 0 |
| Mode M0 | |||
|---|---|---|---|
| Quadrant | BADHDUFLAG | Total packets | Discarded packets |
| A | 0 | 7955 | 2 |
| B | 0 | 9932 | 1 |
| C | 0 | 7898 | 1 |
| D | 0 | 10624 | 1 |
| Mode SS | |||
|---|---|---|---|
| Quadrant | BADHDUFLAG | Total packets | Discarded packets |
| A | 0 | 78 | 0 |
| B | 0 | 78 | 0 |
| C | 0 | 78 | 0 |
| D | 0 | 78 | 0 |
| Quadrant | Total seconds | Saturated seconds | Saturation percentage |
|---|---|---|---|
| A | 3827 | 14 | 0.365822% |
| B | 3827 | 152 | 3.971779% |
| C | 3827 | 15 | 0.391952% |
| D | 3827 | 148 | 3.867259% |
Noise dominated data is calculated using 1-second bins in cleaned event files. If a bin has >2000 counts, and if more than 50% of those come from <1% of pixels, then it is considered to be noise-dominated and hence unusable.
| Quadrant | # 1 sec bins | Bins with >0 counts | Bins with >2000 counts | High rate bins dominated by noise | Noise dominated (total time) | Noise dominated (detector-on time) | Marked lightcurve |
|---|---|---|---|---|---|---|---|
| A | 5122 | 3828 | 0 | 0 | 0.00% | 0.00% | 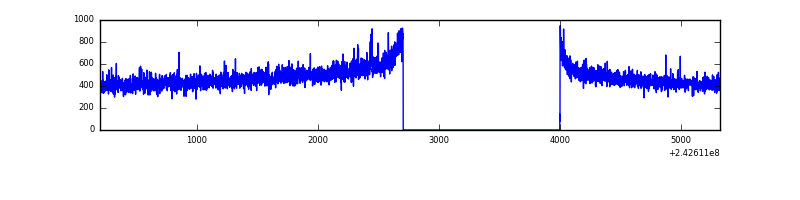 |
| B | 5122 | 3828 | 71 | 71 | 1.39% | 1.85% | 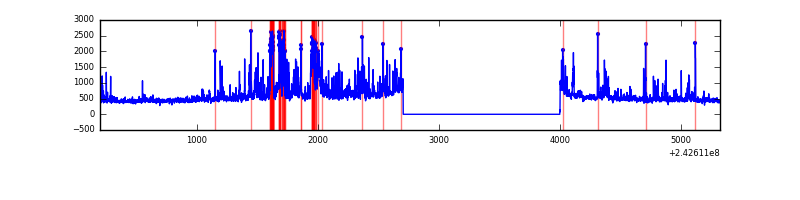 |
| C | 5122 | 3828 | 0 | 0 | 0.00% | 0.00% | 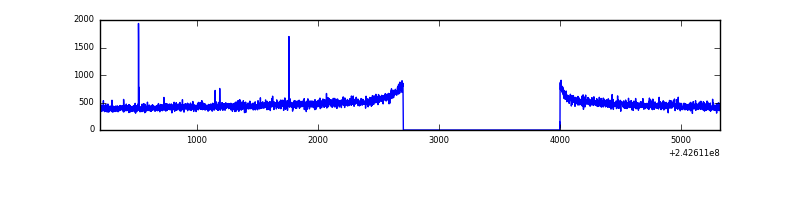 |
| D | 5122 | 3828 | 92 | 92 | 1.80% | 2.40% | 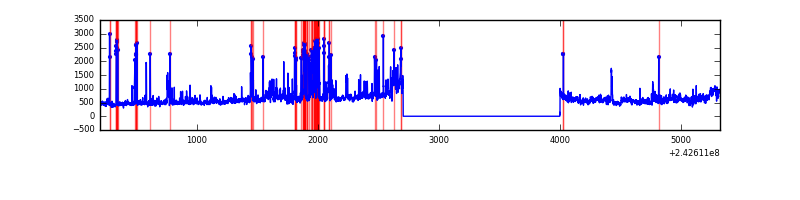 |
Top three noisy pixels from each quadrant. If the there are fewer than three noisy pixels in the level2.evt file, extra rows are filled as -1
| Pixel properties | Quadrant properties | ||||||
|---|---|---|---|---|---|---|---|
| Quadrant | DetID | PixID | Counts | Sigma | Mean | Median | Sigma |
| A | 1 | 162 | 10369 | 103.5 | 463 | 453 | 95.8 |
| A | 13 | 251 | 9370 | 93.08 | 463 | 453 | 95.8 |
| A | 8 | 5 | 8233 | 81.21 | 463 | 453 | 95.8 |
| B | 4 | 239 | 482443 | 5440.8 | 465 | 456 | 88.6 |
| B | 0 | 214 | 78225 | 877.88 | 465 | 456 | 88.6 |
| B | 11 | 51 | 74852 | 839.8 | 465 | 456 | 88.6 |
| C | 14 | 234 | 7753 | 68.43 | 454 | 455 | 106.7 |
| C | 13 | 61 | 3426 | 27.86 | 454 | 455 | 106.7 |
| C | 8 | 222 | 1863 | 13.2 | 454 | 455 | 106.7 |
| D | 1 | 52 | 311124 | 2911.52 | 442 | 429 | 106.7 |
| D | 1 | 20 | 282368 | 2642.04 | 442 | 429 | 106.7 |
| D | 8 | 195 | 218131 | 2040.08 | 442 | 429 | 106.7 |
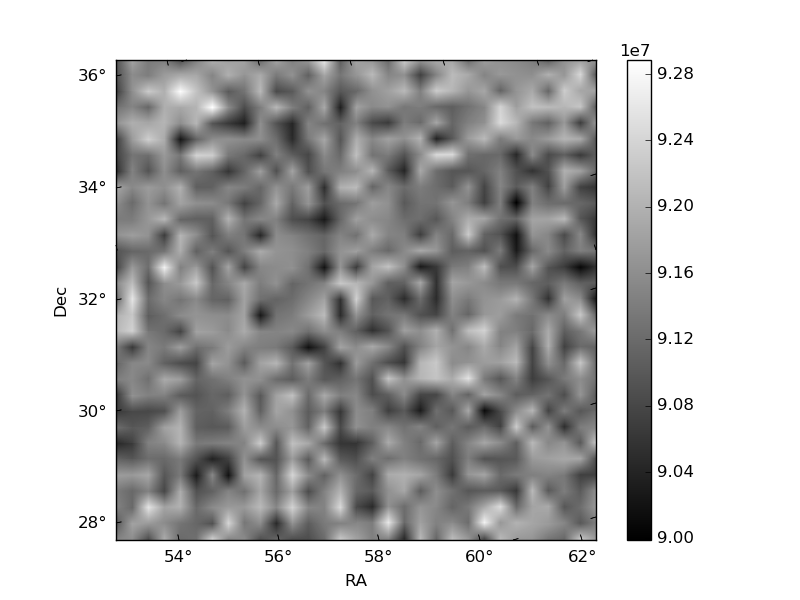
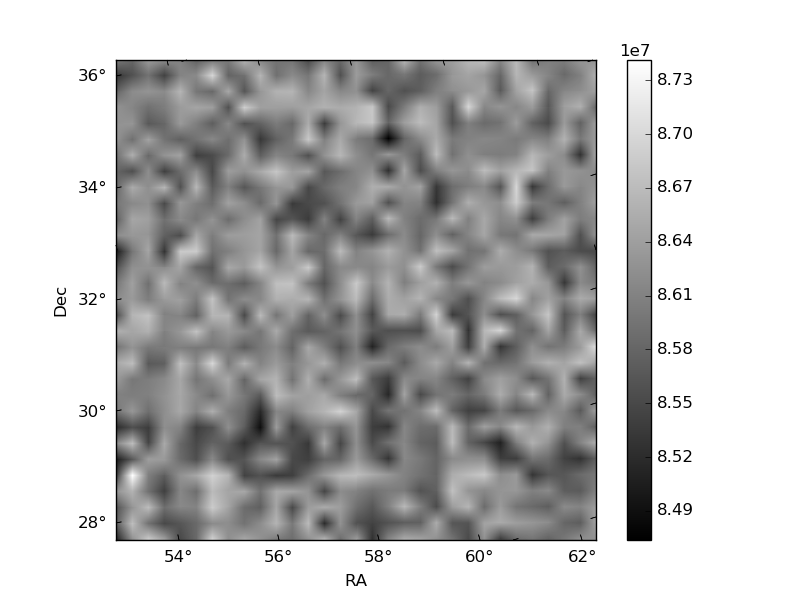
Histogram calculated using DETX and DETY for each event in the final _common_clean file
| Quadrant A | 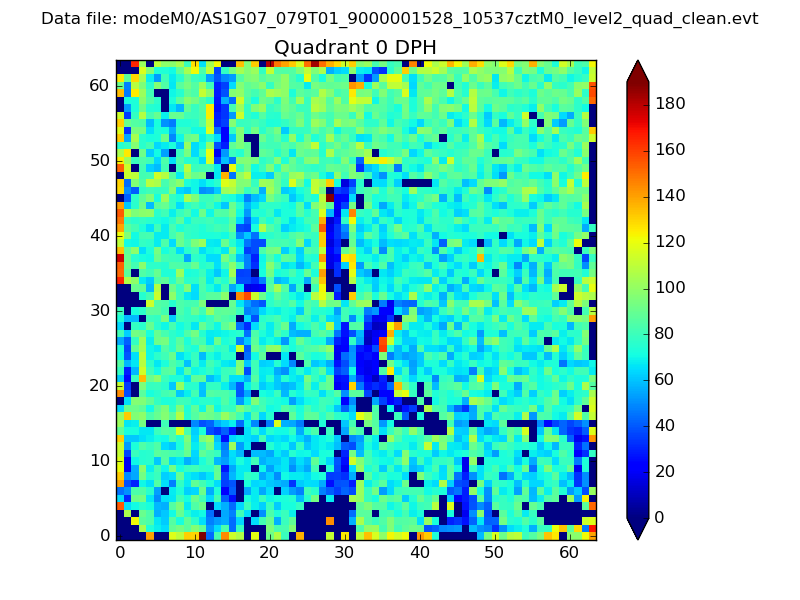 |
 |
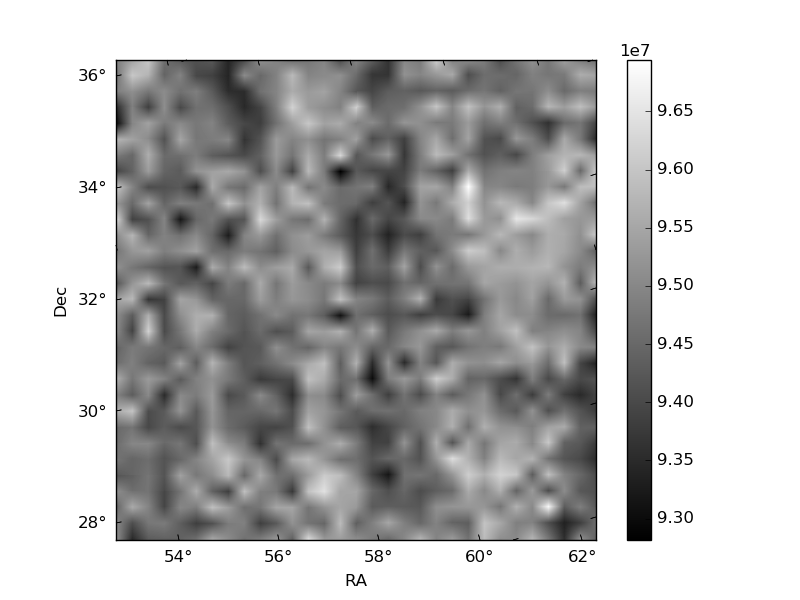
Quadrant B |
|---|---|---|---|
| Quadrant D |  |
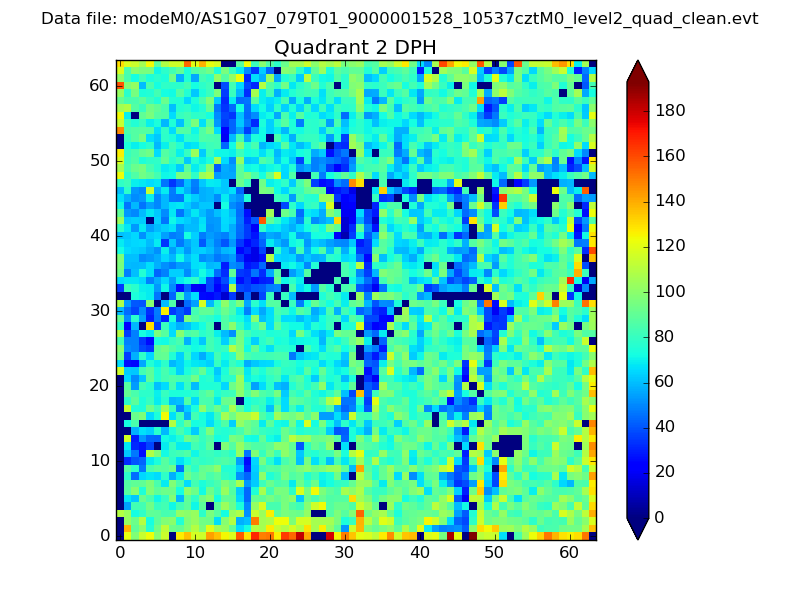 |
Quadrant C |
| Plot type | Count rate plots | Images |
|---|---|---|
| Comparison with Poisson distribution Blue bars denote a histogram of data divided into 1 sec bins. Red curve is a Poisson curve with rate = median count rate of data. |
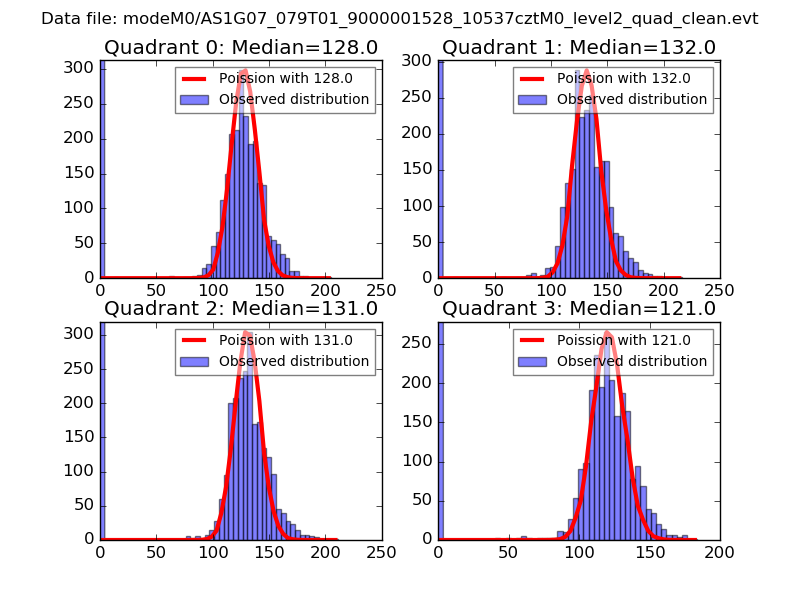 |
 |
| Quadrant-wise count rates Data is divided into 100 sec bins |
 |
|
| Module-wise count rates for Quadrant A Data is divided into 100 sec bins |
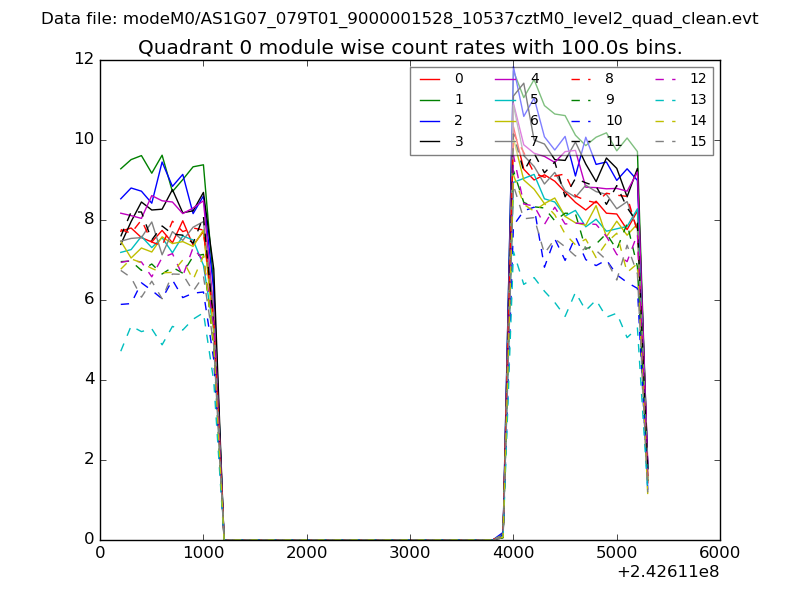 |
 |
| Module-wise count rates for Quadrant B Data is divided into 100 sec bins |
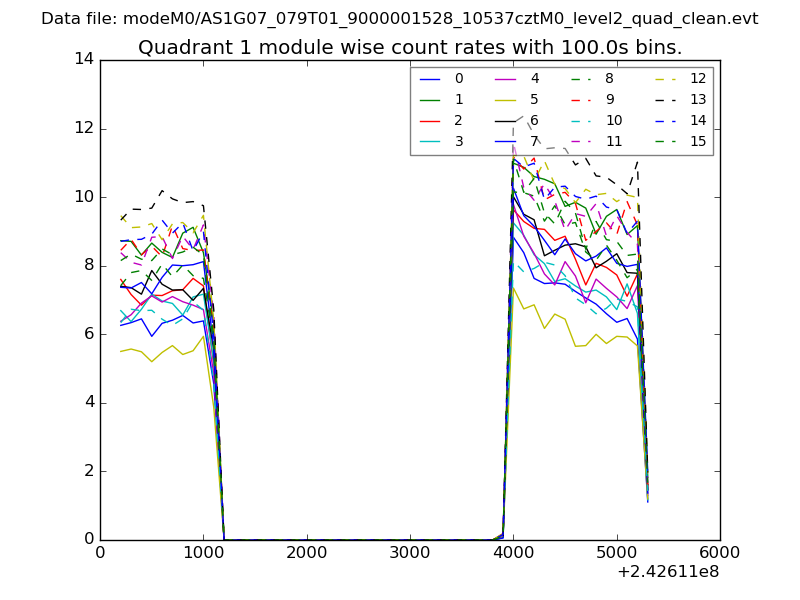 |
 |
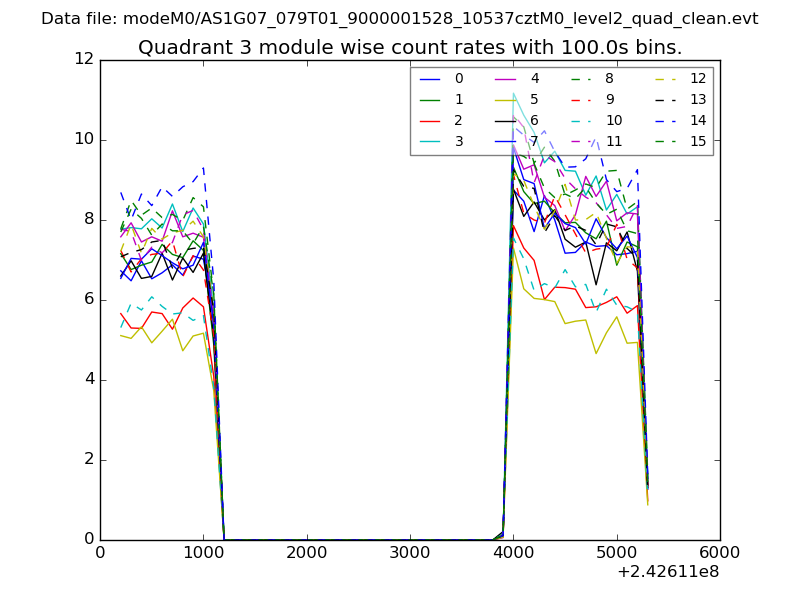
| Module-wise count rates for Quadrant C Data is divided into 100 sec bins |
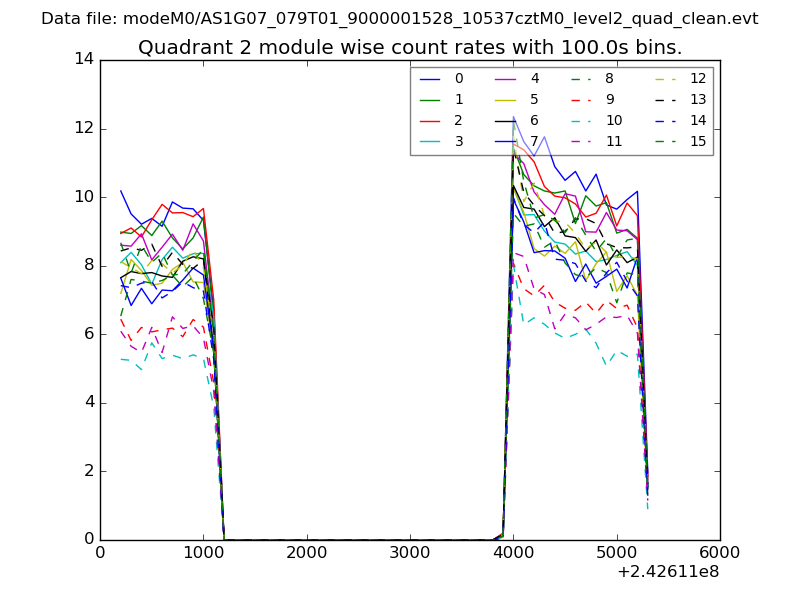 |
 |
| Module-wise count rates for Quadrant D Data is divided into 100 sec bins |
 |
 |
| Parameter | Plot |
|---|---|
| CZT HV Monitor |  |
| D_VDD | 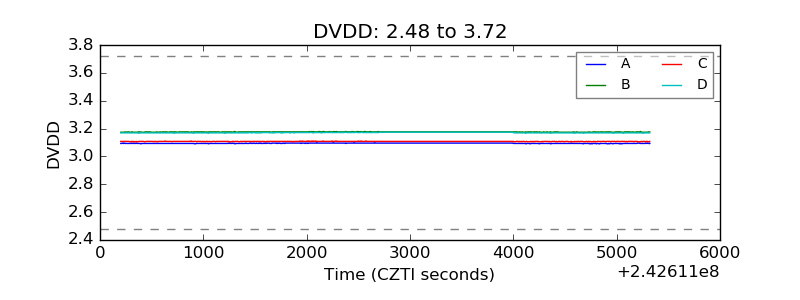 |
| Temperature 1 |  |
| Veto HV Monitor | 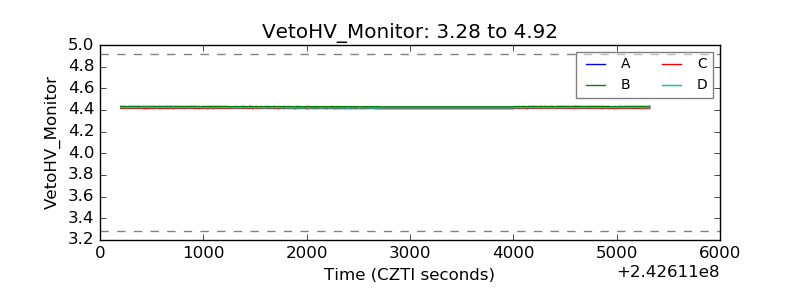 |
| Veto LLD | 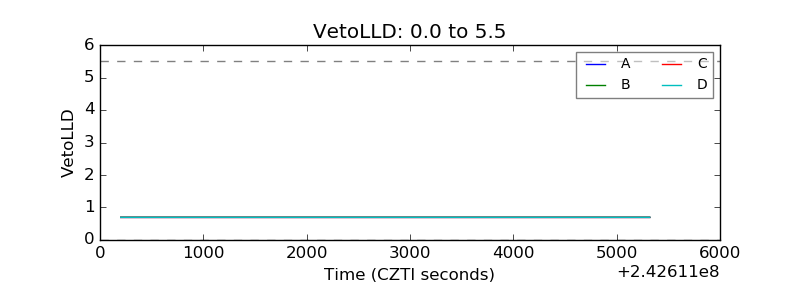 |
| Alpha Counter | 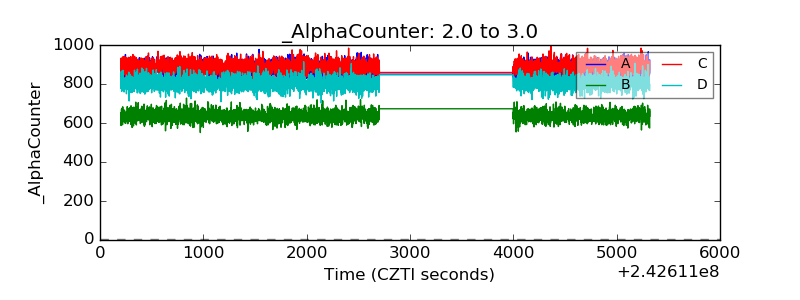 |
| _CPM_Rate | 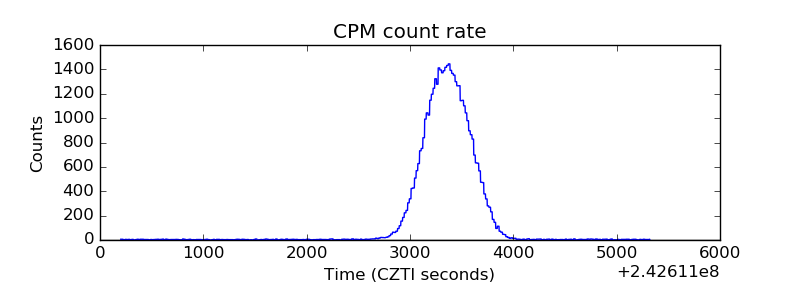 |
| CZT Counter | 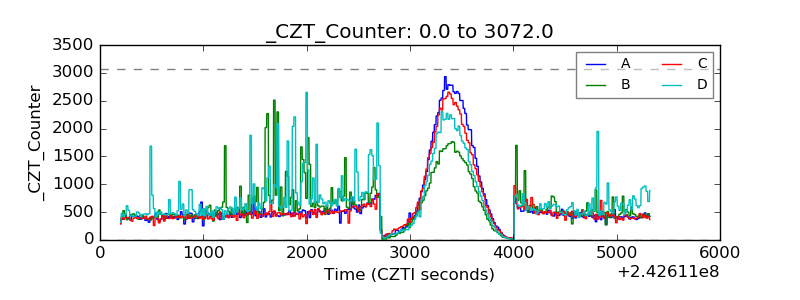 |
| +2.5 Volts monitor |  |
| +5 Volts monitor |  |
| _ROLL_ROT | 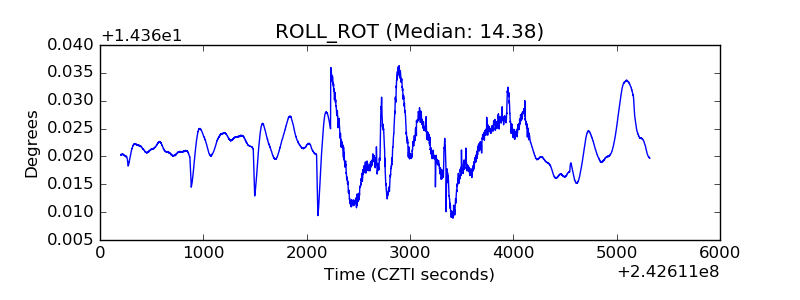 |
| _Roll_DEC | 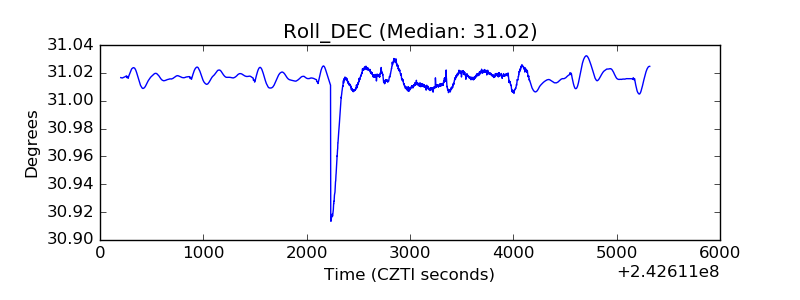 |
| _Roll_RA | 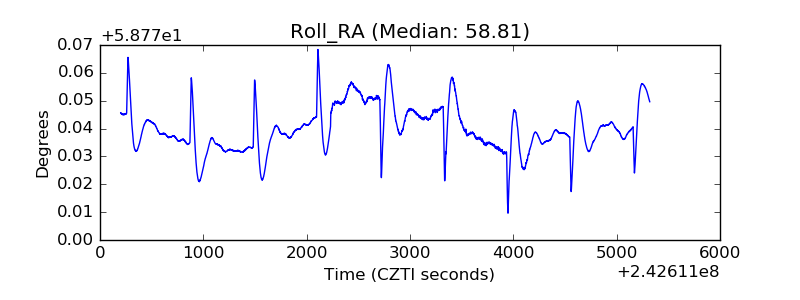 |
| Veto Counter | 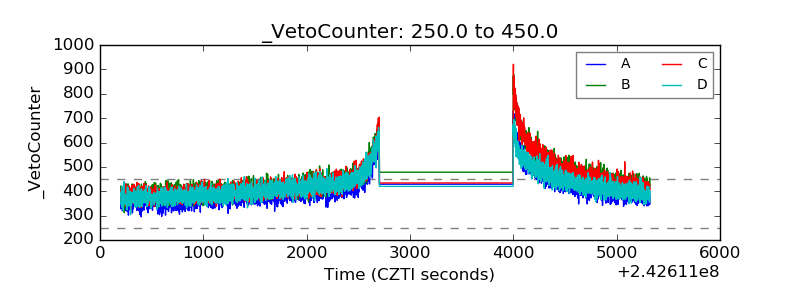 |