| Param | Original file | Final file |
|---|---|---|
| Filename | modeM0/AS1G07_079T01_9000001528_10538cztM0_level2.evt | modeM0/AS1G07_079T01_9000001528_10538cztM0_level2_quad_clean.evt |
| Size (bytes) | 525,168,000 | 86,826,240 |
| Size | 500.8 MB | 82.8 MB |
| Events in quadrant A | 2,903,485 | 546,065 |
| Events in quadrant B | 4,285,011 | 564,900 |
| Events in quadrant C | 2,858,739 | 561,738 |
| Events in quadrant D | 5,425,806 | 512,534 |
| Mode M9 | |||
|---|---|---|---|
| Quadrant | BADHDUFLAG | Total packets | Discarded packets |
| A | 0 | 19 | 0 |
| B | 0 | 19 | 0 |
| C | 0 | 19 | 0 |
| D | 0 | 20 | 0 |
| Mode M0 | |||
|---|---|---|---|
| Quadrant | BADHDUFLAG | Total packets | Discarded packets |
| A | 0 | 13141 | 3 |
| B | 0 | 17061 | 2 |
| C | 0 | 13060 | 2 |
| D | 0 | 20714 | 2 |
| Mode SS | |||
|---|---|---|---|
| Quadrant | BADHDUFLAG | Total packets | Discarded packets |
| A | 0 | 128 | 0 |
| B | 0 | 128 | 0 |
| C | 0 | 128 | 0 |
| D | 0 | 128 | 0 |
| Quadrant | Total seconds | Saturated seconds | Saturation percentage |
|---|---|---|---|
| A | 6370 | 23 | 0.361068% |
| B | 6370 | 390 | 6.122449% |
| C | 6370 | 13 | 0.204082% |
| D | 6370 | 220 | 3.453689% |
Noise dominated data is calculated using 1-second bins in cleaned event files. If a bin has >2000 counts, and if more than 50% of those come from <1% of pixels, then it is considered to be noise-dominated and hence unusable.
| Quadrant | # 1 sec bins | Bins with >0 counts | Bins with >2000 counts | High rate bins dominated by noise | Noise dominated (total time) | Noise dominated (detector-on time) | Marked lightcurve |
|---|---|---|---|---|---|---|---|
| A | 7585 | 6372 | 3 | 3 | 0.04% | 0.05% | 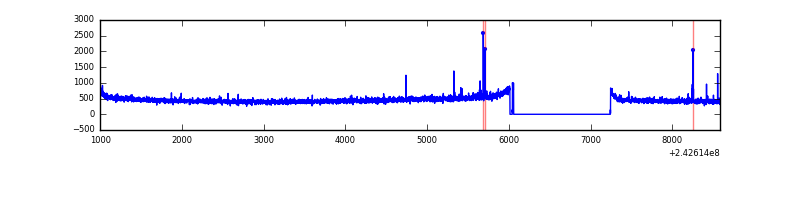 |
| B | 7585 | 6372 | 242 | 242 | 3.19% | 3.80% | 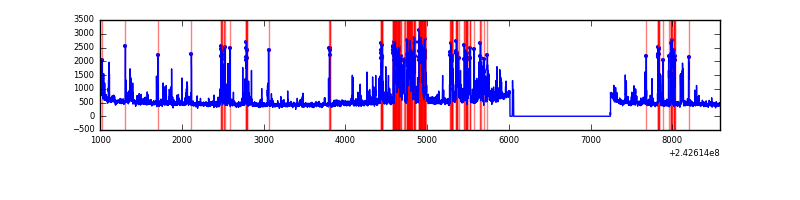 |
| C | 7585 | 6372 | 1 | 1 | 0.01% | 0.02% | 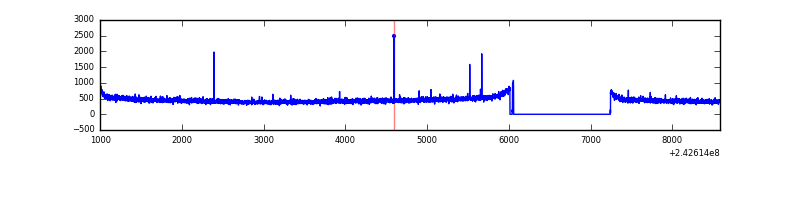 |
| D | 7585 | 6372 | 163 | 163 | 2.15% | 2.56% | 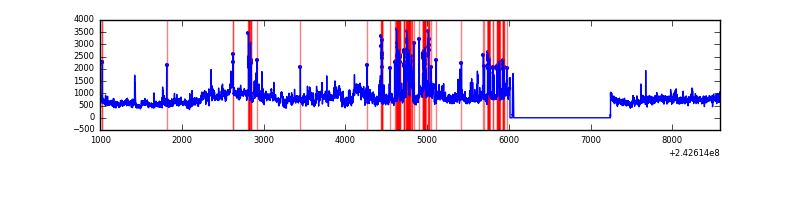 |
Top three noisy pixels from each quadrant. If the there are fewer than three noisy pixels in the level2.evt file, extra rows are filled as -1
| Pixel properties | Quadrant properties | ||||||
|---|---|---|---|---|---|---|---|
| Quadrant | DetID | PixID | Counts | Sigma | Mean | Median | Sigma |
| A | 15 | 239 | 22606 | 145.43 | 742 | 726 | 150.5 |
| A | 1 | 162 | 9896 | 60.95 | 742 | 726 | 150.5 |
| A | 0 | 226 | 6588 | 38.96 | 742 | 726 | 150.5 |
| B | 4 | 239 | 1205601 | 8646.22 | 742 | 724 | 139.4 |
| B | 0 | 214 | 88385 | 629.06 | 742 | 724 | 139.4 |
| B | 11 | 51 | 39278 | 276.66 | 742 | 724 | 139.4 |
| C | 14 | 234 | 9354 | 50.5 | 731 | 737 | 170.6 |
| C | 13 | 61 | 5516 | 28.01 | 731 | 737 | 170.6 |
| C | 3 | 202 | 1806 | 6.26 | 731 | 737 | 170.6 |
| D | 1 | 20 | 1338568 | 7963.83 | 704 | 683 | 168.0 |
| D | 1 | 52 | 784933 | 4668.29 | 704 | 683 | 168.0 |
| D | 8 | 195 | 269624 | 1600.88 | 704 | 683 | 168.0 |
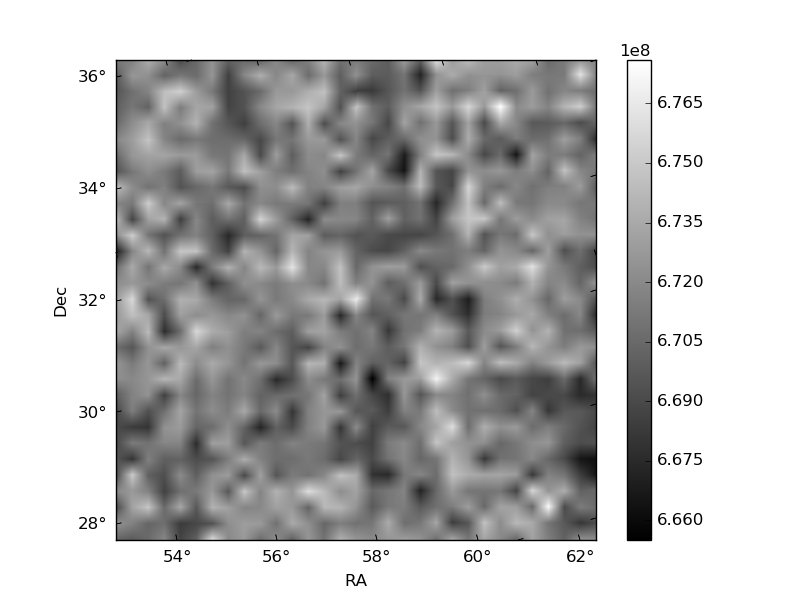
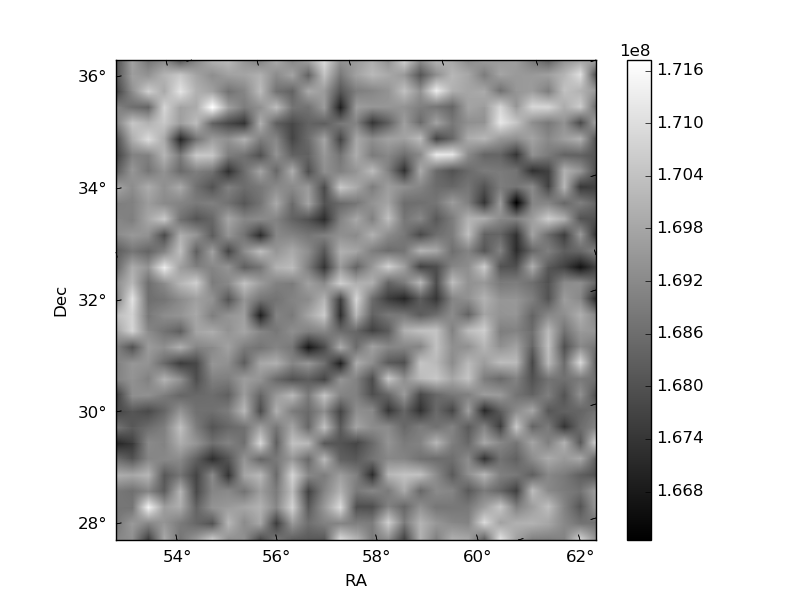
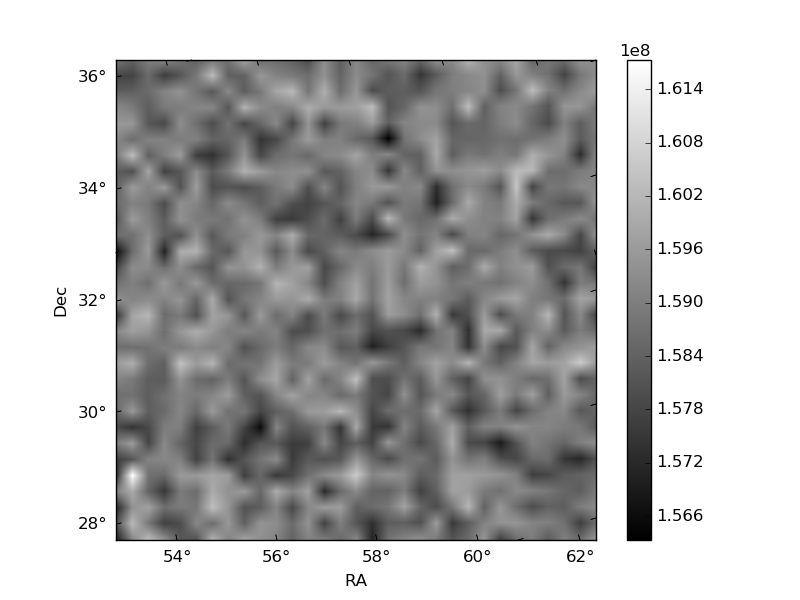
Histogram calculated using DETX and DETY for each event in the final _common_clean file
| Quadrant A | 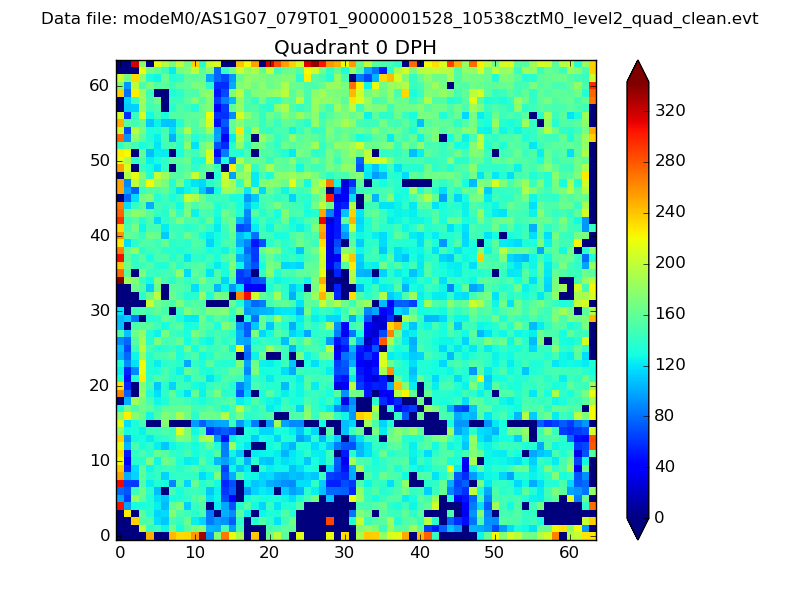 |
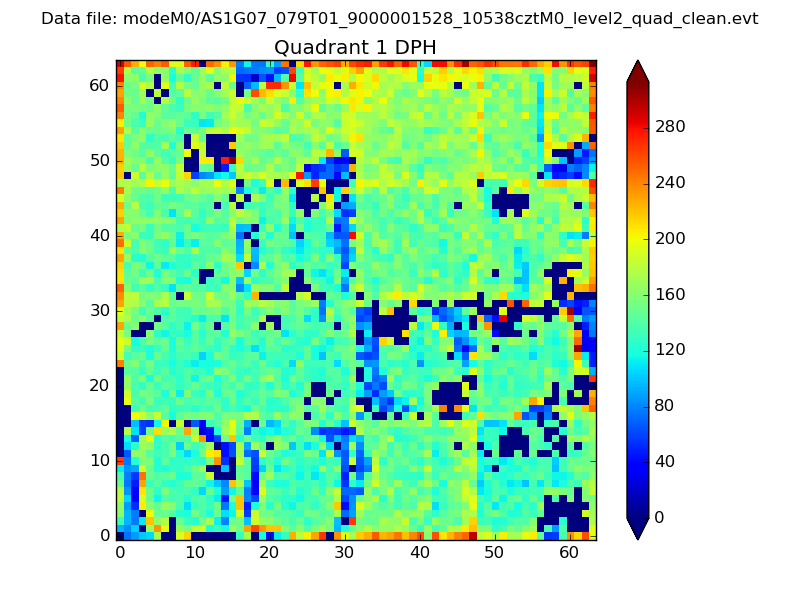 |
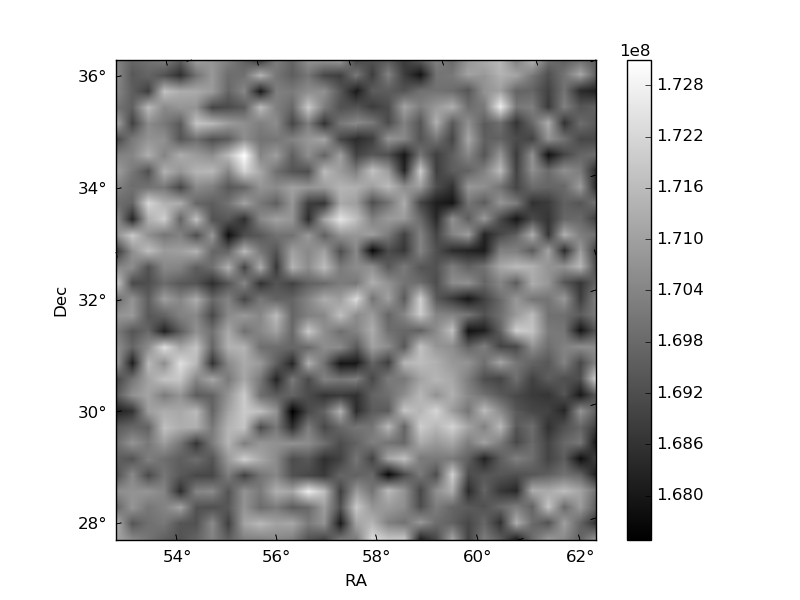
Quadrant B |
|---|---|---|---|
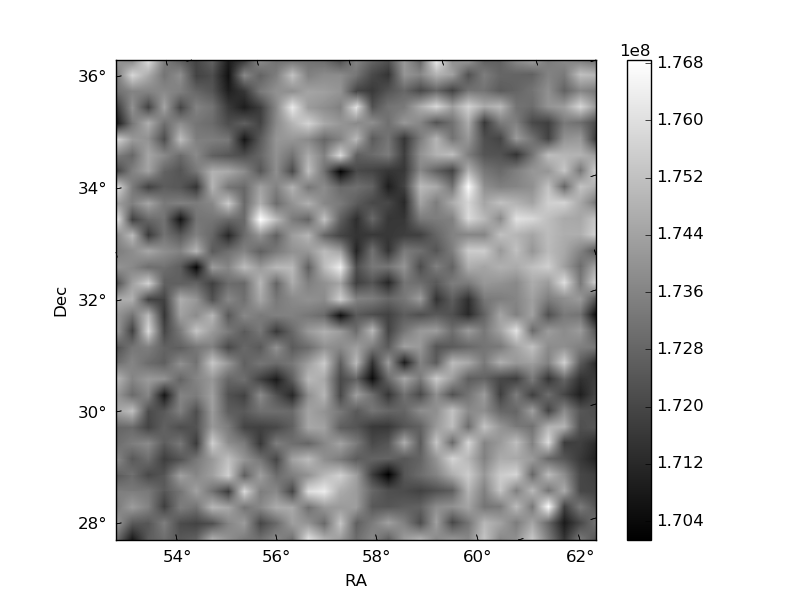
| Quadrant D | 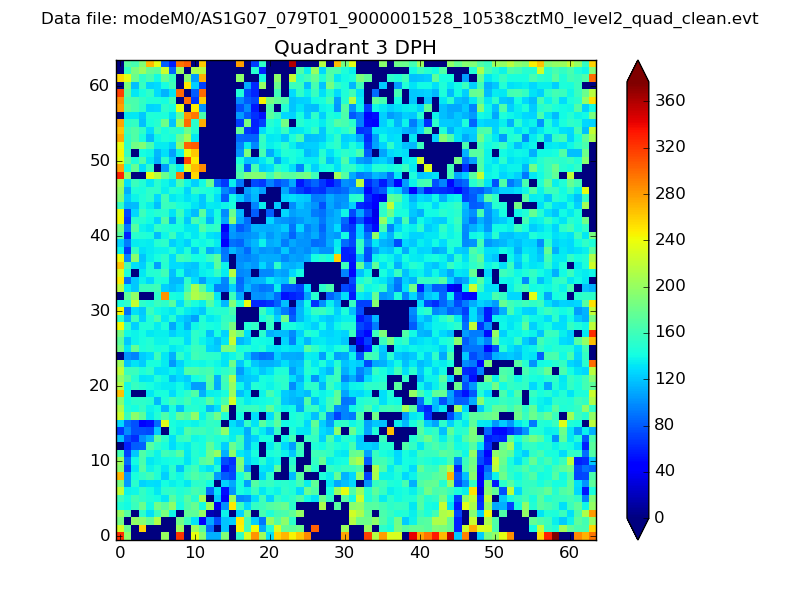 |
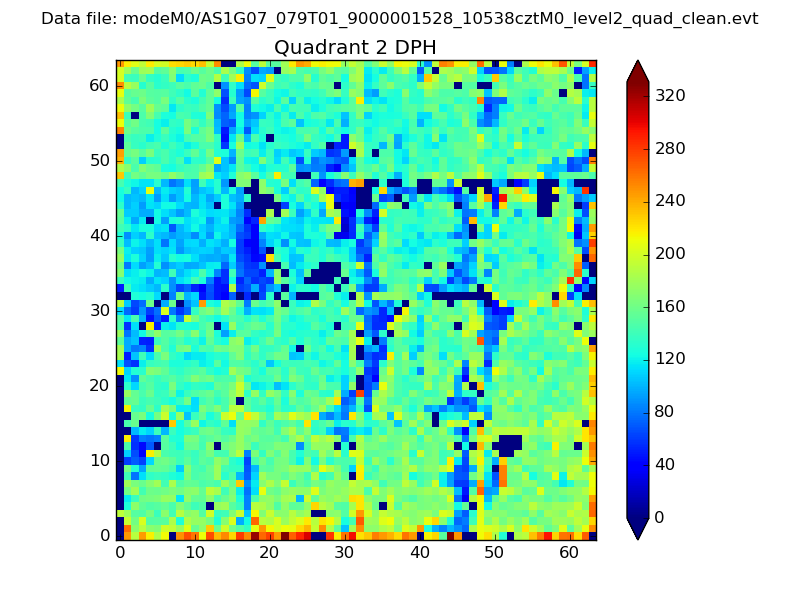 |
Quadrant C |
| Plot type | Count rate plots | Images |
|---|---|---|
| Comparison with Poisson distribution Blue bars denote a histogram of data divided into 1 sec bins. Red curve is a Poisson curve with rate = median count rate of data. |
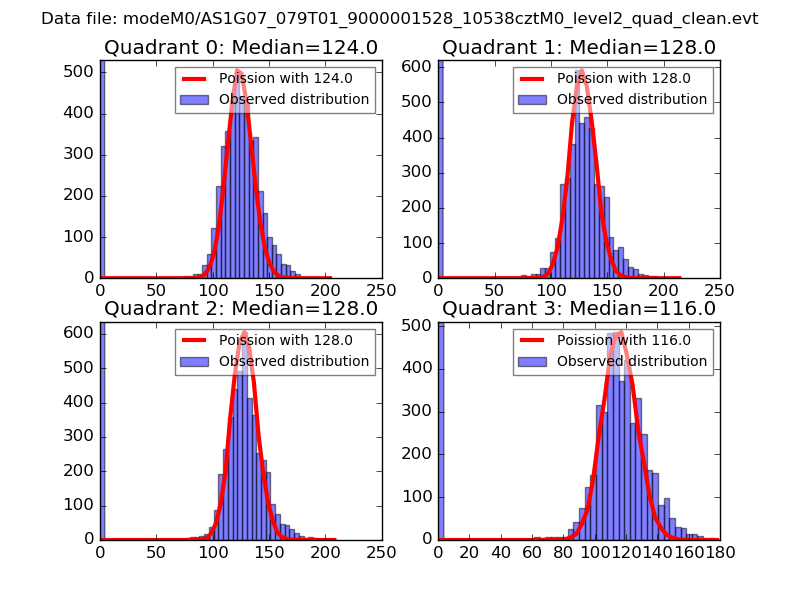 |
 |
| Quadrant-wise count rates Data is divided into 100 sec bins |
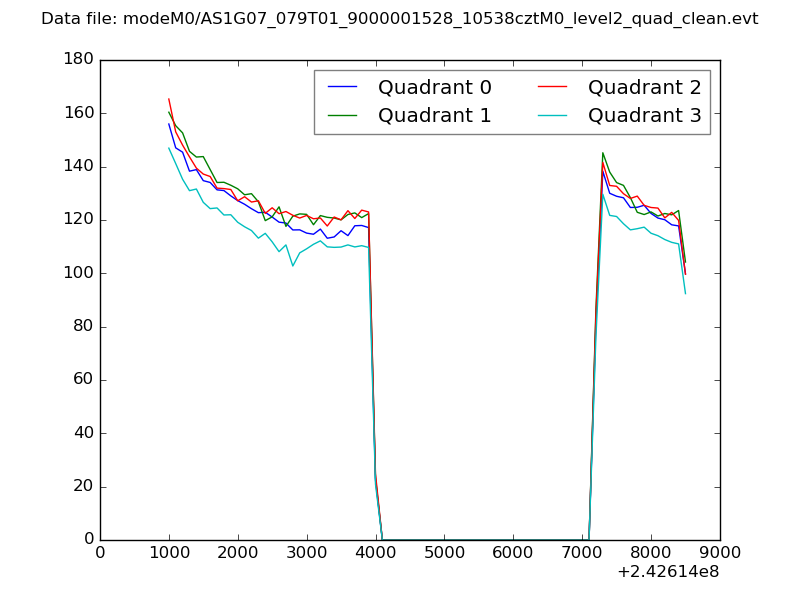 |
|
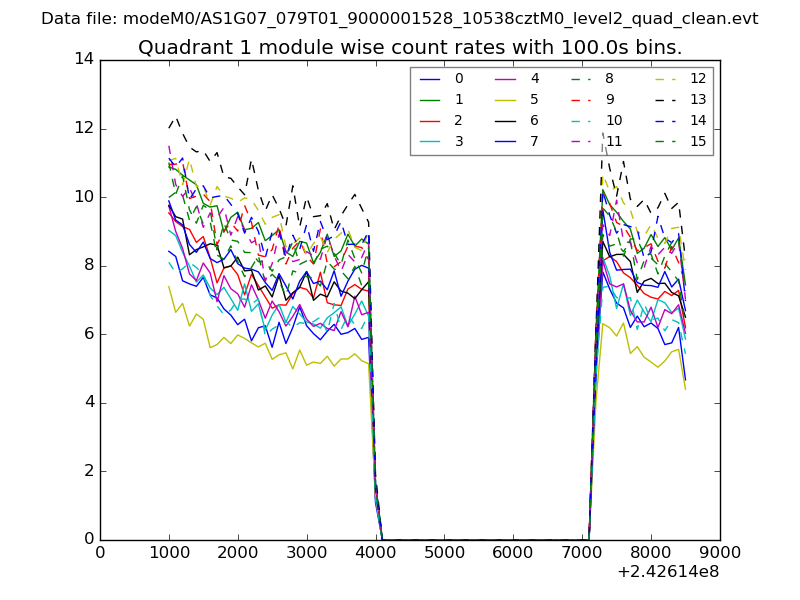
| Module-wise count rates for Quadrant A Data is divided into 100 sec bins |
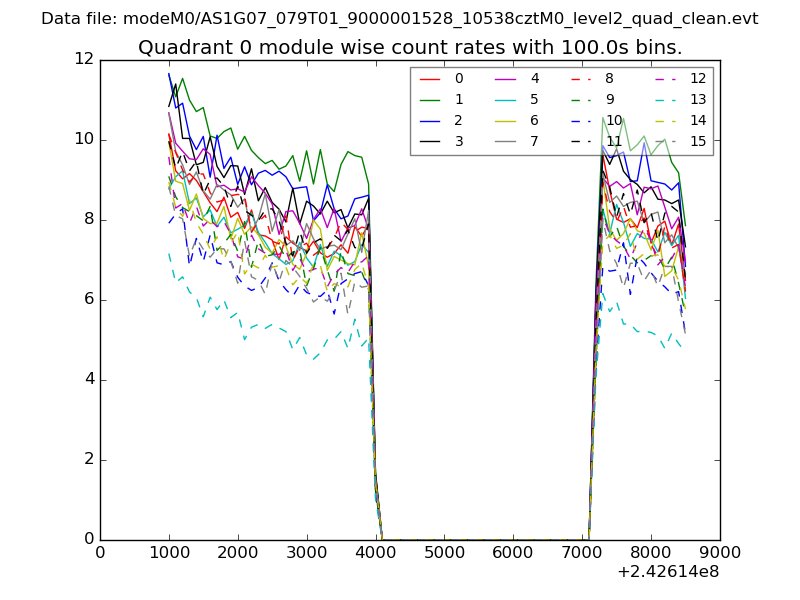 |
 |
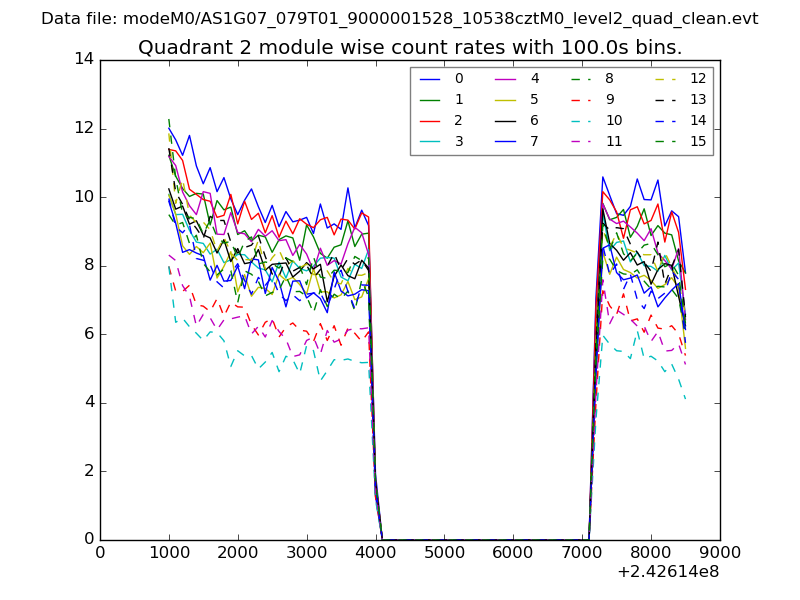
| Module-wise count rates for Quadrant B Data is divided into 100 sec bins |
 |
 |
| Module-wise count rates for Quadrant C Data is divided into 100 sec bins |
 |
 |
| Module-wise count rates for Quadrant D Data is divided into 100 sec bins |
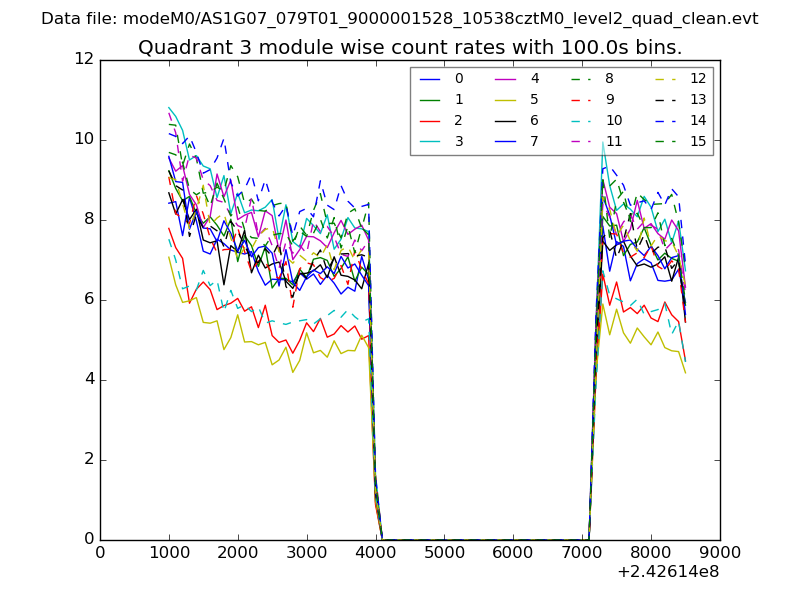 |
 |
| Parameter | Plot |
|---|---|
| CZT HV Monitor | 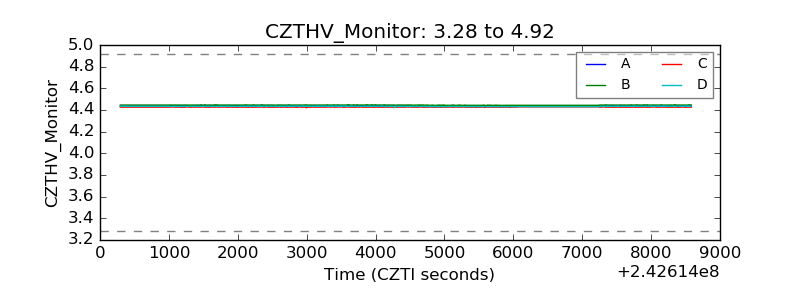 |
| D_VDD | 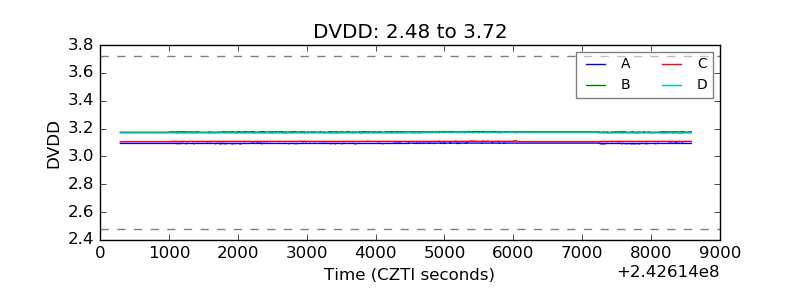 |
| Temperature 1 | 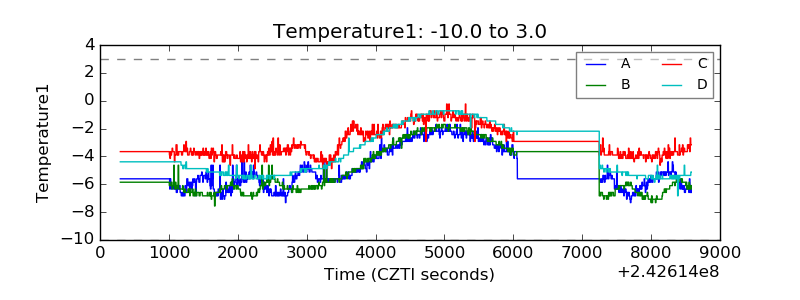 |
| Veto HV Monitor | 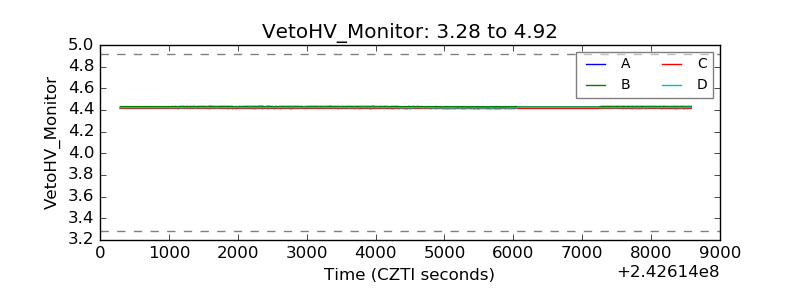 |
| Veto LLD | 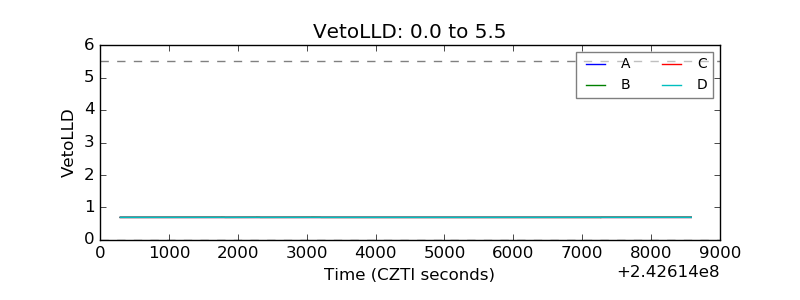 |
| Alpha Counter | 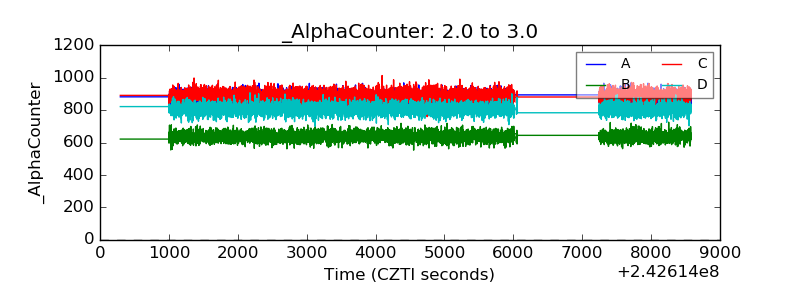 |
| _CPM_Rate | 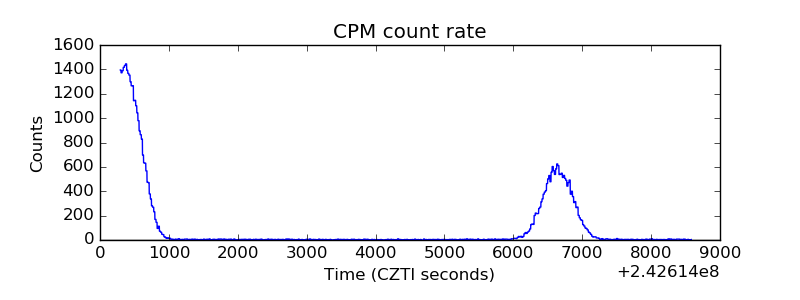 |
| CZT Counter | 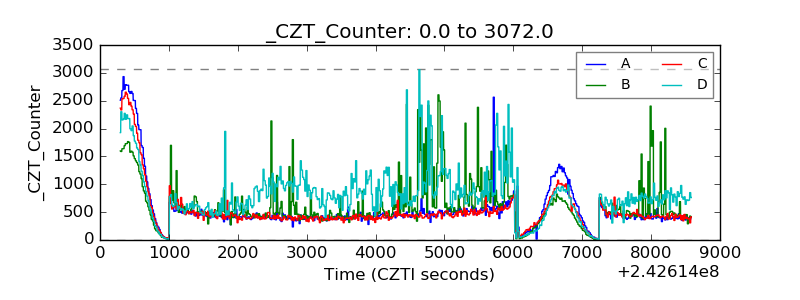 |
| +2.5 Volts monitor |  |
| +5 Volts monitor |  |
| _ROLL_ROT | 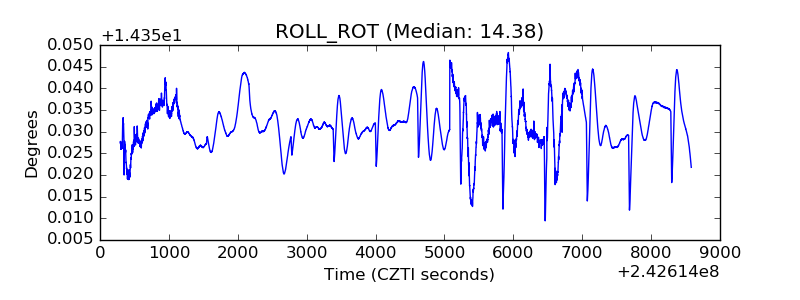 |
| _Roll_DEC | 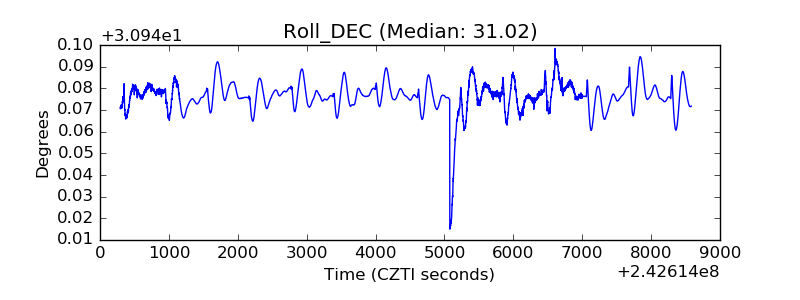 |
| _Roll_RA | 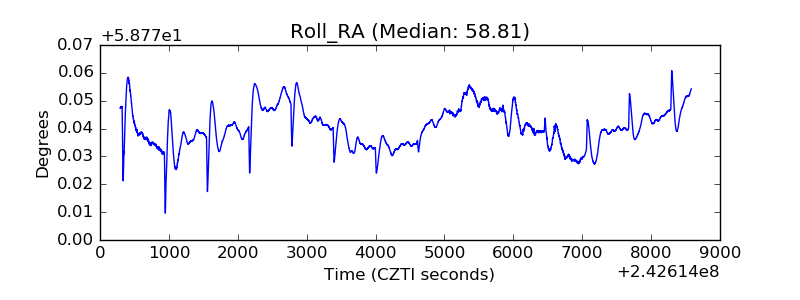 |
| Veto Counter | 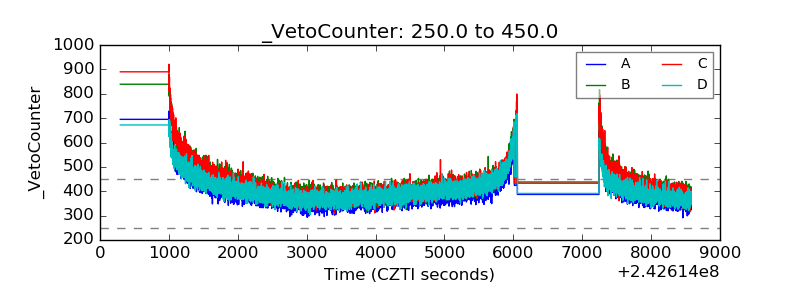 |