| Param | Original file | Final file |
|---|---|---|
| Filename | modeM0/AS1G07_079T01_9000001528_10539cztM0_level2.evt | modeM0/AS1G07_079T01_9000001528_10539cztM0_level2_quad_clean.evt |
| Size (bytes) | 658,866,240 | 95,201,280 |
| Size | 628.3 MB | 90.8 MB |
| Events in quadrant A | 6,620,802 | 580,153 |
| Events in quadrant B | 4,288,537 | 613,094 |
| Events in quadrant C | 3,228,052 | 616,965 |
| Events in quadrant D | 5,332,682 | 575,072 |
| Mode M9 | |||
|---|---|---|---|
| Quadrant | BADHDUFLAG | Total packets | Discarded packets |
| A | 0 | 21 | 0 |
| B | 0 | 21 | 0 |
| C | 0 | 21 | 0 |
| D | 0 | 21 | 0 |
| Mode M0 | |||
|---|---|---|---|
| Quadrant | BADHDUFLAG | Total packets | Discarded packets |
| A | 0 | 24901 | 3 |
| B | 0 | 17699 | 2 |
| C | 0 | 14854 | 2 |
| D | 0 | 21071 | 2 |
| Mode SS | |||
|---|---|---|---|
| Quadrant | BADHDUFLAG | Total packets | Discarded packets |
| A | 0 | 148 | 0 |
| B | 0 | 148 | 0 |
| C | 0 | 148 | 0 |
| D | 0 | 148 | 0 |
| Quadrant | Total seconds | Saturated seconds | Saturation percentage |
|---|---|---|---|
| A | 7139 | 1370 | 19.190363% |
| B | 7139 | 340 | 4.762572% |
| C | 7139 | 53 | 0.742401% |
| D | 7139 | 112 | 1.568847% |
Noise dominated data is calculated using 1-second bins in cleaned event files. If a bin has >2000 counts, and if more than 50% of those come from <1% of pixels, then it is considered to be noise-dominated and hence unusable.
| Quadrant | # 1 sec bins | Bins with >0 counts | Bins with >2000 counts | High rate bins dominated by noise | Noise dominated (total time) | Noise dominated (detector-on time) | Marked lightcurve |
|---|---|---|---|---|---|---|---|
| A | 9244 | 7142 | 1095 | 1095 | 11.85% | 15.33% | 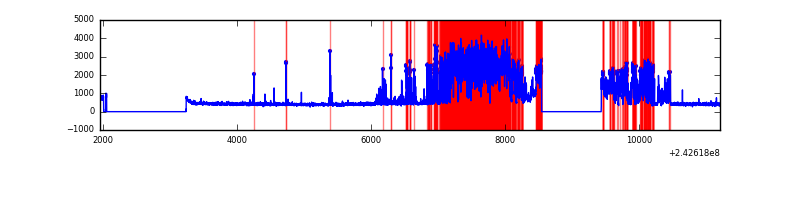 |
| B | 9244 | 7142 | 158 | 158 | 1.71% | 2.21% | 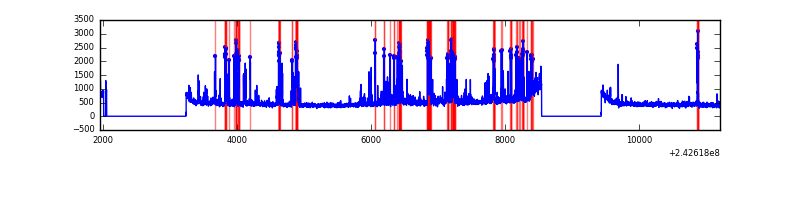 |
| C | 9244 | 7142 | 8 | 8 | 0.09% | 0.11% | 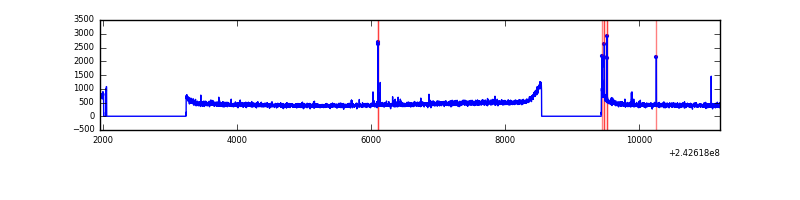 |
| D | 9244 | 7142 | 31 | 31 | 0.34% | 0.43% | 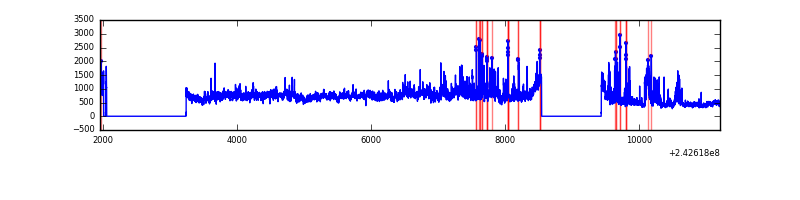 |
Top three noisy pixels from each quadrant. If the there are fewer than three noisy pixels in the level2.evt file, extra rows are filled as -1
| Pixel properties | Quadrant properties | ||||||
|---|---|---|---|---|---|---|---|
| Quadrant | DetID | PixID | Counts | Sigma | Mean | Median | Sigma |
| A | 15 | 239 | 3769395 | 25543.72 | 729 | 714 | 147.5 |
| A | 13 | 251 | 23877 | 157.0 | 729 | 714 | 147.5 |
| A | 1 | 162 | 9486 | 59.46 | 729 | 714 | 147.5 |
| B | 4 | 239 | 871728 | 5476.67 | 832 | 812 | 159.0 |
| B | 0 | 214 | 65318 | 405.64 | 832 | 812 | 159.0 |
| B | 11 | 51 | 59415 | 368.52 | 832 | 812 | 159.0 |
| C | 14 | 234 | 47094 | 244.08 | 814 | 819 | 189.6 |
| C | 13 | 61 | 6138 | 28.05 | 814 | 819 | 189.6 |
| C | 9 | 68 | 5827 | 26.41 | 814 | 819 | 189.6 |
| D | 1 | 20 | 1114593 | 5731.75 | 801 | 780 | 194.3 |
| D | 2 | 16 | 604755 | 3108.09 | 801 | 780 | 194.3 |
| D | 8 | 195 | 263207 | 1350.46 | 801 | 780 | 194.3 |
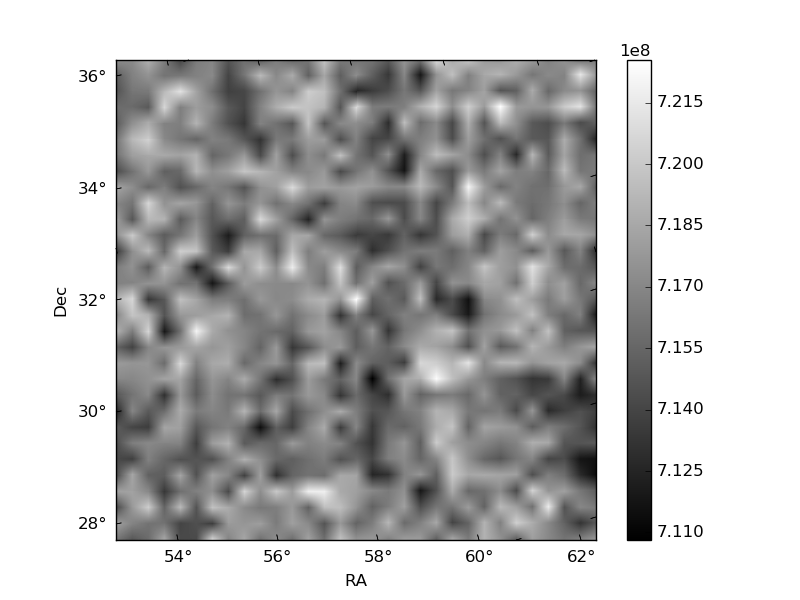
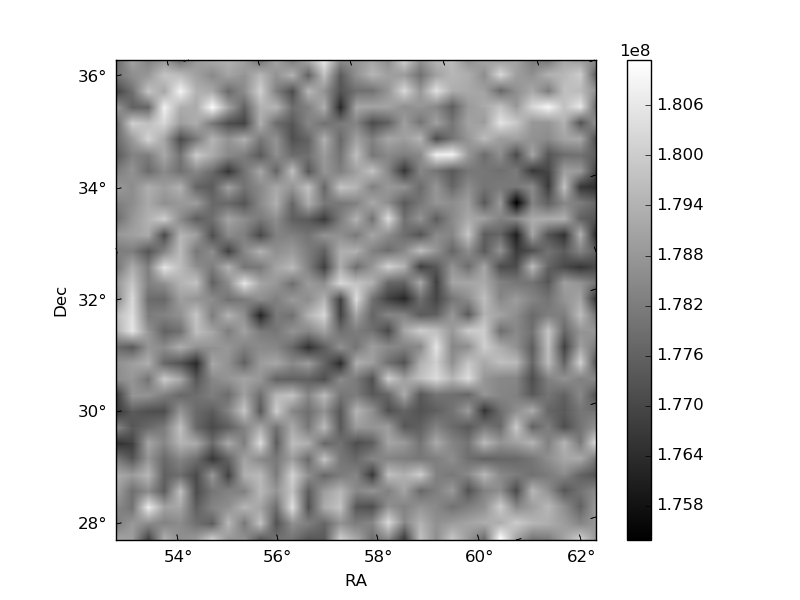
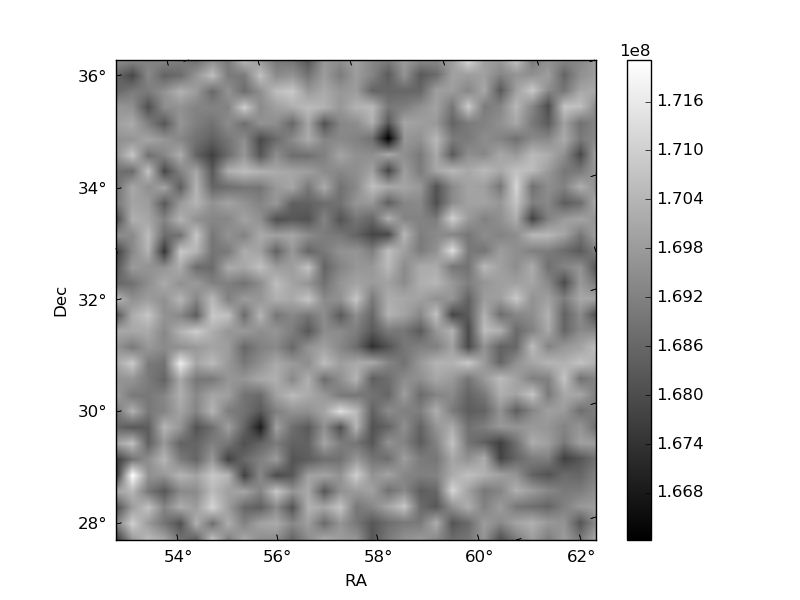
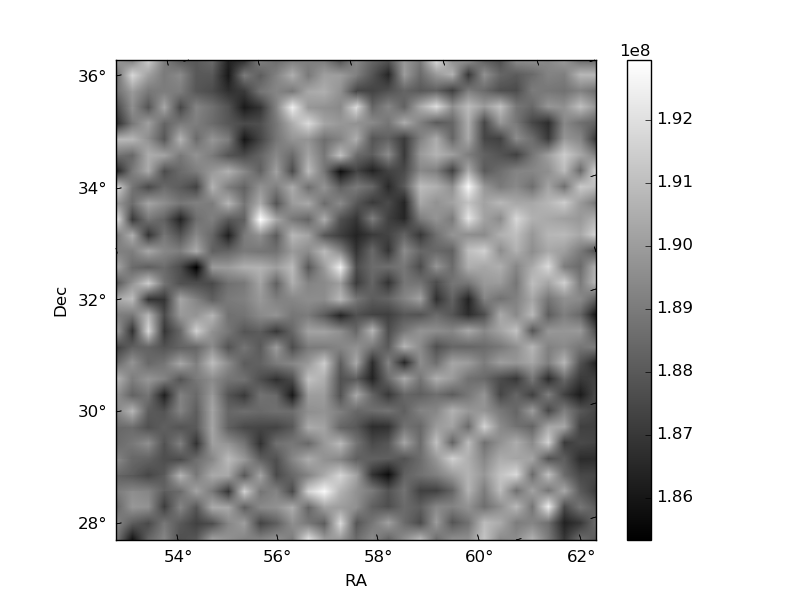
Histogram calculated using DETX and DETY for each event in the final _common_clean file
| Quadrant A | 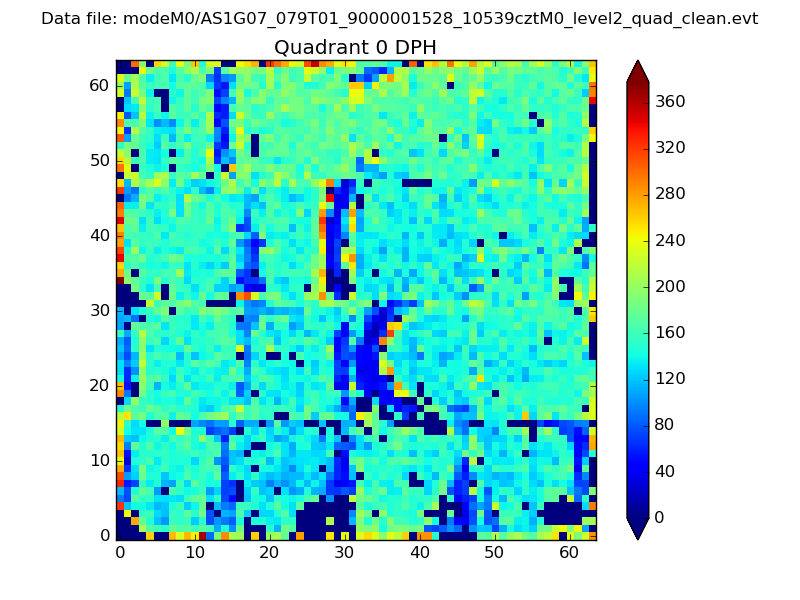 |
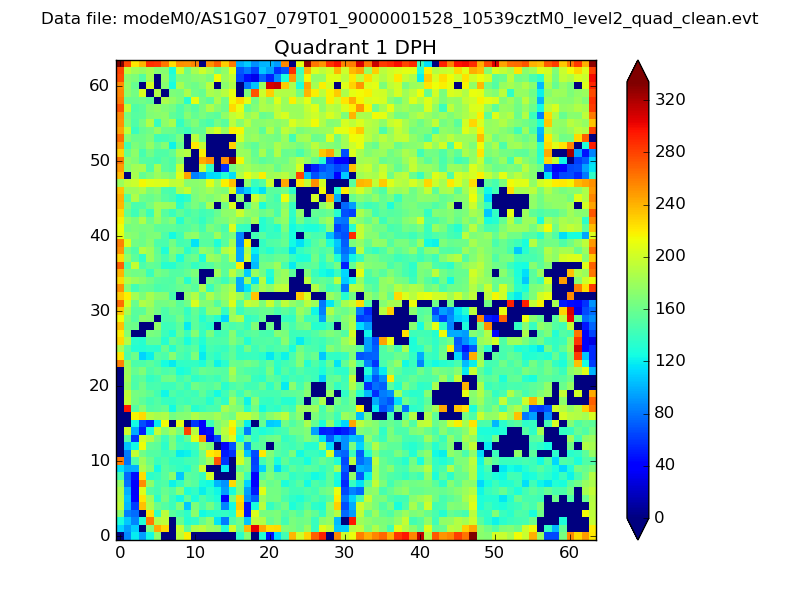 |
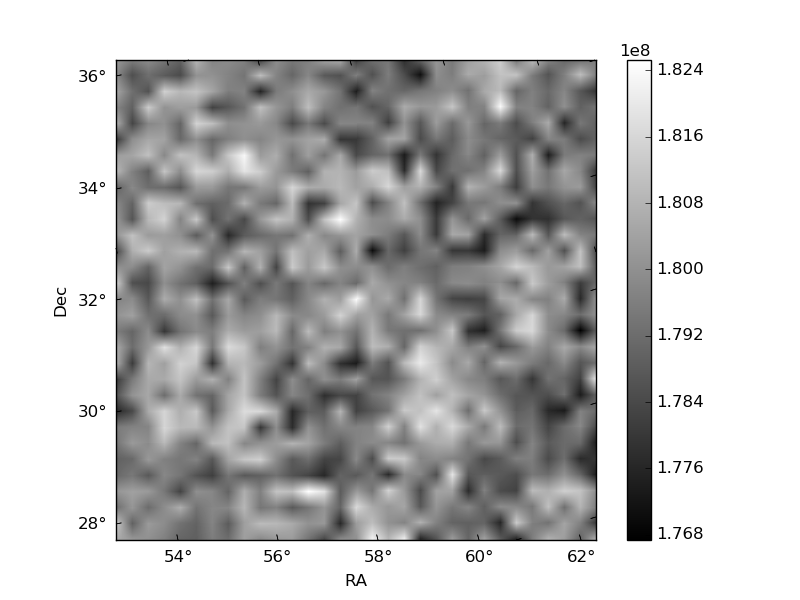
Quadrant B |
|---|---|---|---|
| Quadrant D | 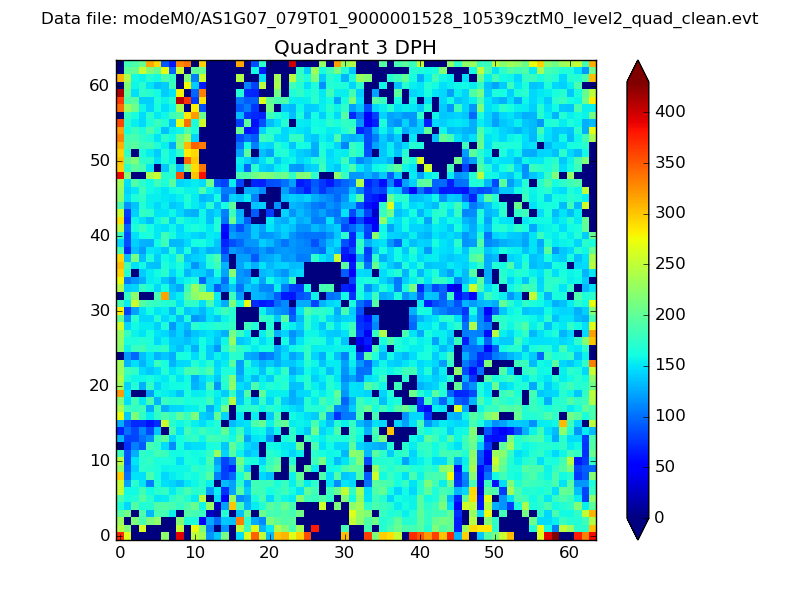 |
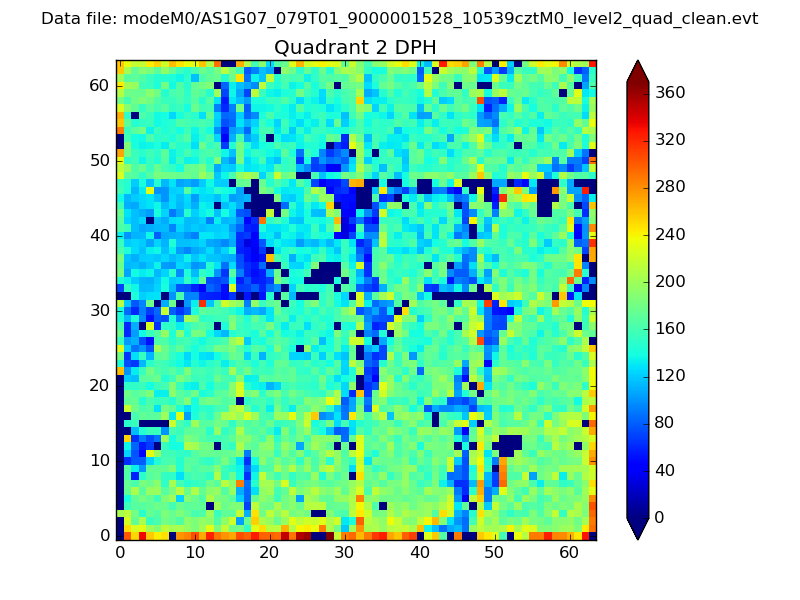 |
Quadrant C |
| Plot type | Count rate plots | Images |
|---|---|---|
| Comparison with Poisson distribution Blue bars denote a histogram of data divided into 1 sec bins. Red curve is a Poisson curve with rate = median count rate of data. |
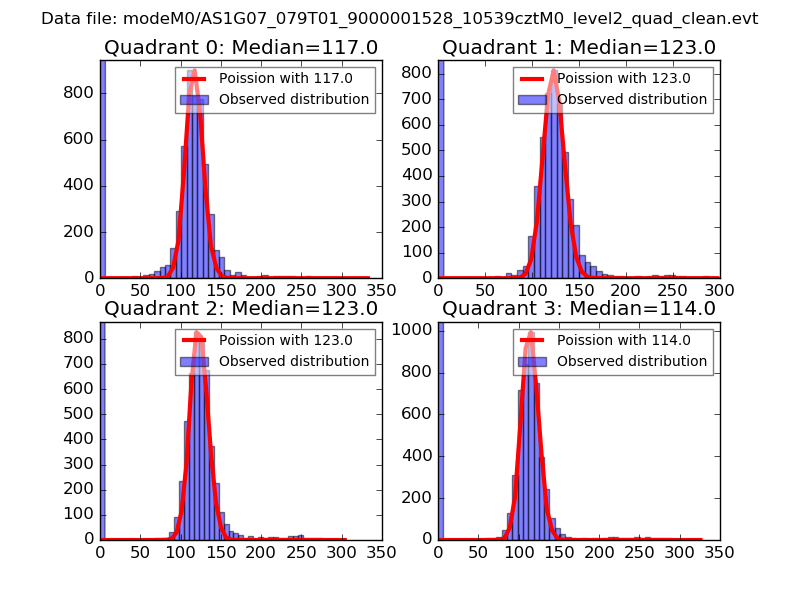 |
 |
| Quadrant-wise count rates Data is divided into 100 sec bins |
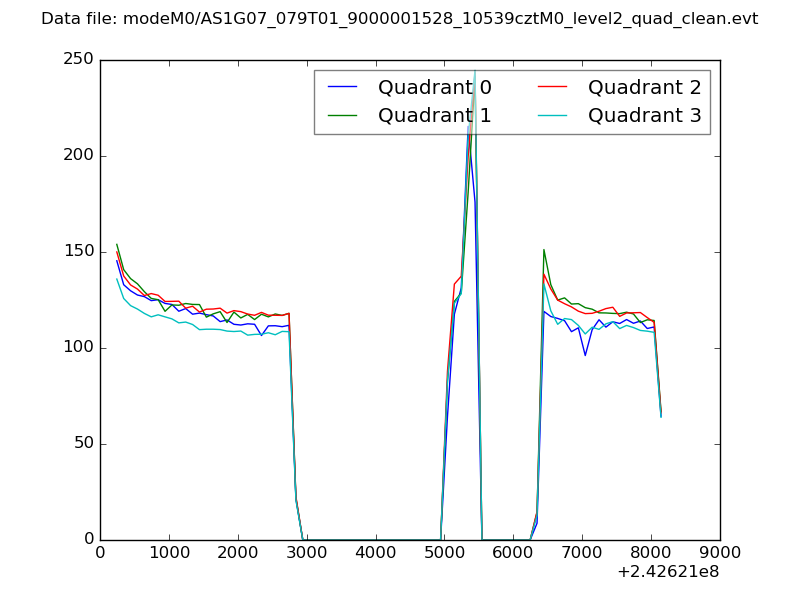 |
|
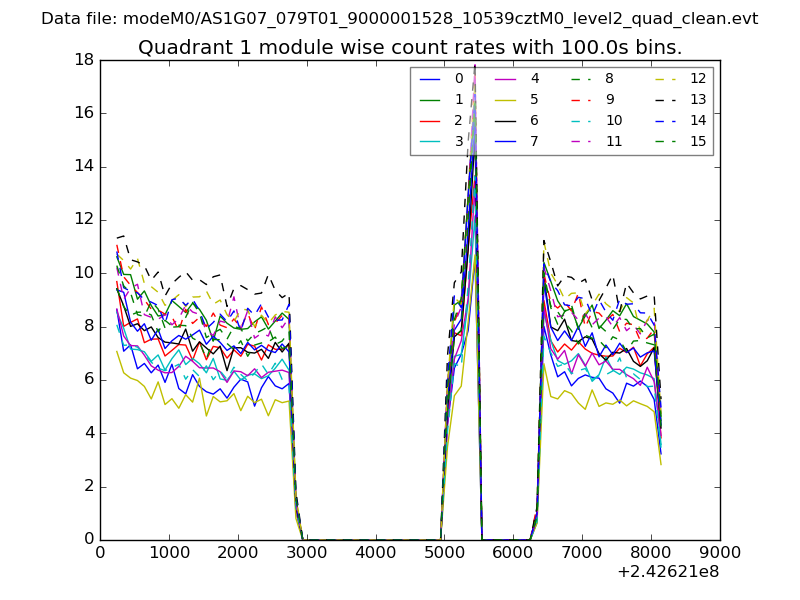
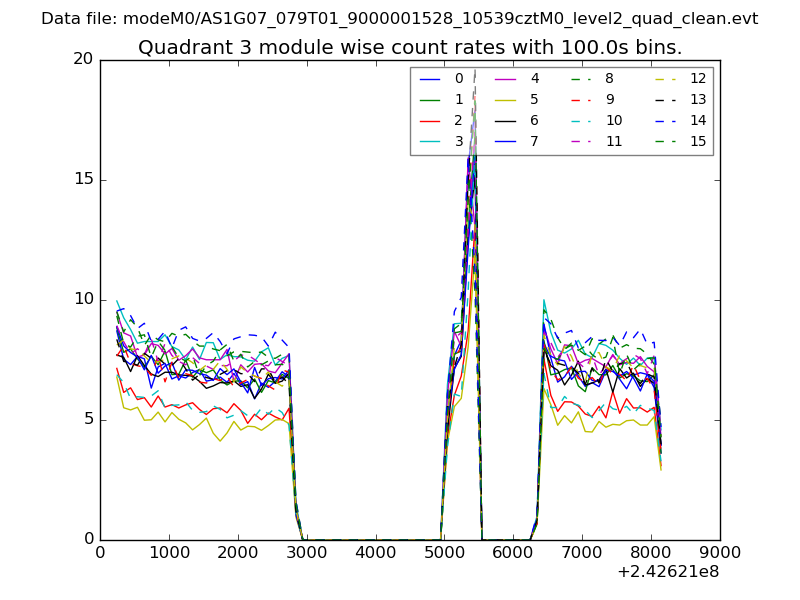
| Module-wise count rates for Quadrant A Data is divided into 100 sec bins |
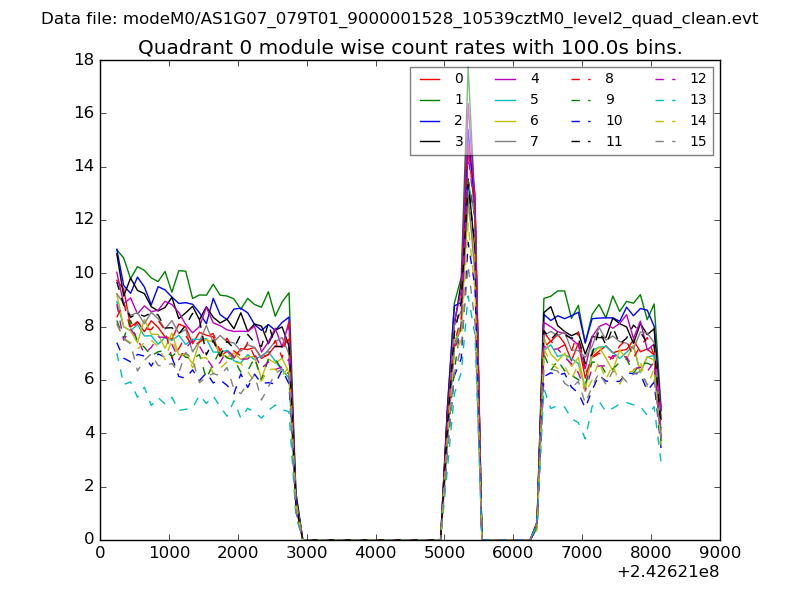 |
 |
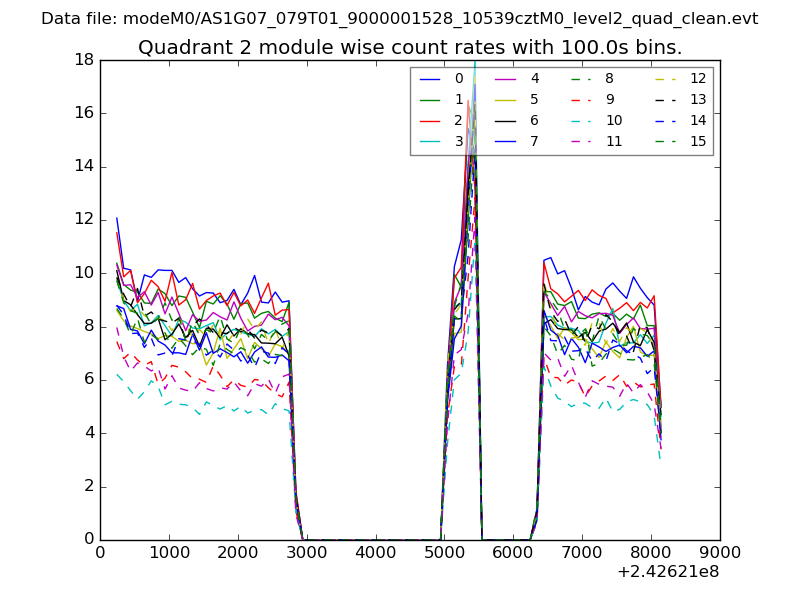
| Module-wise count rates for Quadrant B Data is divided into 100 sec bins |
 |
 |
| Module-wise count rates for Quadrant C Data is divided into 100 sec bins |
 |
 |
| Module-wise count rates for Quadrant D Data is divided into 100 sec bins |
 |
 |
| Parameter | Plot |
|---|---|
| CZT HV Monitor | 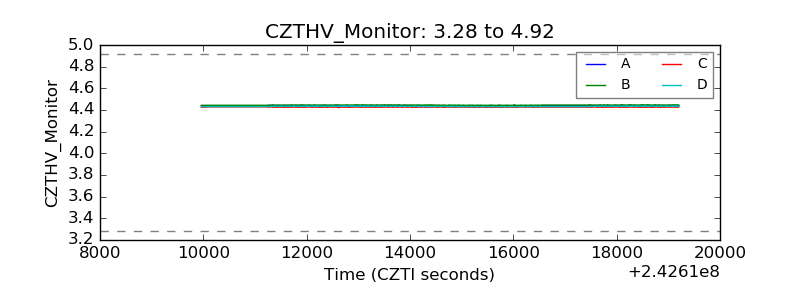 |
| D_VDD | 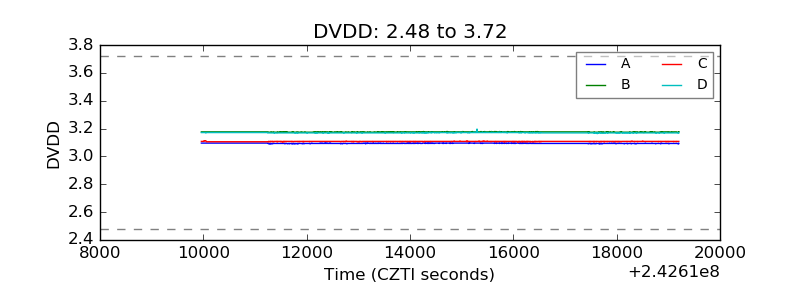 |
| Temperature 1 | 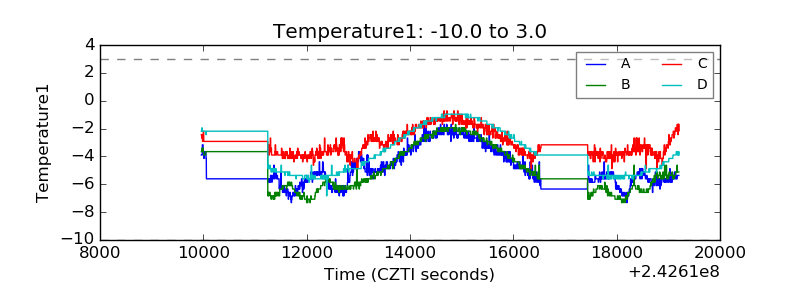 |
| Veto HV Monitor | 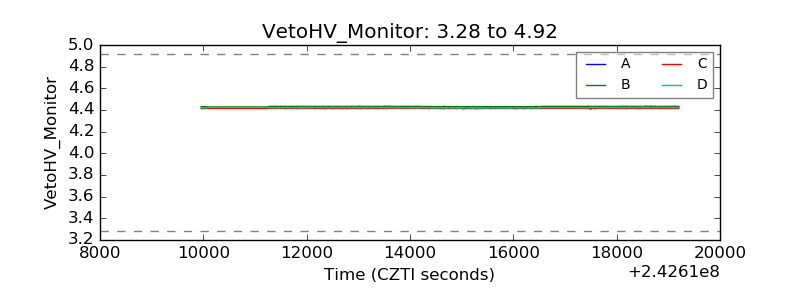 |
| Veto LLD | 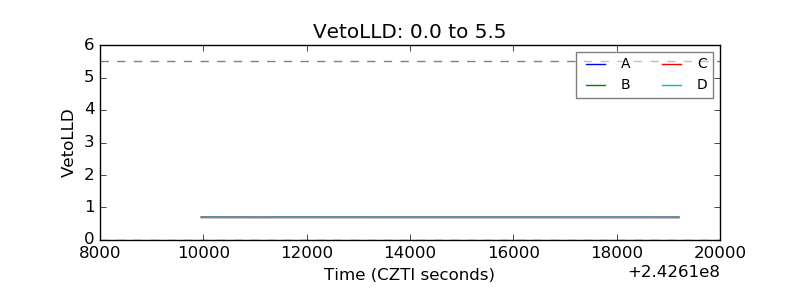 |
| Alpha Counter | 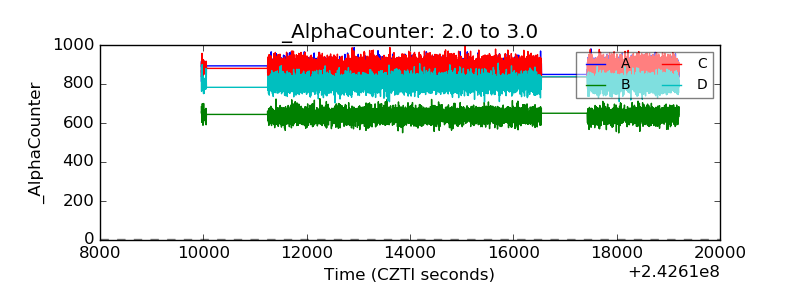 |
| _CPM_Rate | 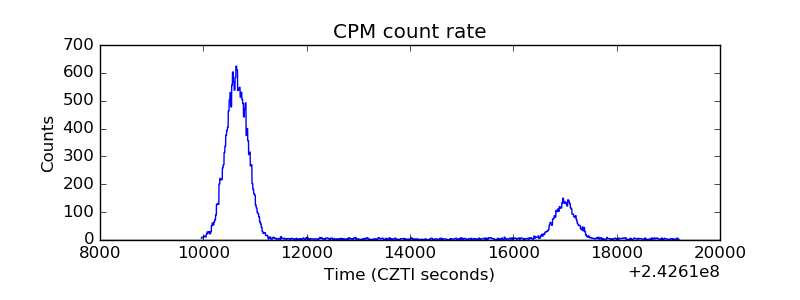 |
| CZT Counter | 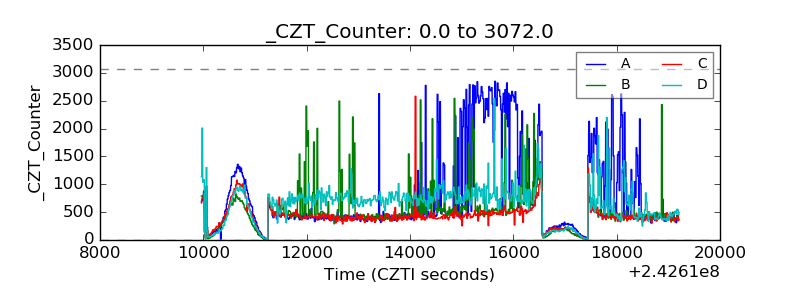 |
| +2.5 Volts monitor | 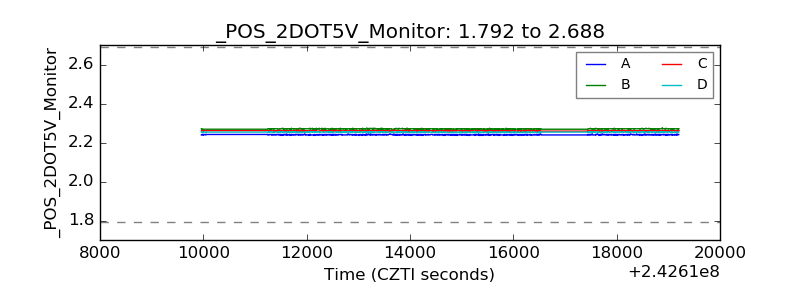 |
| +5 Volts monitor |  |
| _ROLL_ROT | 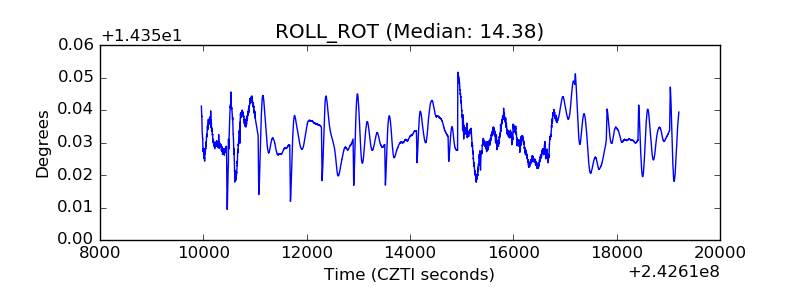 |
| _Roll_DEC | 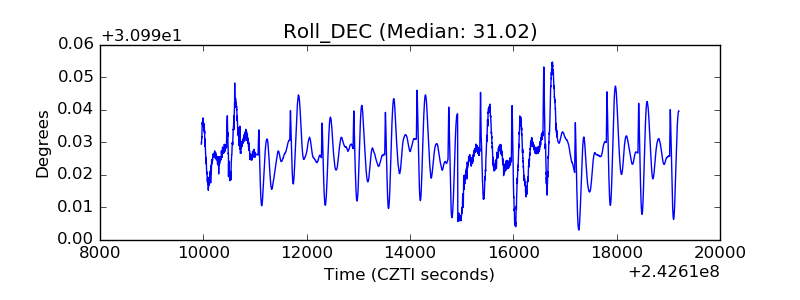 |
| _Roll_RA | 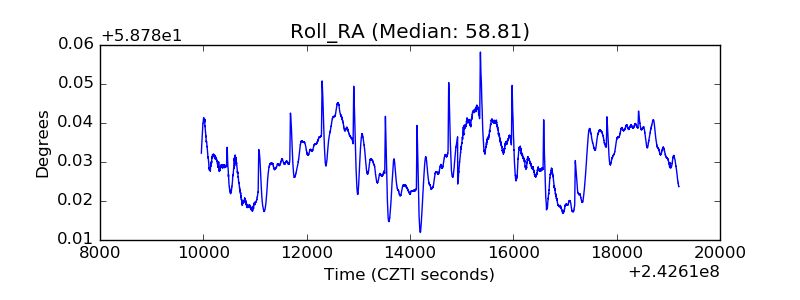 |
| Veto Counter | 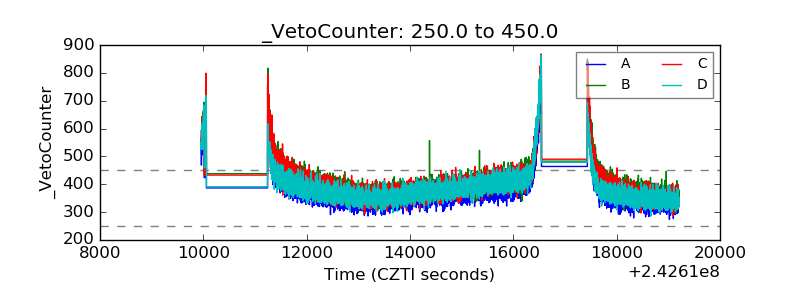 |