| Param | Original file | Final file |
|---|---|---|
| Filename | modeM0/AS1G07_079T01_9000001528_10542cztM0_level2.evt | modeM0/AS1G07_079T01_9000001528_10542cztM0_level2_quad_clean.evt |
| Size (bytes) | 575,887,680 | 87,422,400 |
| Size | 549.2 MB | 83.4 MB |
| Events in quadrant A | 4,430,351 | 530,912 |
| Events in quadrant B | 4,651,742 | 551,789 |
| Events in quadrant C | 3,208,201 | 556,159 |
| Events in quadrant D | 4,661,469 | 506,214 |
| Mode M9 | |||
|---|---|---|---|
| Quadrant | BADHDUFLAG | Total packets | Discarded packets |
| A | 0 | 1 | 0 |
| B | 0 | 1 | 0 |
| C | 0 | 1 | 0 |
| D | 0 | 1 | 0 |
| Mode M0 | |||
|---|---|---|---|
| Quadrant | BADHDUFLAG | Total packets | Discarded packets |
| A | 0 | 17972 | 2 |
| B | 0 | 18726 | 1 |
| C | 0 | 14853 | 1 |
| D | 0 | 18464 | 1 |
| Mode SS | |||
|---|---|---|---|
| Quadrant | BADHDUFLAG | Total packets | Discarded packets |
| A | 0 | 144 | 0 |
| B | 0 | 144 | 0 |
| C | 0 | 144 | 0 |
| D | 0 | 144 | 0 |
| Quadrant | Total seconds | Saturated seconds | Saturation percentage |
|---|---|---|---|
| A | 7216 | 292 | 4.046563% |
| B | 7216 | 591 | 8.190133% |
| C | 7216 | 148 | 2.050998% |
| D | 7216 | 453 | 6.277716% |
Noise dominated data is calculated using 1-second bins in cleaned event files. If a bin has >2000 counts, and if more than 50% of those come from <1% of pixels, then it is considered to be noise-dominated and hence unusable.
| Quadrant | # 1 sec bins | Bins with >0 counts | Bins with >2000 counts | High rate bins dominated by noise | Noise dominated (total time) | Noise dominated (detector-on time) | Marked lightcurve |
|---|---|---|---|---|---|---|---|
| A | 7271 | 7217 | 15 | 15 | 0.21% | 0.21% | 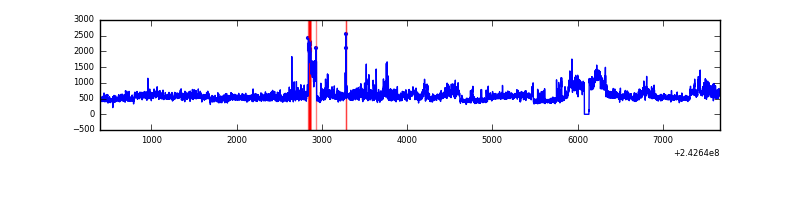 |
| B | 7271 | 7217 | 304 | 304 | 4.18% | 4.21% | 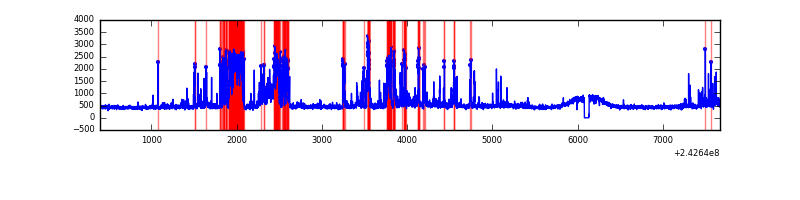 |
| C | 7271 | 7217 | 0 | 0 | 0.00% | 0.00% |  |
| D | 7271 | 7217 | 270 | 270 | 3.71% | 3.74% | 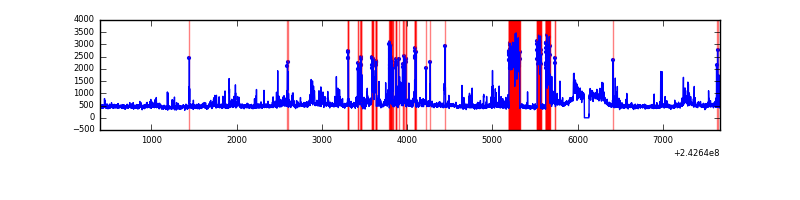 |
Top three noisy pixels from each quadrant. If the there are fewer than three noisy pixels in the level2.evt file, extra rows are filled as -1
| Pixel properties | Quadrant properties | ||||||
|---|---|---|---|---|---|---|---|
| Quadrant | DetID | PixID | Counts | Sigma | Mean | Median | Sigma |
| A | 15 | 239 | 1122442 | 6573.53 | 830 | 811 | 170.6 |
| A | 13 | 251 | 71451 | 414.0 | 830 | 811 | 170.6 |
| A | 8 | 5 | 30082 | 171.55 | 830 | 811 | 170.6 |
| B | 4 | 239 | 1259649 | 7877.09 | 823 | 801 | 159.8 |
| B | 11 | 51 | 107735 | 669.13 | 823 | 801 | 159.8 |
| B | 0 | 214 | 39196 | 240.25 | 823 | 801 | 159.8 |
| C | 14 | 234 | 10083 | 48.82 | 817 | 818 | 189.8 |
| C | 13 | 61 | 6229 | 28.51 | 817 | 818 | 189.8 |
| C | 8 | 128 | 4404 | 18.89 | 817 | 818 | 189.8 |
| D | 1 | 20 | 635354 | 3287.99 | 797 | 774 | 193.0 |
| D | 8 | 195 | 429390 | 2220.81 | 797 | 774 | 193.0 |
| D | 5 | 222 | 270365 | 1396.85 | 797 | 774 | 193.0 |
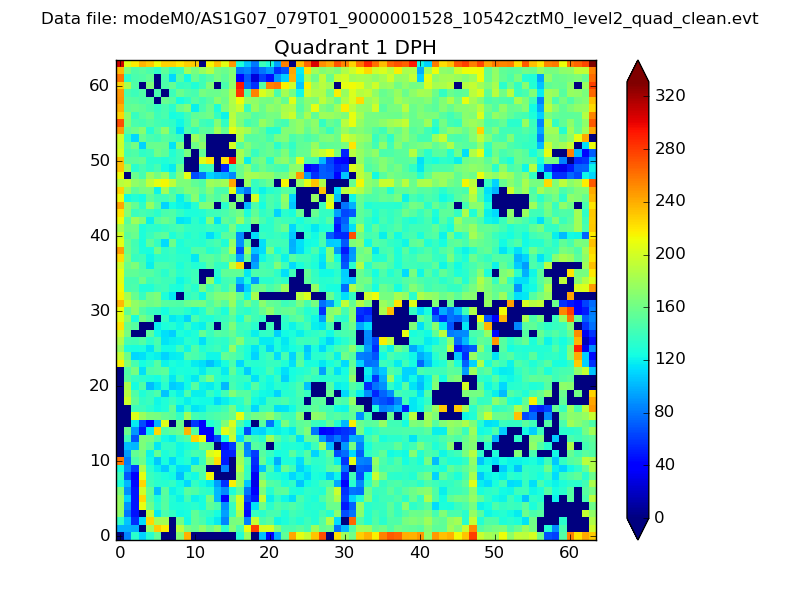
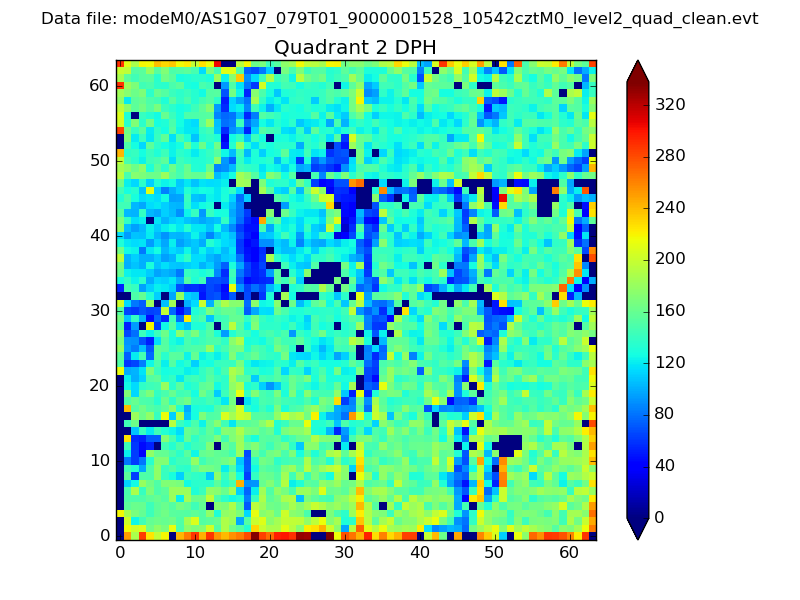
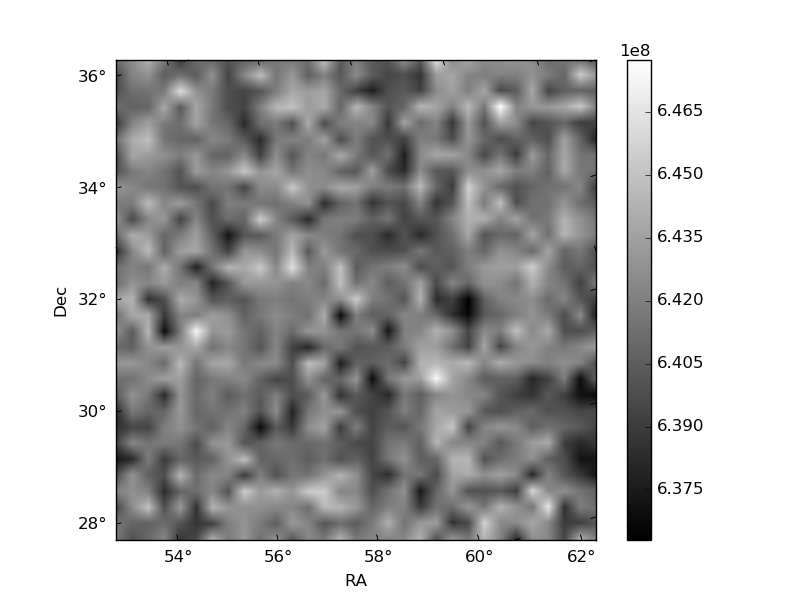
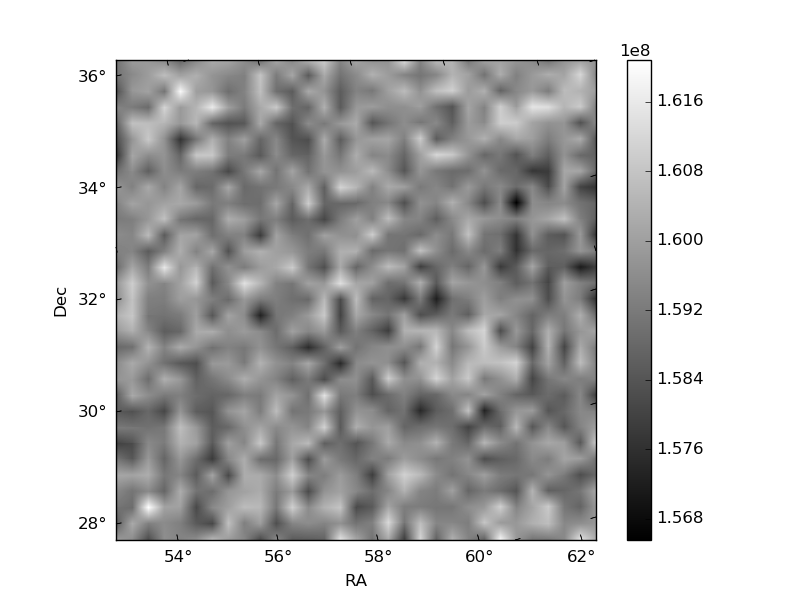
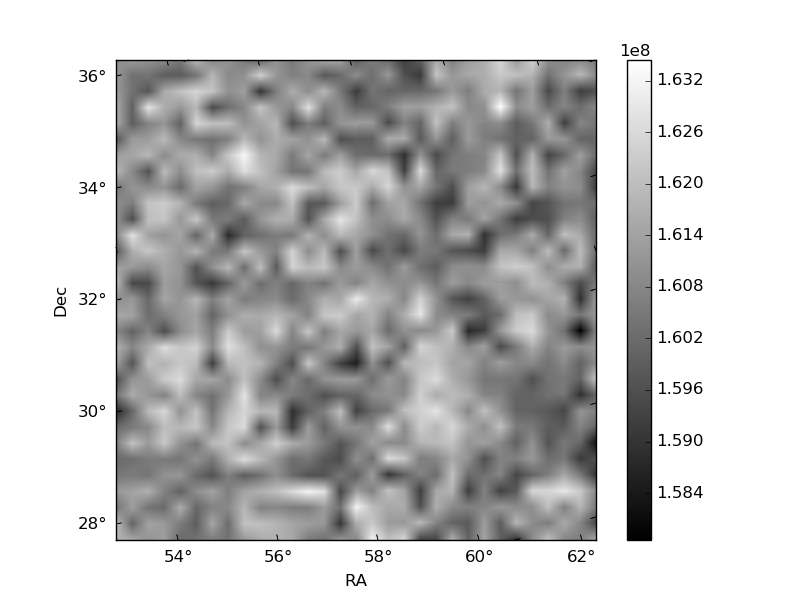
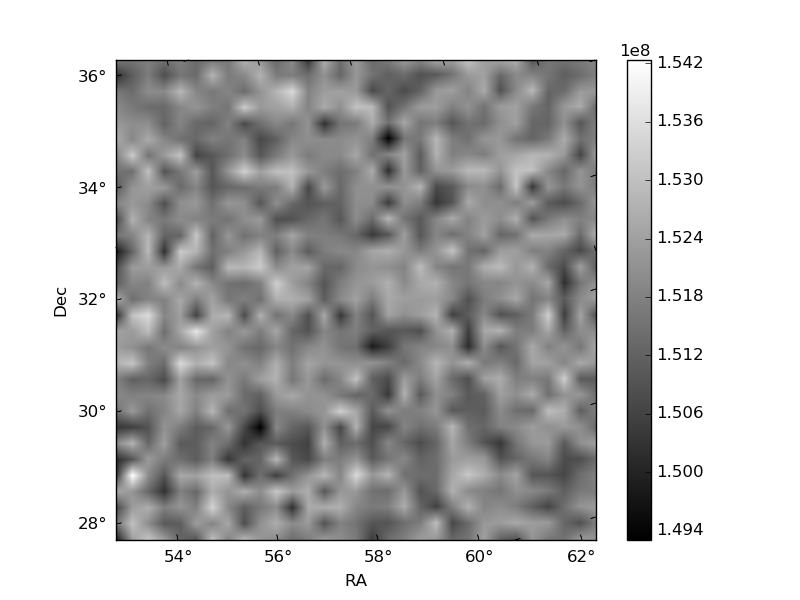
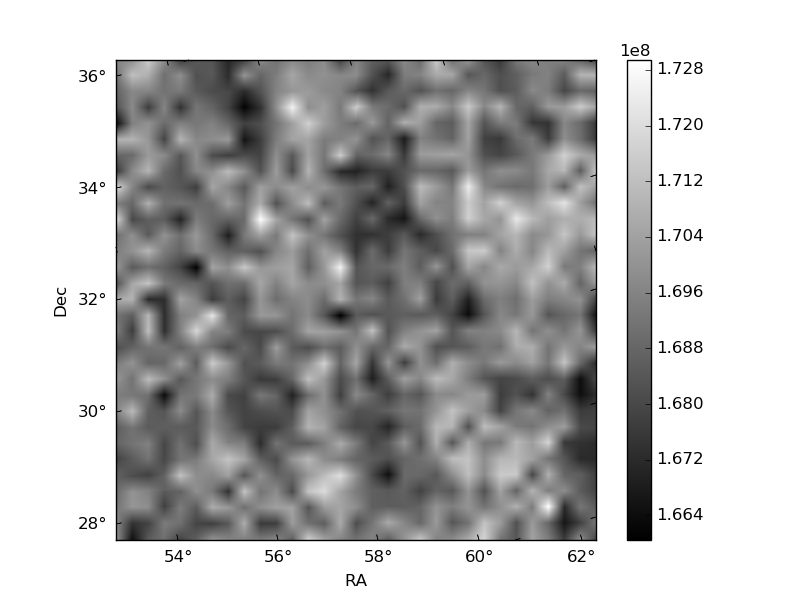
Histogram calculated using DETX and DETY for each event in the final _common_clean file
| Quadrant A | 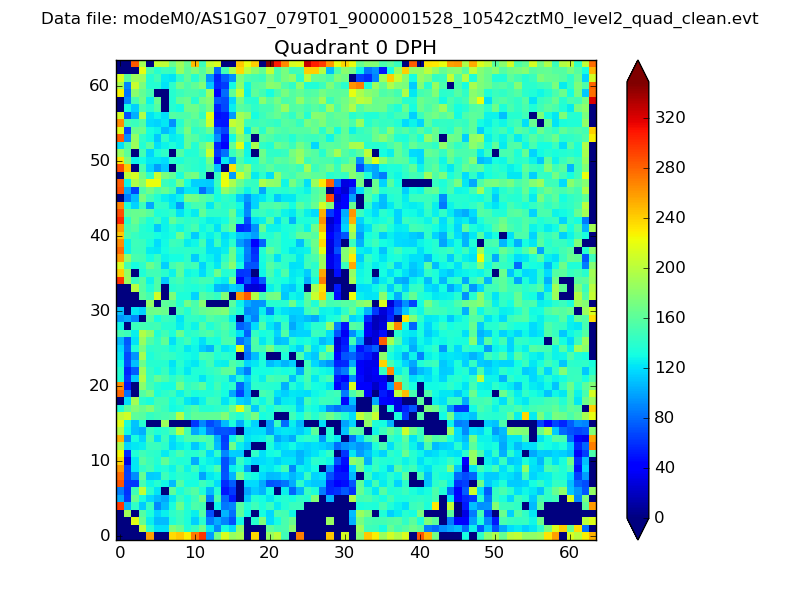 |
 |
Quadrant B |
|---|---|---|---|
| Quadrant D | 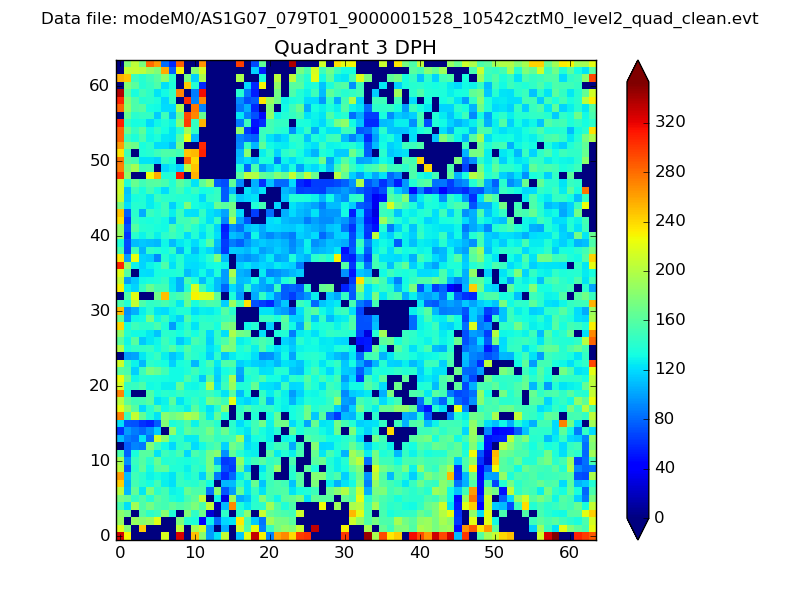 |
 |
Quadrant C |
| Plot type | Count rate plots | Images |
|---|---|---|
| Comparison with Poisson distribution Blue bars denote a histogram of data divided into 1 sec bins. Red curve is a Poisson curve with rate = median count rate of data. |
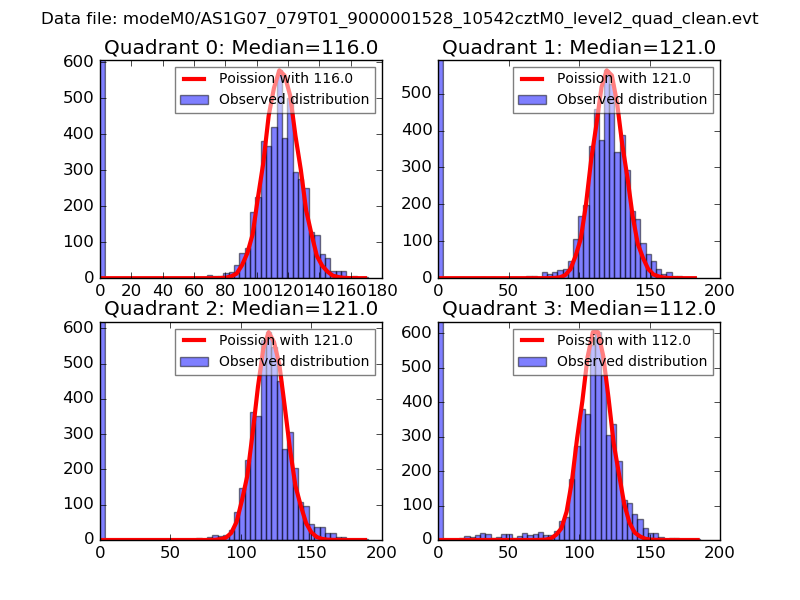 |
 |
| Quadrant-wise count rates Data is divided into 100 sec bins |
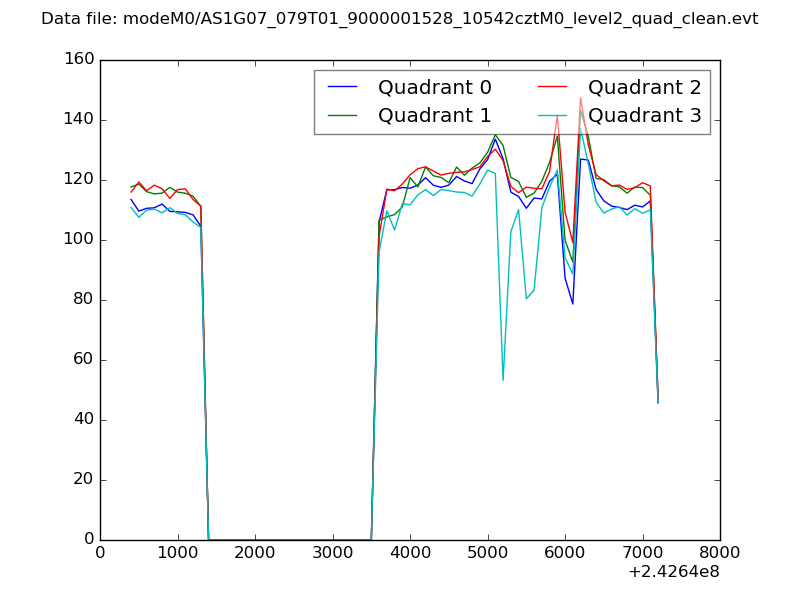 |
|
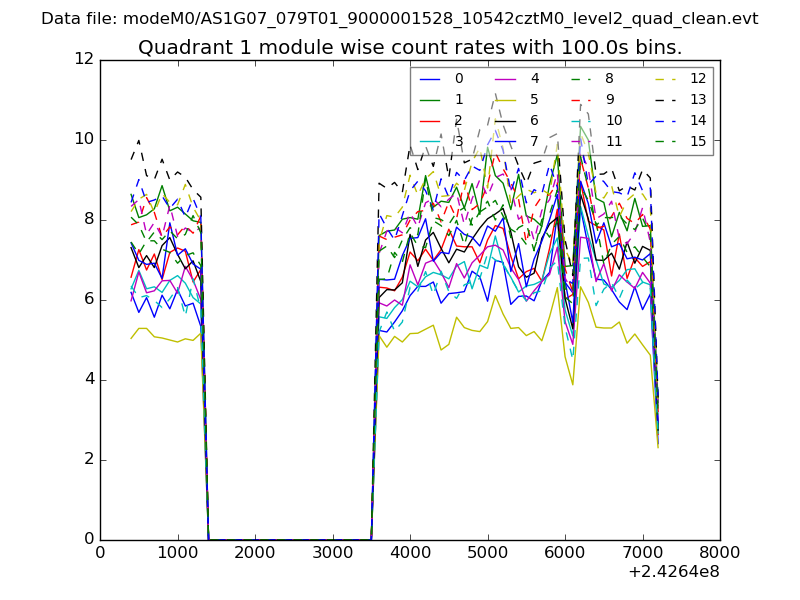
| Module-wise count rates for Quadrant A Data is divided into 100 sec bins |
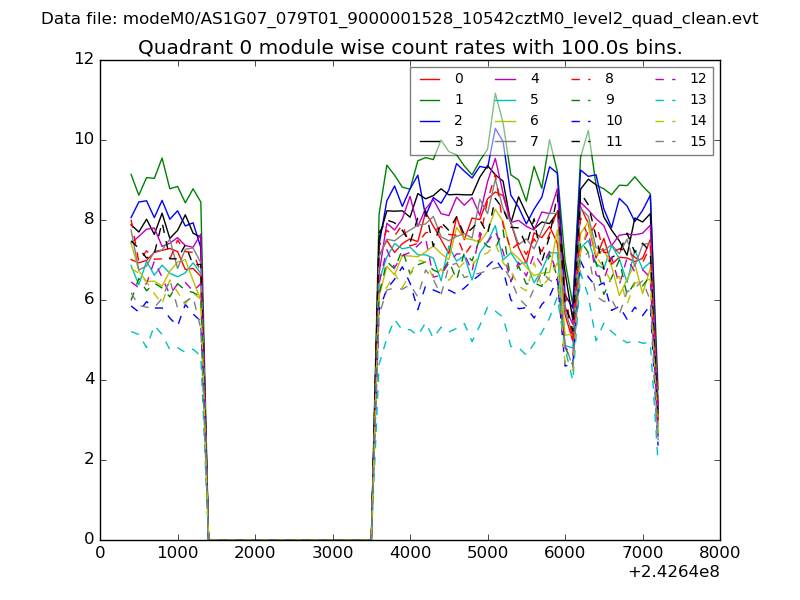 |
 |
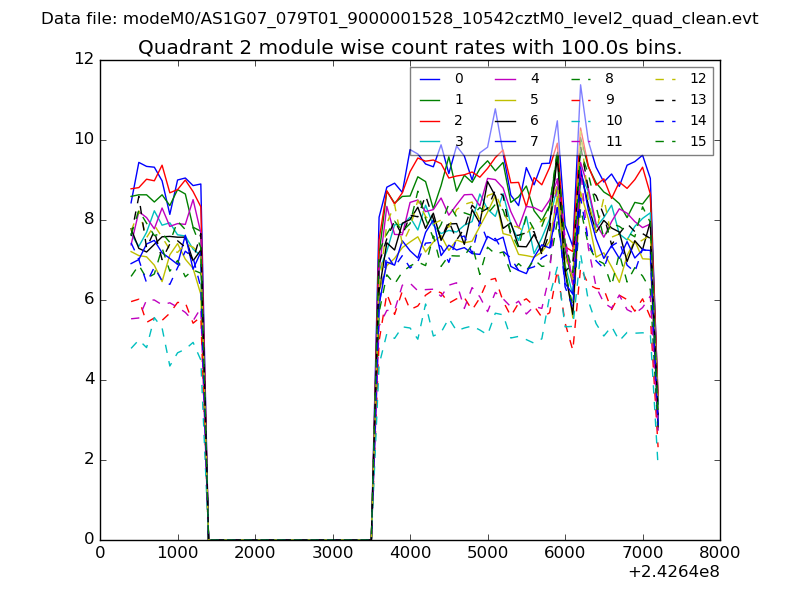
| Module-wise count rates for Quadrant B Data is divided into 100 sec bins |
 |
 |
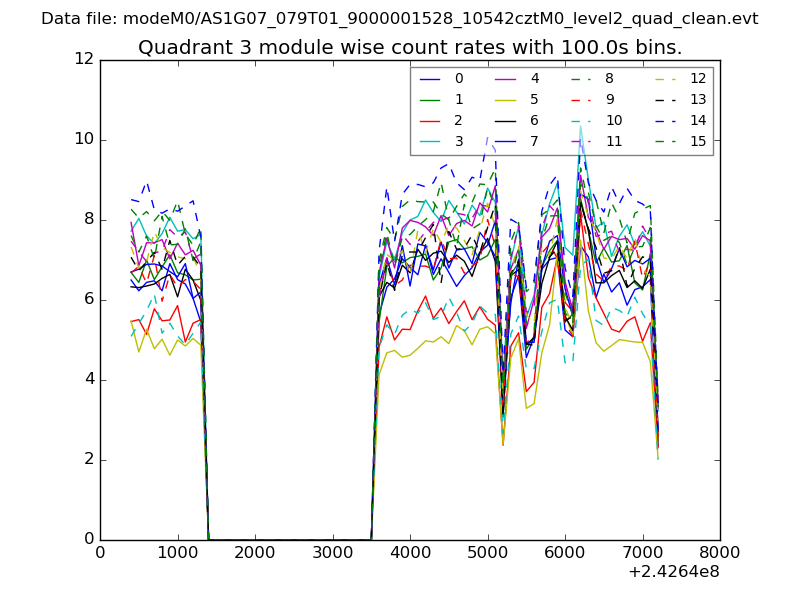
| Module-wise count rates for Quadrant C Data is divided into 100 sec bins |
 |
 |
| Module-wise count rates for Quadrant D Data is divided into 100 sec bins |
 |
 |
| Parameter | Plot |
|---|---|
| CZT HV Monitor | 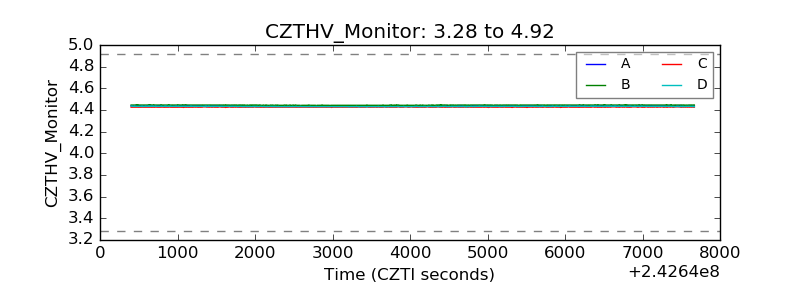 |
| D_VDD | 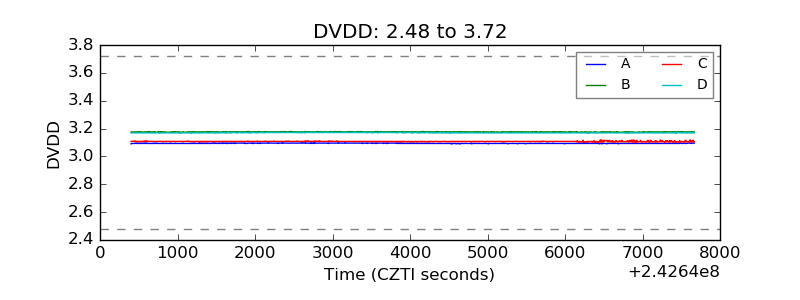 |
| Temperature 1 | 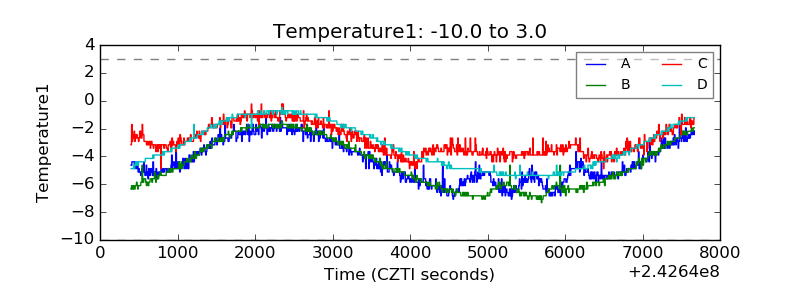 |
| Veto HV Monitor | 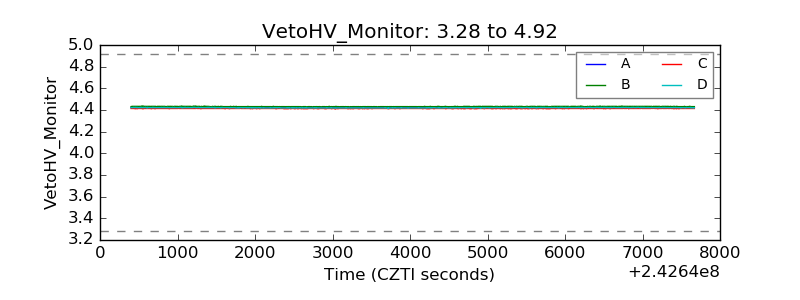 |
| Veto LLD | 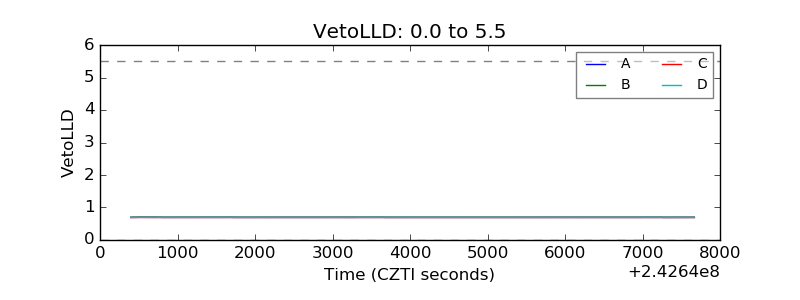 |
| Alpha Counter | 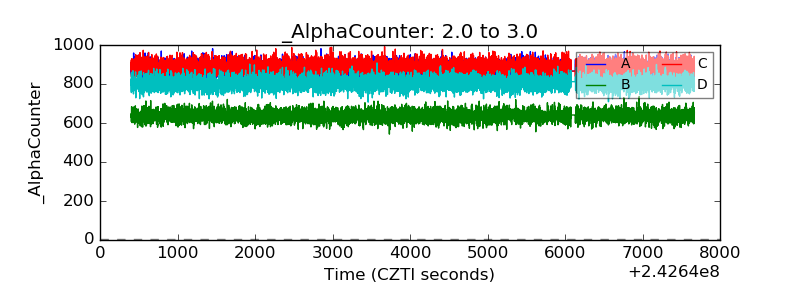 |
| _CPM_Rate | 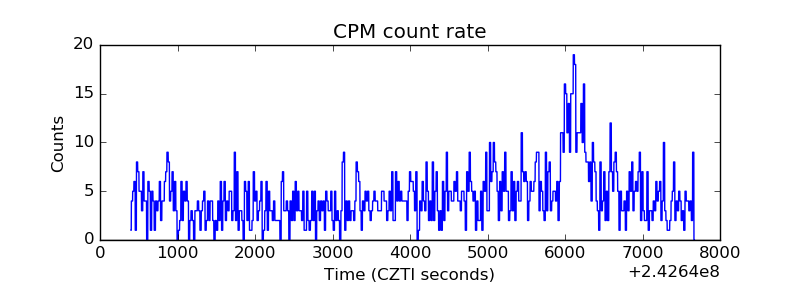 |
| CZT Counter | 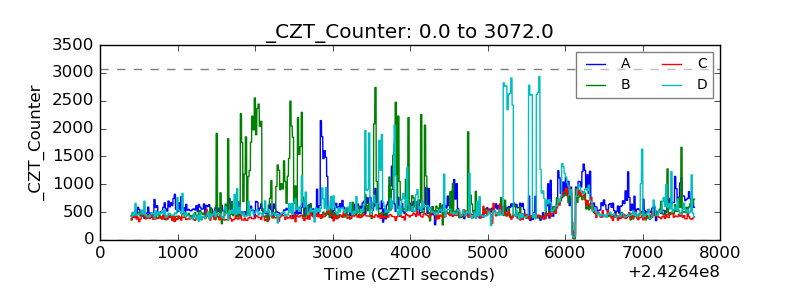 |
| +2.5 Volts monitor |  |
| +5 Volts monitor | 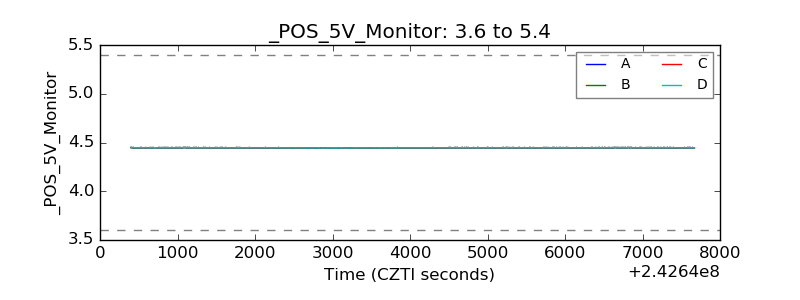 |
| _ROLL_ROT | 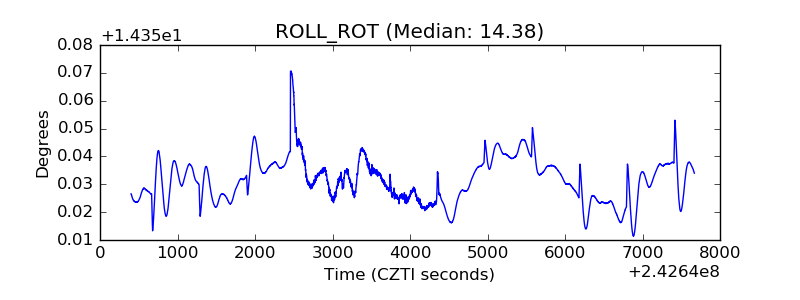 |
| _Roll_DEC | 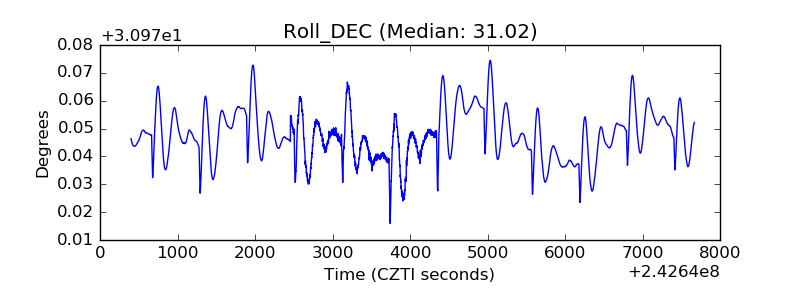 |
| _Roll_RA | 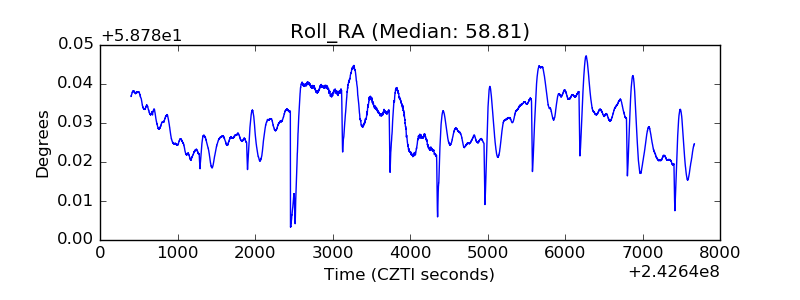 |
| Veto Counter | 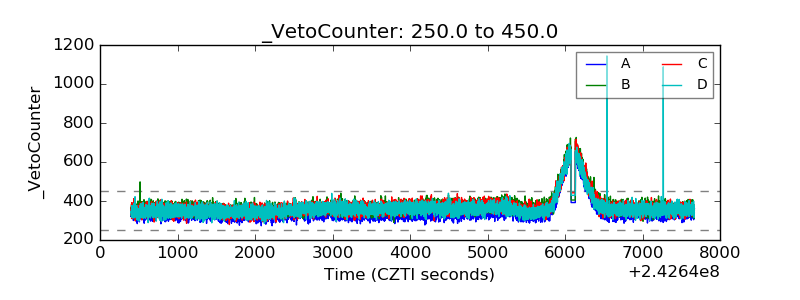 |