| Param | Original file | Final file |
|---|---|---|
| Filename | modeM0/AS1G07_079T01_9000001528_10545cztM0_level2.evt | modeM0/AS1G07_079T01_9000001528_10545cztM0_level2_quad_clean.evt |
| Size (bytes) | 1,440,892,800 | 208,635,840 |
| Size | 1.3 GB | 199.0 MB |
| Events in quadrant A | 10,578,344 | 1,246,016 |
| Events in quadrant B | 11,620,063 | 1,277,833 |
| Events in quadrant C | 8,368,276 | 1,280,833 |
| Events in quadrant D | 11,799,557 | 1,216,200 |
| Mode M9 | |||
|---|---|---|---|
| Quadrant | BADHDUFLAG | Total packets | Discarded packets |
| A | 0 | 16 | 0 |
| B | 0 | 16 | 0 |
| C | 0 | 16 | 0 |
| D | 0 | 16 | 0 |
| Mode M0 | |||
|---|---|---|---|
| Quadrant | BADHDUFLAG | Total packets | Discarded packets |
| A | 0 | 43807 | 4 |
| B | 0 | 46883 | 3 |
| C | 0 | 38459 | 3 |
| D | 0 | 47263 | 3 |
| Mode SS | |||
|---|---|---|---|
| Quadrant | BADHDUFLAG | Total packets | Discarded packets |
| A | 0 | 384 | 0 |
| B | 0 | 384 | 0 |
| C | 0 | 384 | 0 |
| D | 0 | 384 | 0 |
| Quadrant | Total seconds | Saturated seconds | Saturation percentage |
|---|---|---|---|
| A | 18823 | 475 | 2.523508% |
| B | 18823 | 917 | 4.871700% |
| C | 18823 | 255 | 1.354726% |
| D | 18823 | 465 | 2.470382% |
Noise dominated data is calculated using 1-second bins in cleaned event files. If a bin has >2000 counts, and if more than 50% of those come from <1% of pixels, then it is considered to be noise-dominated and hence unusable.
| Quadrant | # 1 sec bins | Bins with >0 counts | Bins with >2000 counts | High rate bins dominated by noise | Noise dominated (total time) | Noise dominated (detector-on time) | Marked lightcurve |
|---|---|---|---|---|---|---|---|
| A | 20498 | 18826 | 113 | 113 | 0.55% | 0.60% | 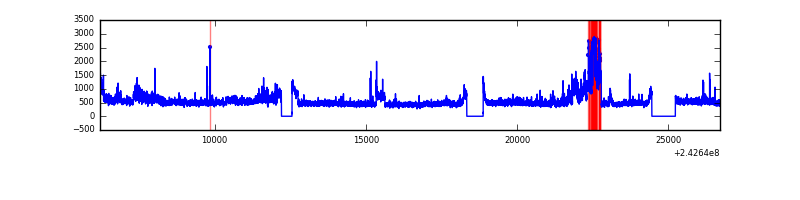 |
| B | 20498 | 18826 | 417 | 417 | 2.03% | 2.22% | 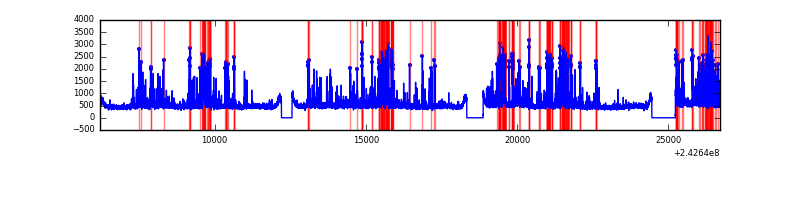 |
| C | 20498 | 18826 | 3 | 3 | 0.01% | 0.02% | 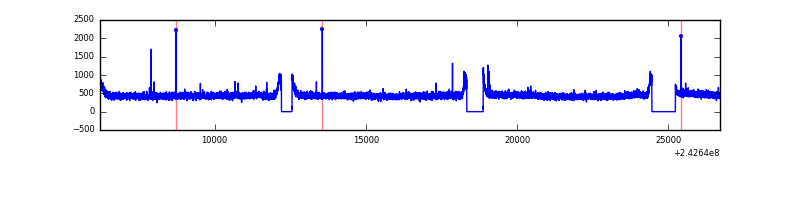 |
| D | 20498 | 18826 | 175 | 175 | 0.85% | 0.93% | 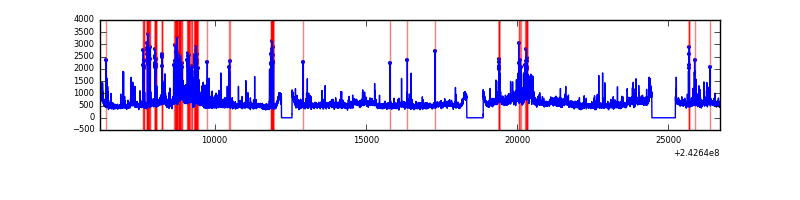 |
Top three noisy pixels from each quadrant. If the there are fewer than three noisy pixels in the level2.evt file, extra rows are filled as -1
| Pixel properties | Quadrant properties | ||||||
|---|---|---|---|---|---|---|---|
| Quadrant | DetID | PixID | Counts | Sigma | Mean | Median | Sigma |
| A | 15 | 239 | 2010349 | 4515.44 | 2182 | 2130 | 444.7 |
| A | 1 | 162 | 55706 | 120.46 | 2182 | 2130 | 444.7 |
| A | 8 | 5 | 36135 | 76.46 | 2182 | 2130 | 444.7 |
| B | 4 | 239 | 2434488 | 5836.41 | 2176 | 2125 | 416.8 |
| B | 11 | 51 | 346115 | 825.4 | 2176 | 2125 | 416.8 |
| B | 0 | 214 | 133119 | 314.32 | 2176 | 2125 | 416.8 |
| C | 14 | 234 | 22670 | 41.08 | 2138 | 2147 | 499.6 |
| C | 13 | 61 | 15849 | 27.42 | 2138 | 2147 | 499.6 |
| C | 8 | 128 | 6945 | 9.6 | 2138 | 2147 | 499.6 |
| D | 2 | 16 | 1556649 | 3056.25 | 2113 | 2053 | 508.7 |
| D | 8 | 195 | 1116722 | 2191.37 | 2113 | 2053 | 508.7 |
| D | 5 | 222 | 568033 | 1112.68 | 2113 | 2053 | 508.7 |
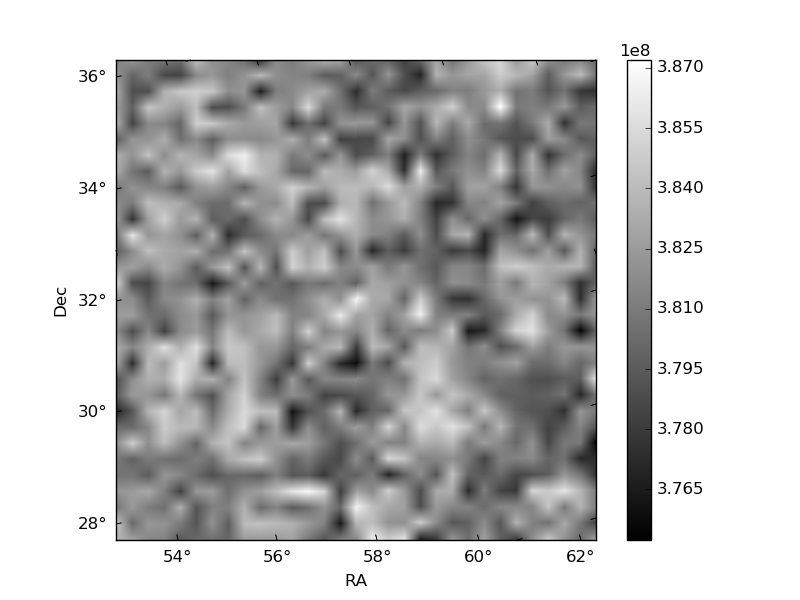
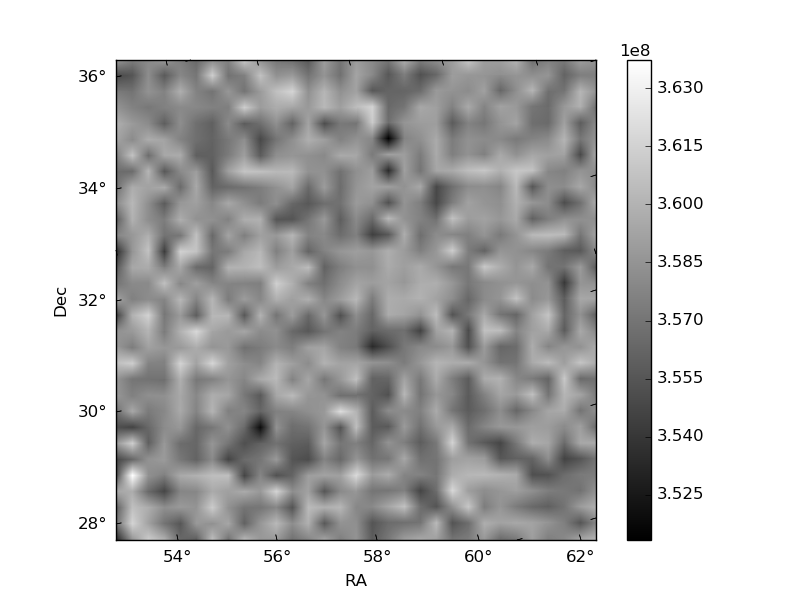
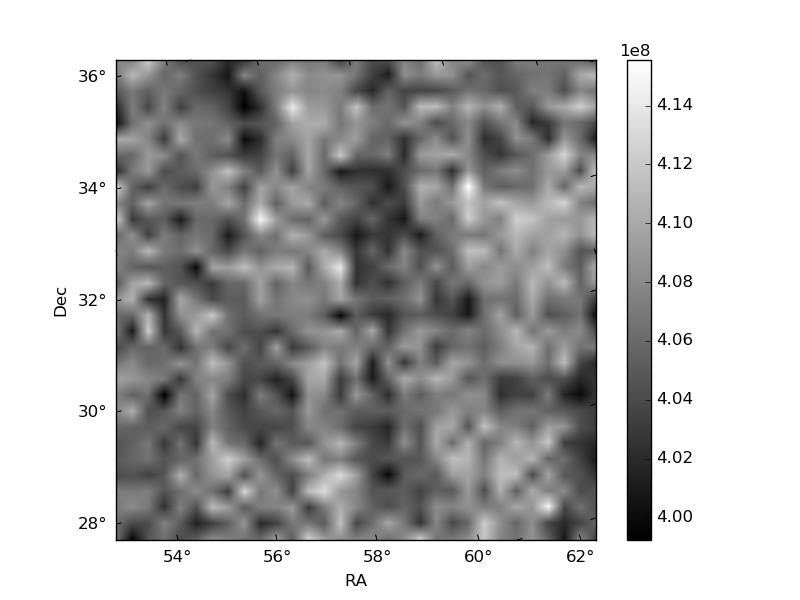
Histogram calculated using DETX and DETY for each event in the final _common_clean file
| Quadrant A | 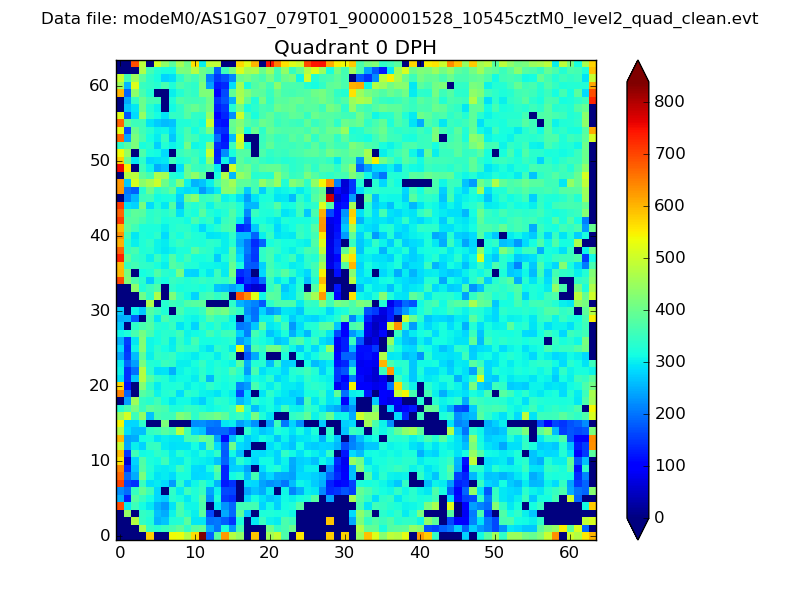 |
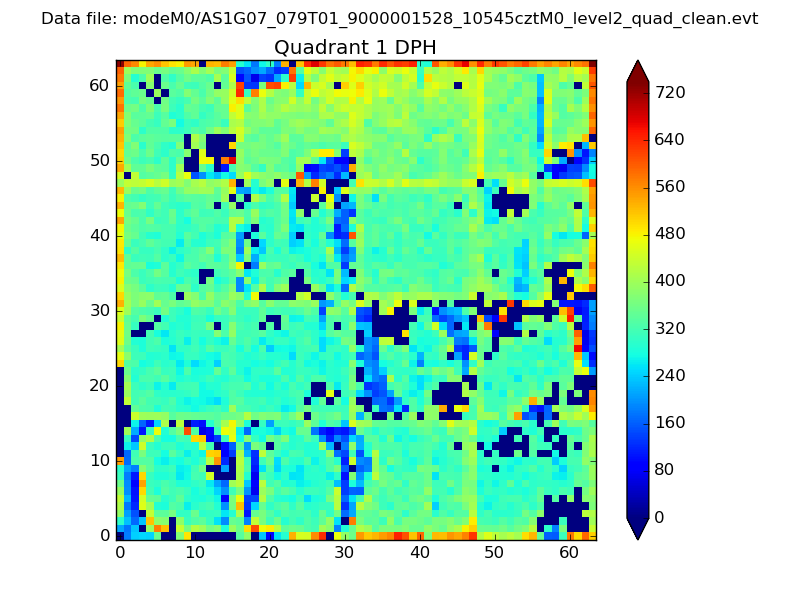 |
Quadrant B |
|---|---|---|---|
| Quadrant D | 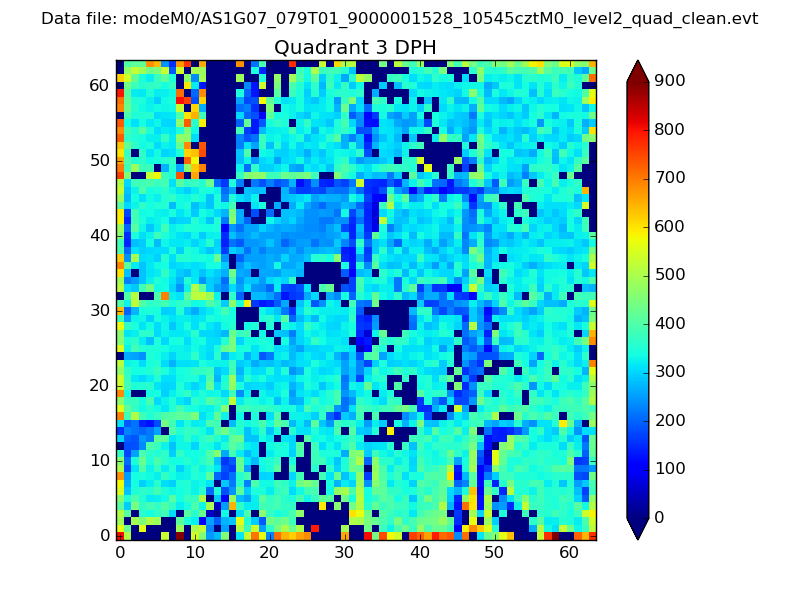 |
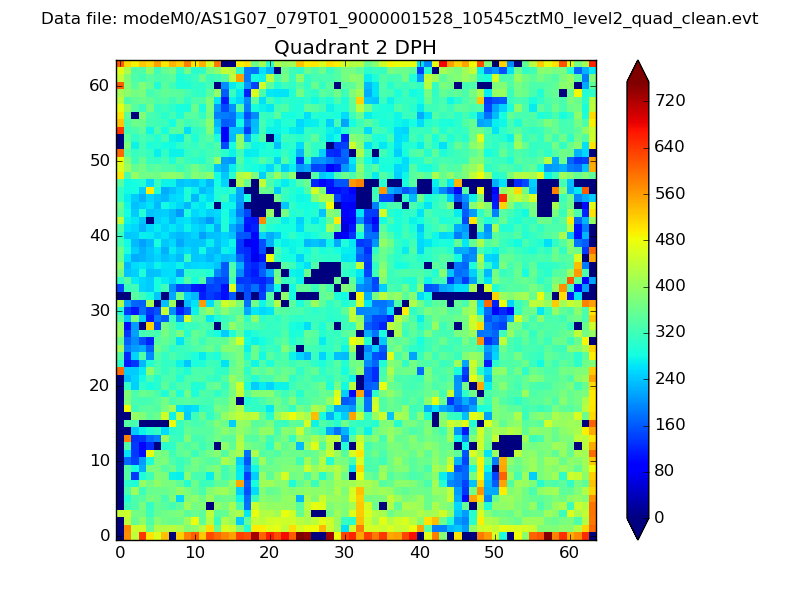 |
Quadrant C |
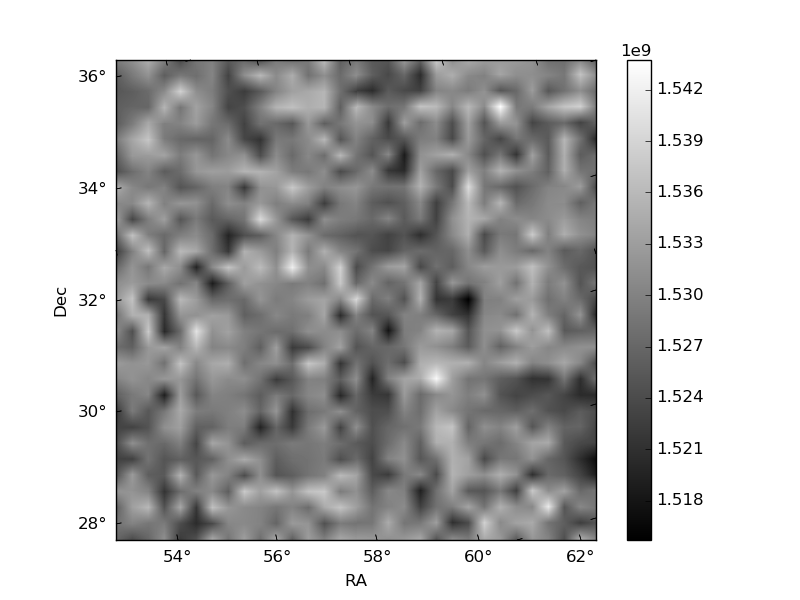
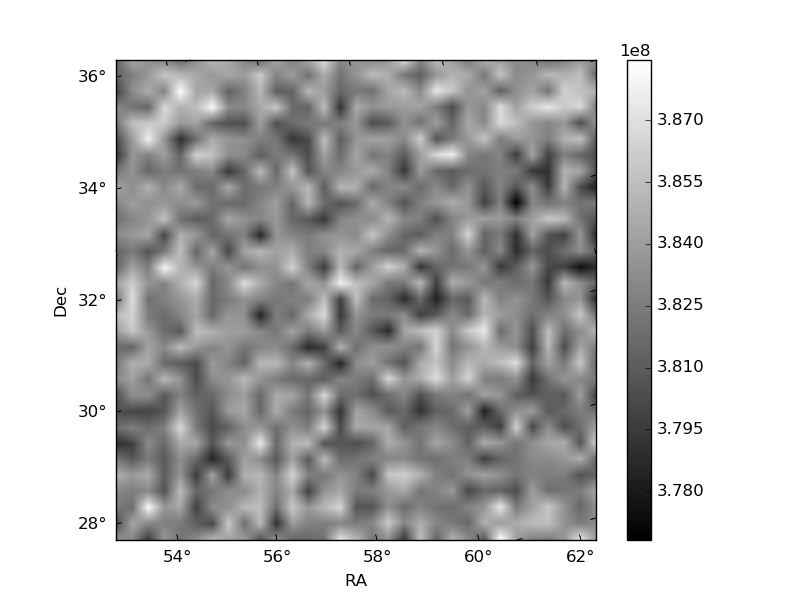
| Plot type | Count rate plots | Images |
|---|---|---|
| Comparison with Poisson distribution Blue bars denote a histogram of data divided into 1 sec bins. Red curve is a Poisson curve with rate = median count rate of data. |
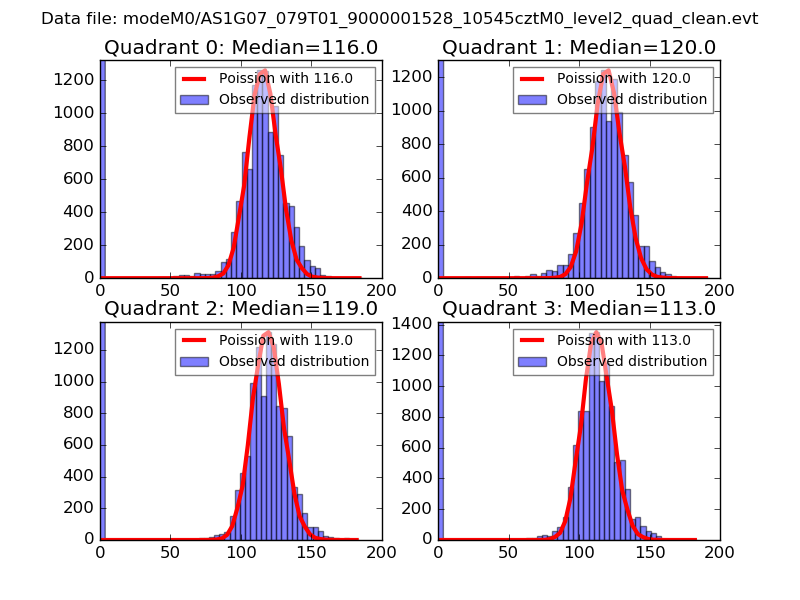 |
 |
| Quadrant-wise count rates Data is divided into 100 sec bins |
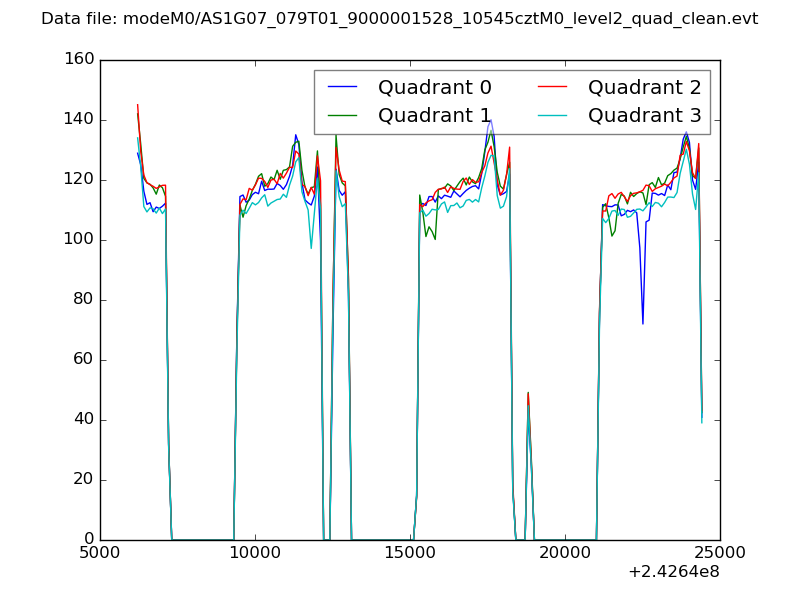 |
|
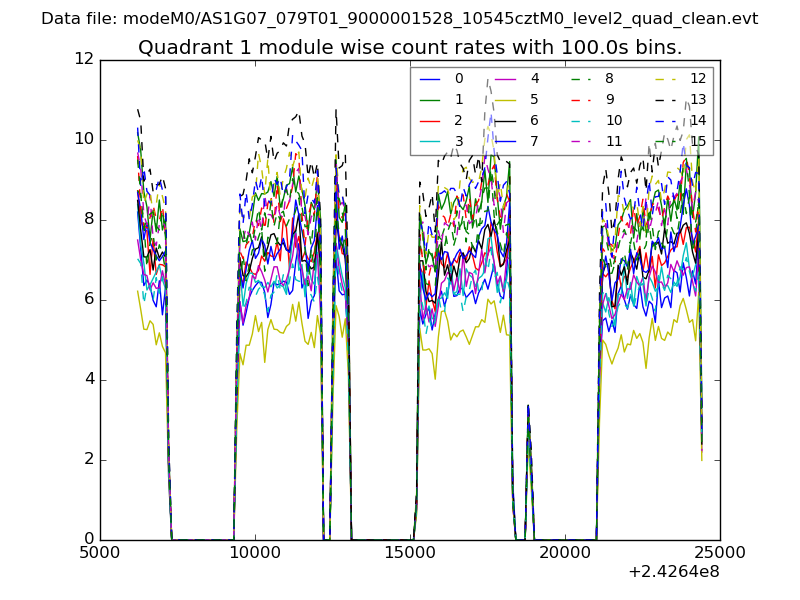
| Module-wise count rates for Quadrant A Data is divided into 100 sec bins |
 |
 |
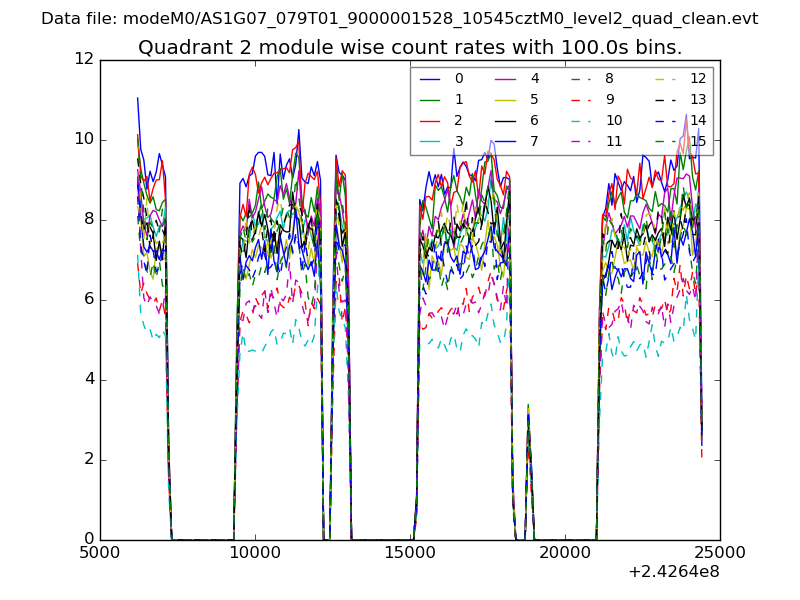
| Module-wise count rates for Quadrant B Data is divided into 100 sec bins |
 |
 |
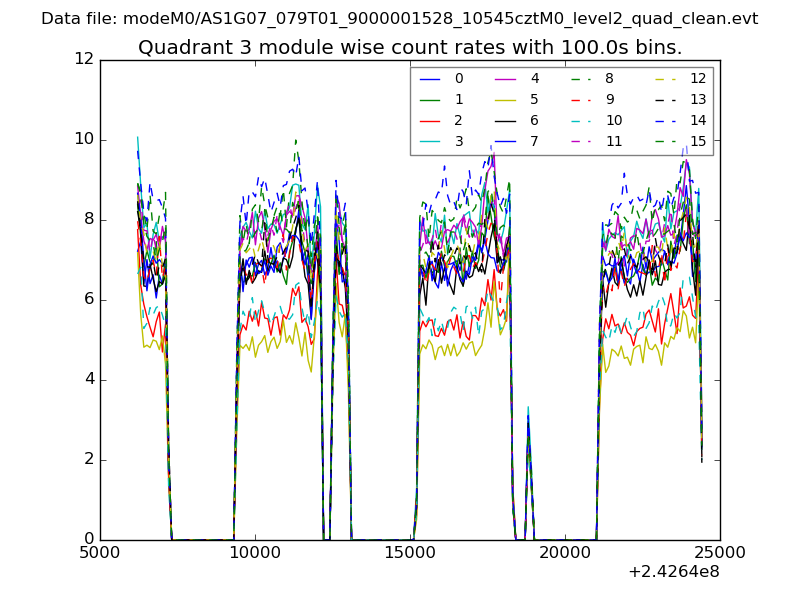
| Module-wise count rates for Quadrant C Data is divided into 100 sec bins |
 |
 |
| Module-wise count rates for Quadrant D Data is divided into 100 sec bins |
 |
 |
| Parameter | Plot |
|---|---|
| CZT HV Monitor | 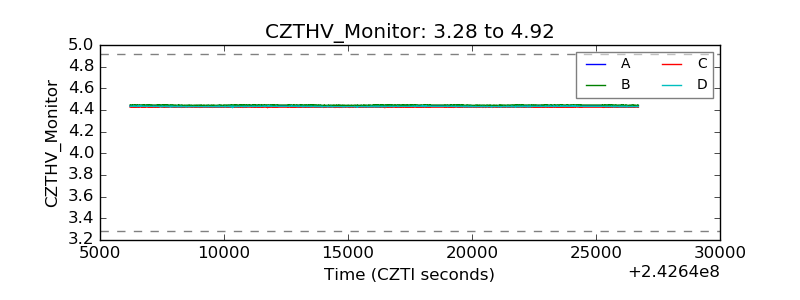 |
| D_VDD |  |
| Temperature 1 | 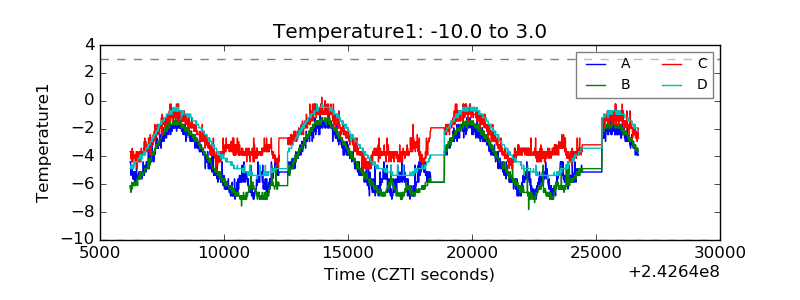 |
| Veto HV Monitor | 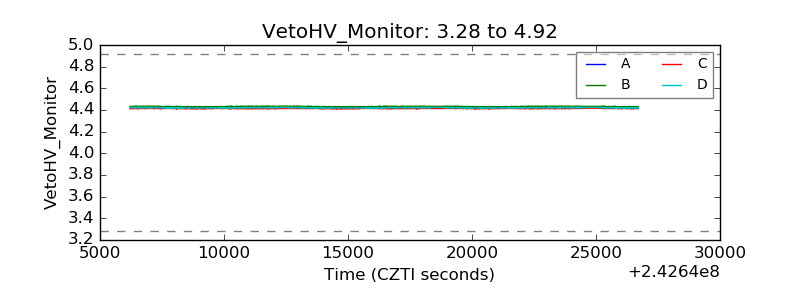 |
| Veto LLD |  |
| Alpha Counter | 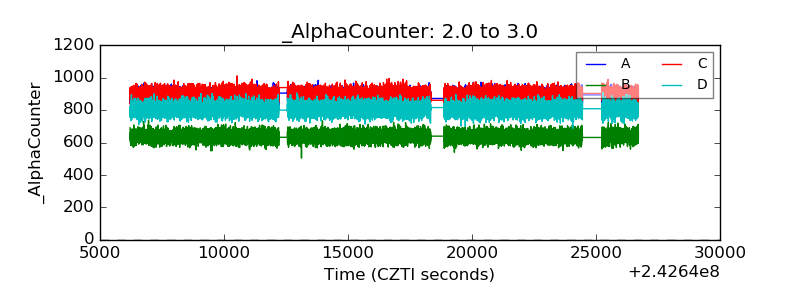 |
| _CPM_Rate | 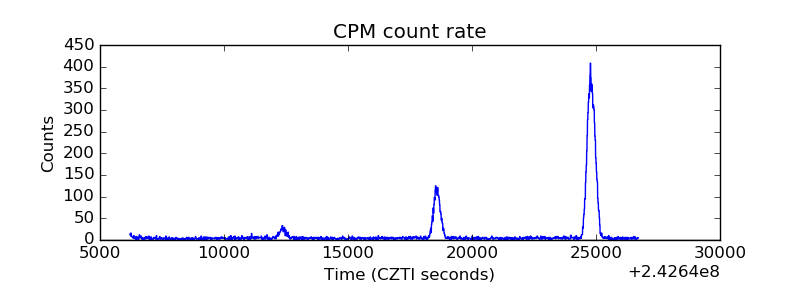 |
| CZT Counter | 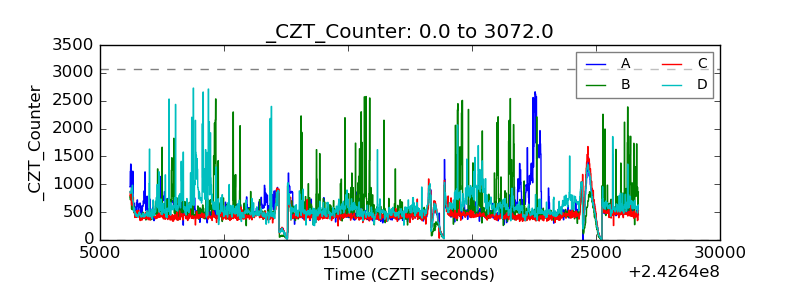 |
| +2.5 Volts monitor | 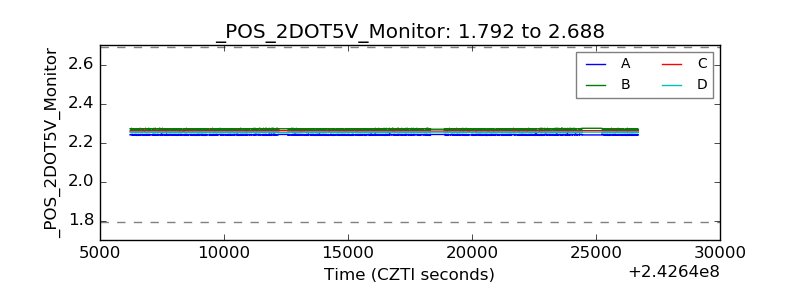 |
| +5 Volts monitor |  |
| _ROLL_ROT | 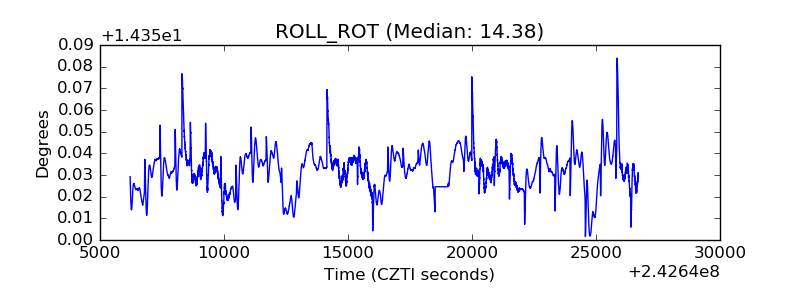 |
| _Roll_DEC | 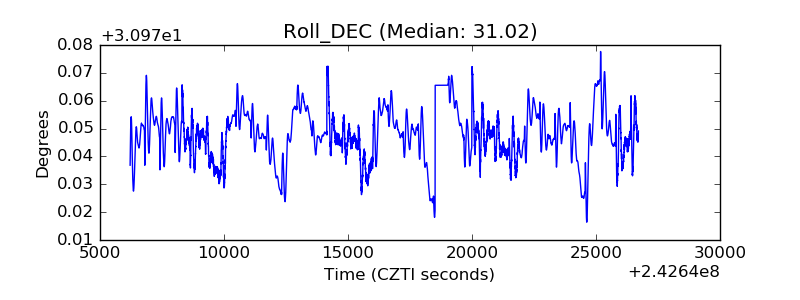 |
| _Roll_RA | 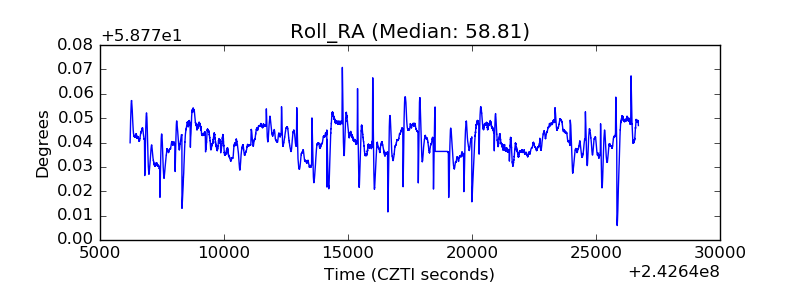 |
| Veto Counter | 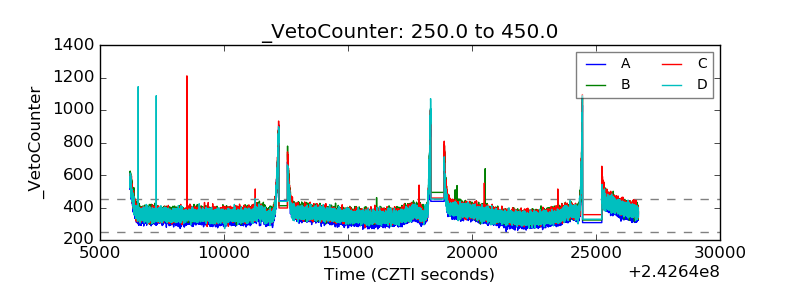 |