| Param | Original file | Final file |
|---|---|---|
| Filename | modeM0/AS1G07_079T01_9000001528_10546cztM0_level2.evt | modeM0/AS1G07_079T01_9000001528_10546cztM0_level2_quad_clean.evt |
| Size (bytes) | 270,907,200 | 34,194,240 |
| Size | 258.4 MB | 32.6 MB |
| Events in quadrant A | 1,618,262 | 199,493 |
| Events in quadrant B | 2,624,425 | 181,134 |
| Events in quadrant C | 1,534,706 | 201,647 |
| Events in quadrant D | 2,187,028 | 204,132 |
| Mode M9 | |||
|---|---|---|---|
| Quadrant | BADHDUFLAG | Total packets | Discarded packets |
| A | 0 | 3 | 0 |
| B | 0 | 3 | 0 |
| C | 0 | 3 | 0 |
| D | 0 | 4 | 0 |
| Mode M0 | |||
|---|---|---|---|
| Quadrant | BADHDUFLAG | Total packets | Discarded packets |
| A | 0 | 10680 | 3427 |
| B | 0 | 14534 | 4418 |
| C | 0 | 10615 | 3561 |
| D | 0 | 12239 | 3411 |
| Mode SS | |||
|---|---|---|---|
| Quadrant | BADHDUFLAG | Total packets | Discarded packets |
| A | 0 | 108 | 35 |
| B | 0 | 108 | 36 |
| C | 0 | 108 | 33 |
| D | 0 | 103 | 32 |
| Quadrant | Total seconds | Saturated seconds | Saturation percentage |
|---|---|---|---|
| A | 3512 | 7 | 0.199317% |
| B | 3379 | 312 | 9.233501% |
| C | 3505 | 2 | 0.057061% |
| D | 3627 | 17 | 0.468707% |
Noise dominated data is calculated using 1-second bins in cleaned event files. If a bin has >2000 counts, and if more than 50% of those come from <1% of pixels, then it is considered to be noise-dominated and hence unusable.
| Quadrant | # 1 sec bins | Bins with >0 counts | Bins with >2000 counts | High rate bins dominated by noise | Noise dominated (total time) | Noise dominated (detector-on time) | Marked lightcurve |
|---|---|---|---|---|---|---|---|
| A | 3761 | 3713 | 0 | 0 | 0.00% | 0.00% | 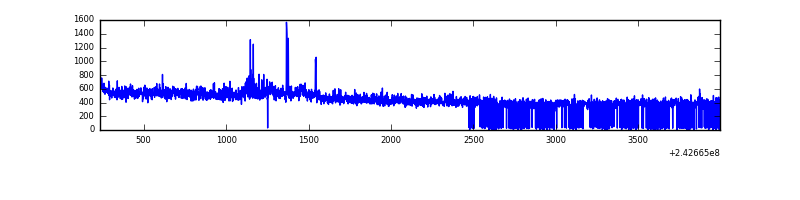 |
| B | 3761 | 3614 | 196 | 196 | 5.21% | 5.42% | 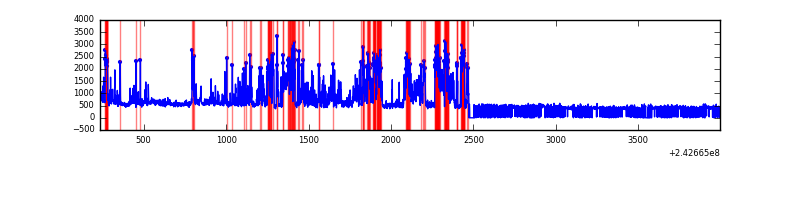 |
| C | 3760 | 3721 | 1 | 1 | 0.03% | 0.03% | 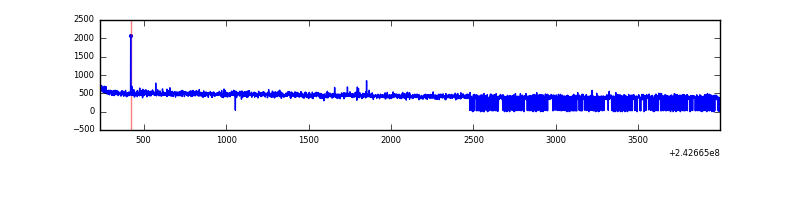 |
| D | 3761 | 3719 | 9 | 9 | 0.24% | 0.24% | 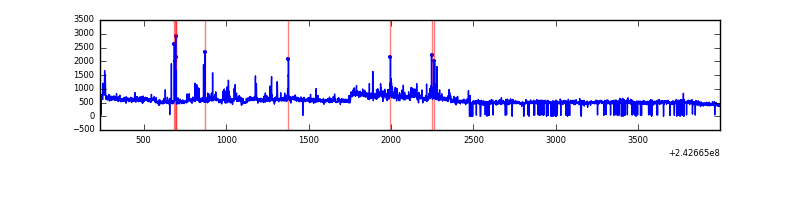 |
Top three noisy pixels from each quadrant. If the there are fewer than three noisy pixels in the level2.evt file, extra rows are filled as -1
| Pixel properties | Quadrant properties | ||||||
|---|---|---|---|---|---|---|---|
| Quadrant | DetID | PixID | Counts | Sigma | Mean | Median | Sigma |
| A | 15 | 239 | 42671 | 509.45 | 399 | 390 | 83.0 |
| A | 15 | 174 | 14292 | 167.51 | 399 | 390 | 83.0 |
| A | 14 | 254 | 11430 | 133.02 | 399 | 390 | 83.0 |
| B | 4 | 239 | 997949 | 13576.17 | 376 | 366 | 73.5 |
| B | 11 | 51 | 77968 | 1056.09 | 376 | 366 | 73.5 |
| B | 0 | 219 | 34509 | 464.65 | 376 | 366 | 73.5 |
| C | 1 | 3 | 3302 | 31.38 | 392 | 393 | 92.7 |
| C | 13 | 61 | 2929 | 27.36 | 392 | 393 | 92.7 |
| C | 14 | 234 | 2225 | 19.76 | 392 | 393 | 92.7 |
| D | 2 | 16 | 343973 | 3485.99 | 399 | 386 | 98.6 |
| D | 8 | 195 | 161865 | 1638.35 | 399 | 386 | 98.6 |
| D | 1 | 52 | 62276 | 627.93 | 399 | 386 | 98.6 |
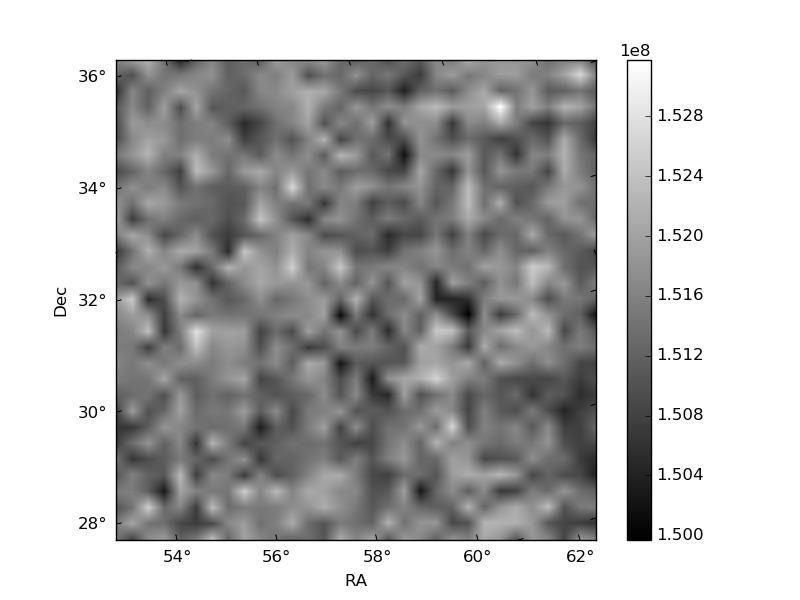
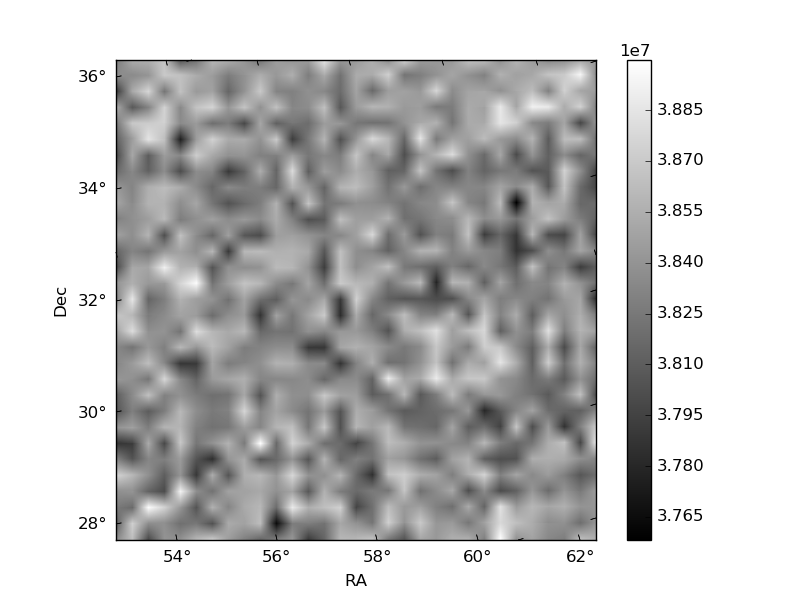
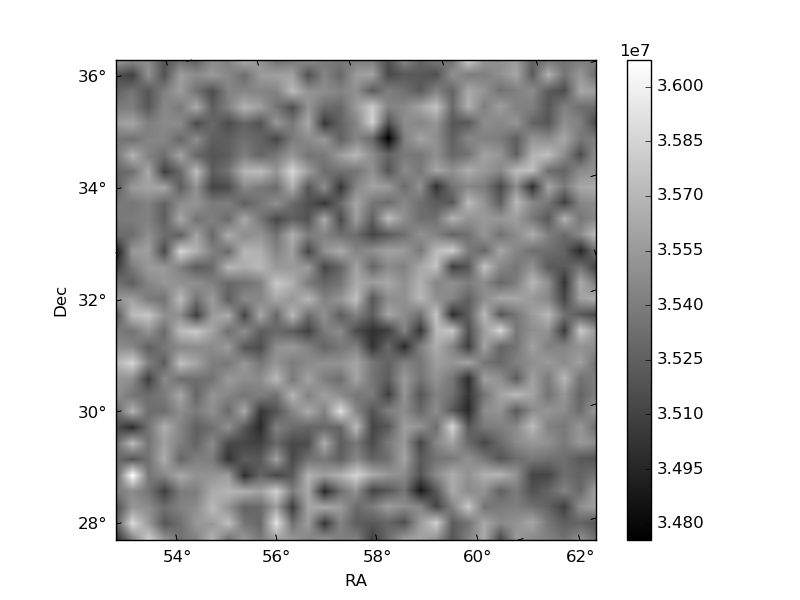
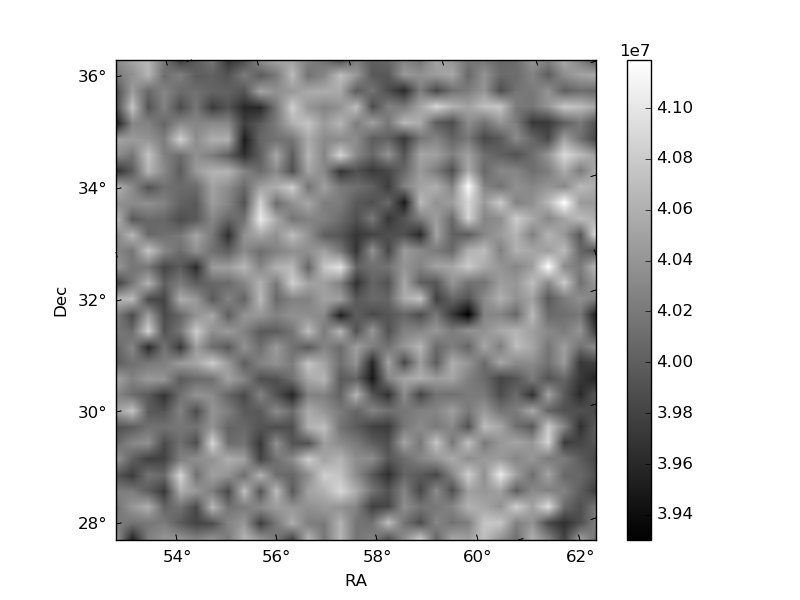
Histogram calculated using DETX and DETY for each event in the final _common_clean file
| Quadrant A | 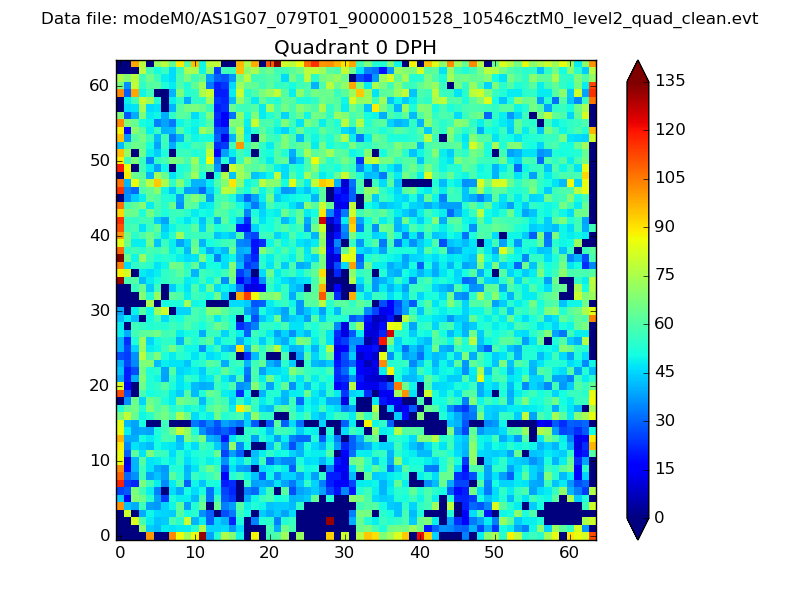 |
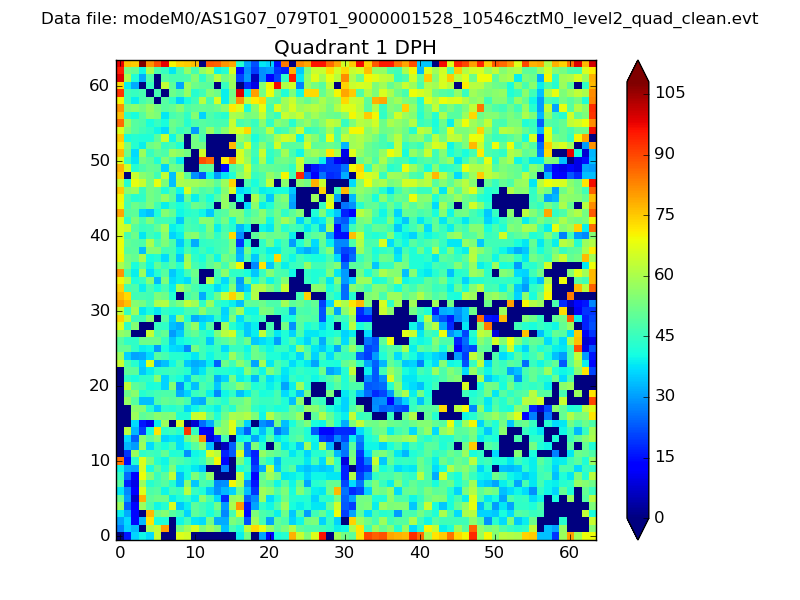 |
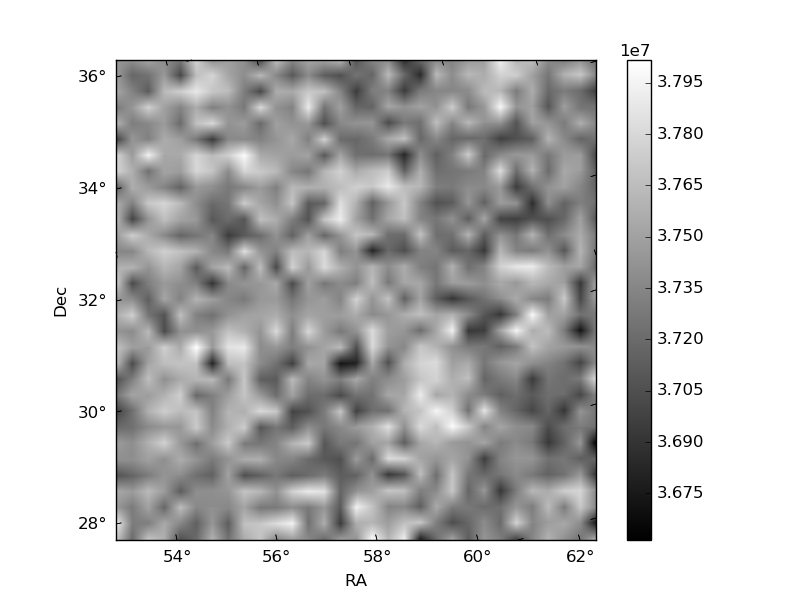
Quadrant B |
|---|---|---|---|
| Quadrant D | 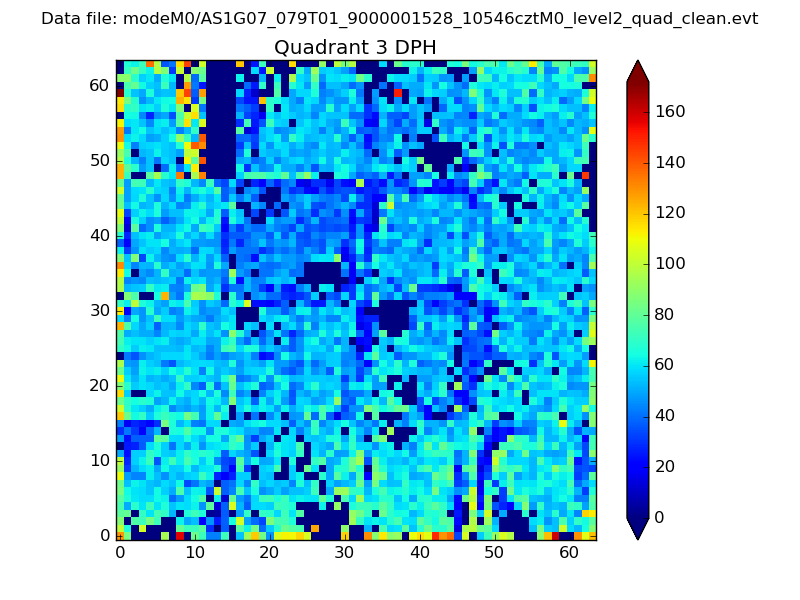 |
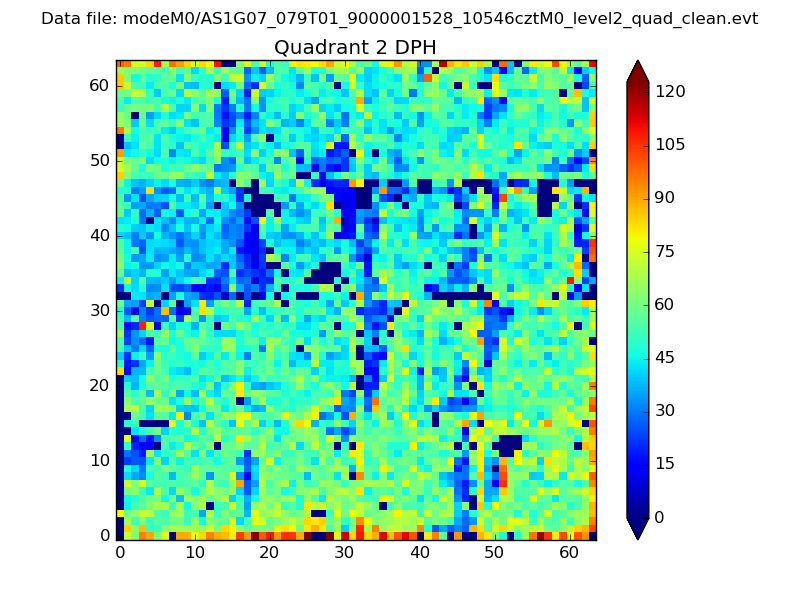 |
Quadrant C |
| Plot type | Count rate plots | Images |
|---|---|---|
| Comparison with Poisson distribution Blue bars denote a histogram of data divided into 1 sec bins. Red curve is a Poisson curve with rate = median count rate of data. |
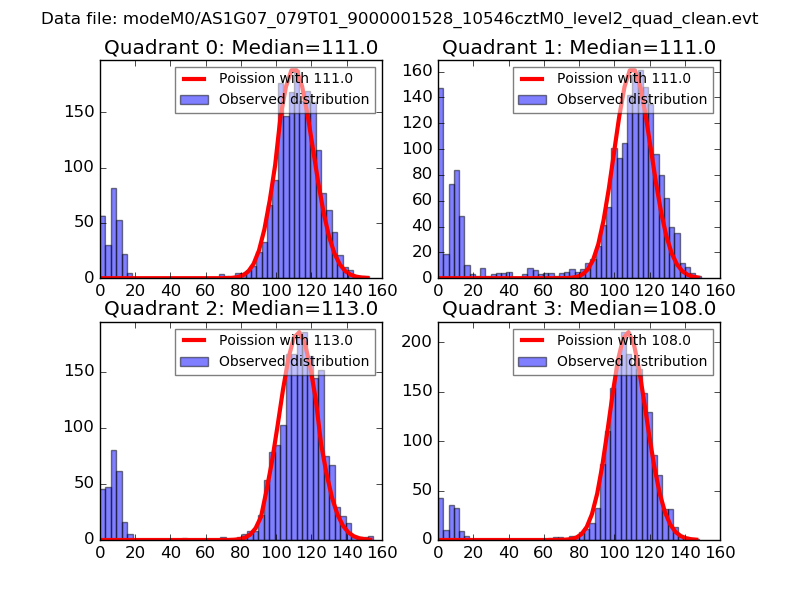 |
 |
| Quadrant-wise count rates Data is divided into 100 sec bins |
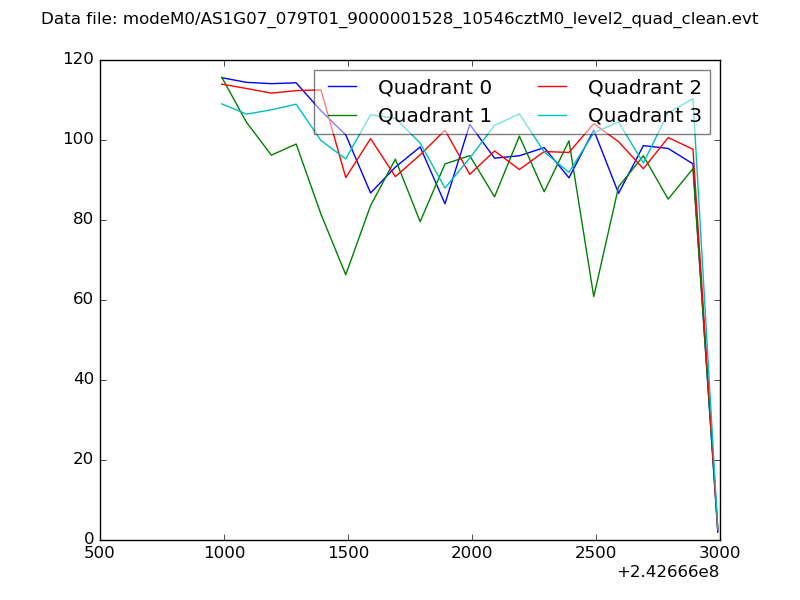 |
|
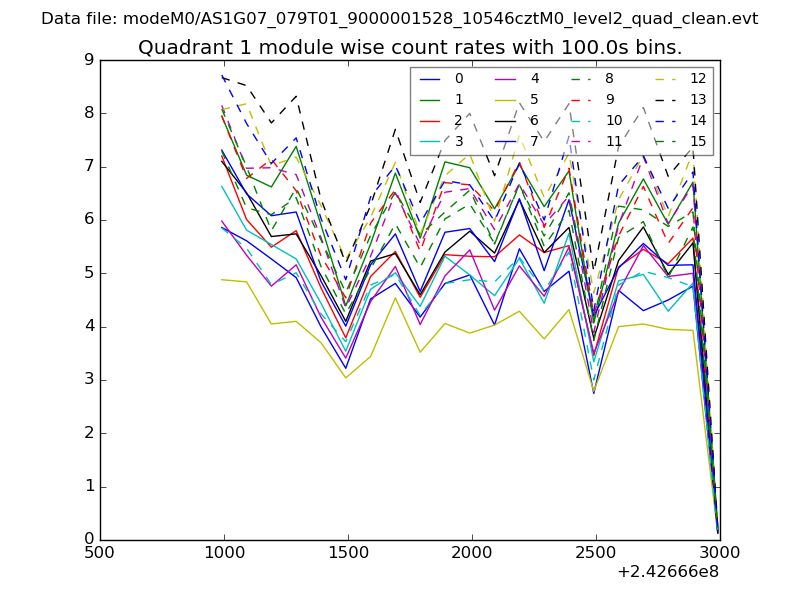
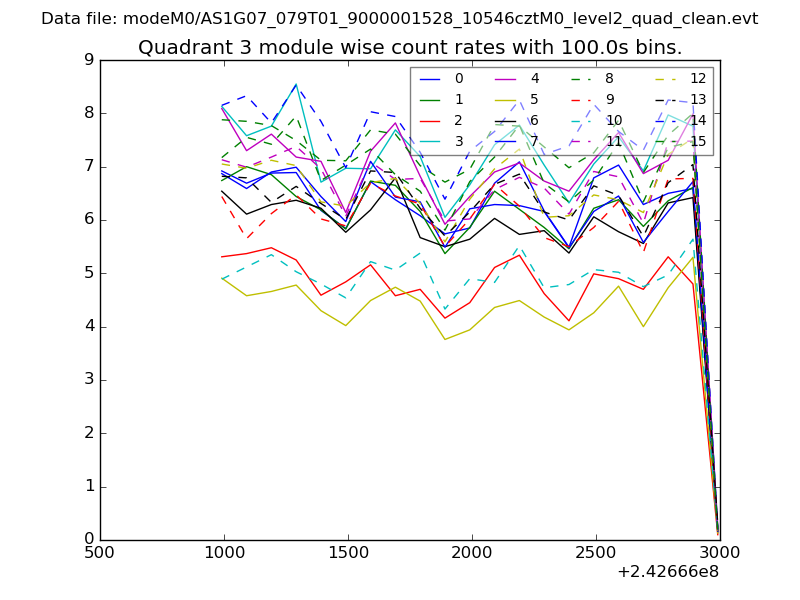
| Module-wise count rates for Quadrant A Data is divided into 100 sec bins |
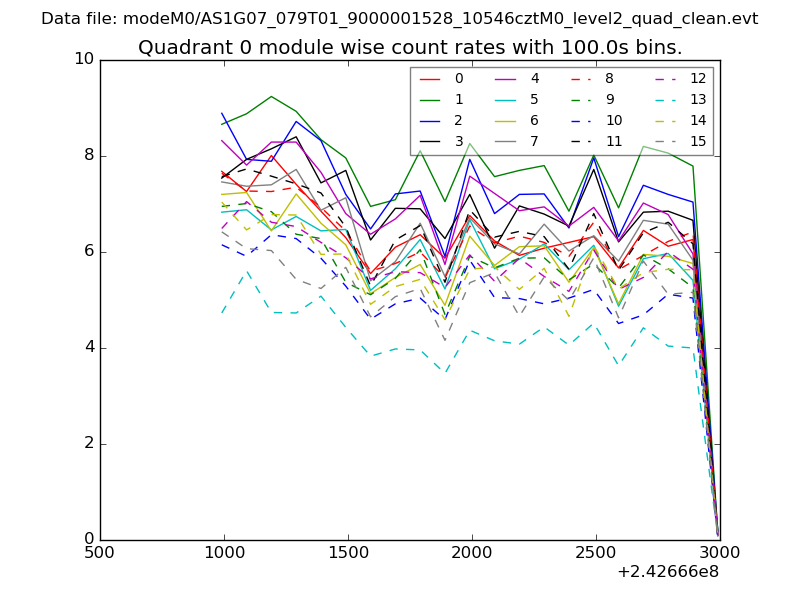 |
 |
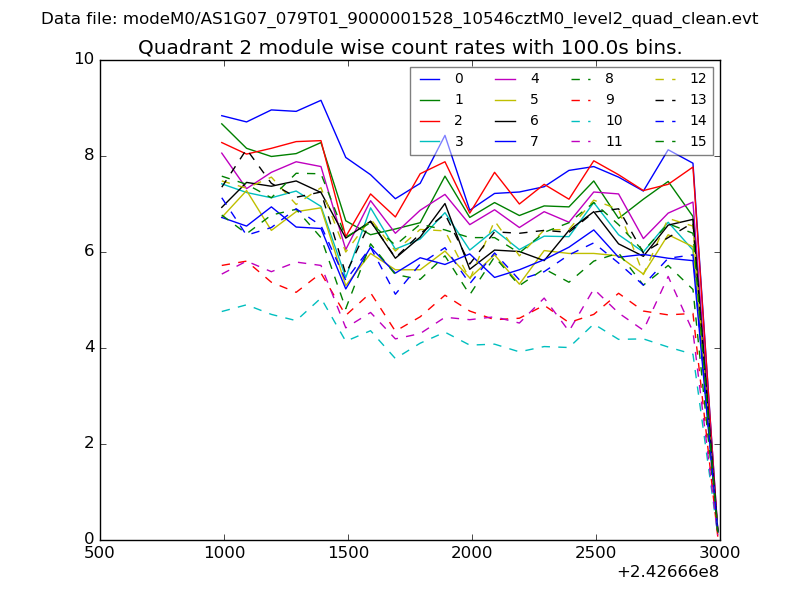
| Module-wise count rates for Quadrant B Data is divided into 100 sec bins |
 |
 |
| Module-wise count rates for Quadrant C Data is divided into 100 sec bins |
 |
 |
| Module-wise count rates for Quadrant D Data is divided into 100 sec bins |
 |
 |
| Parameter | Plot |
|---|---|
| CZT HV Monitor | 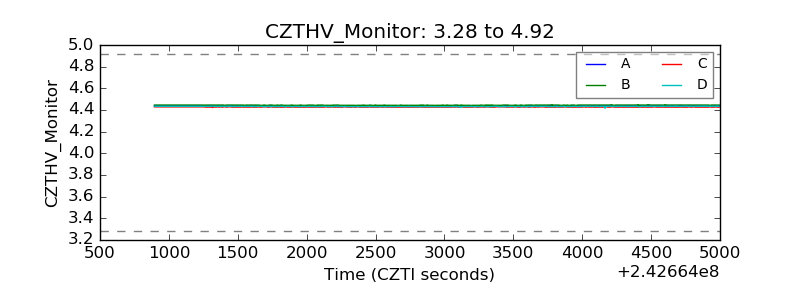 |
| D_VDD | 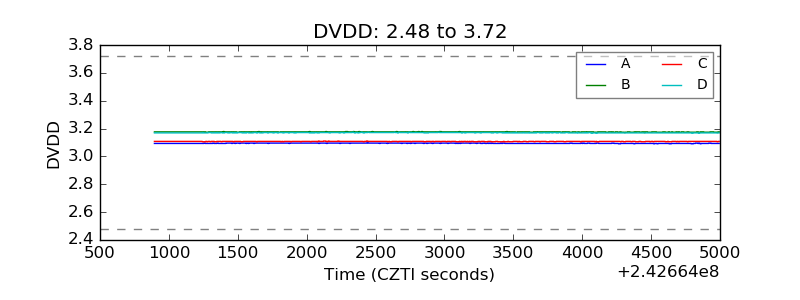 |
| Temperature 1 | 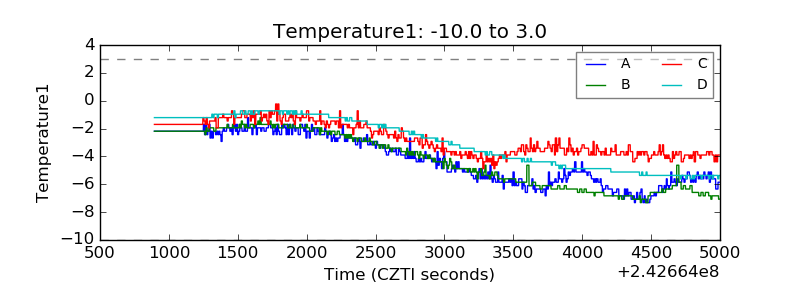 |
| Veto HV Monitor | 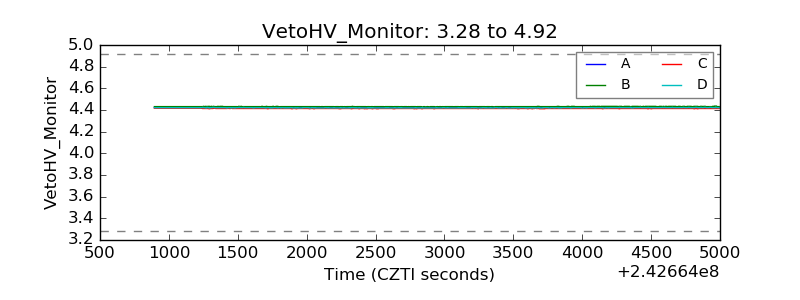 |
| Veto LLD | 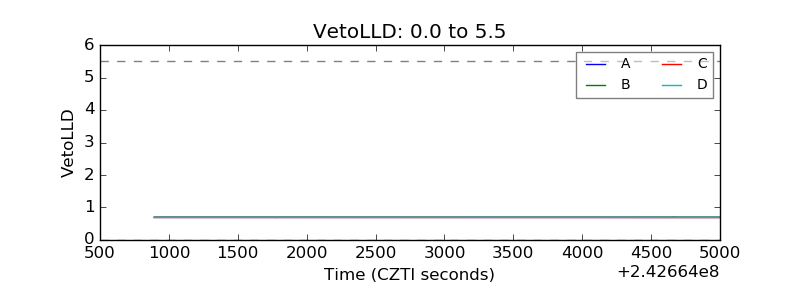 |
| Alpha Counter | 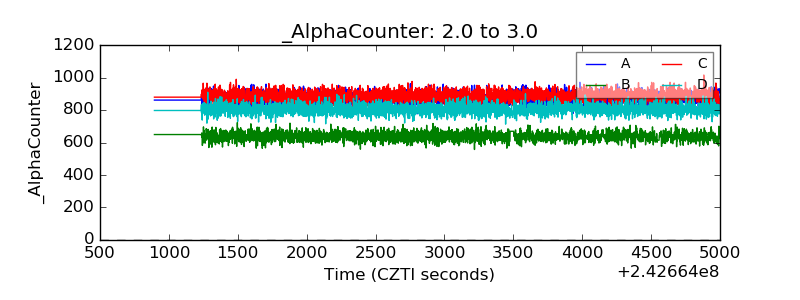 |
| _CPM_Rate | 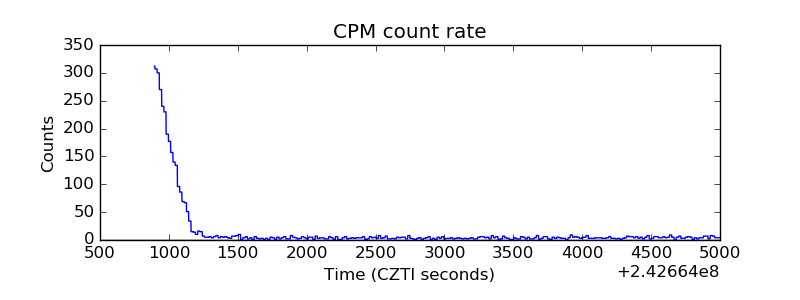 |
| CZT Counter | 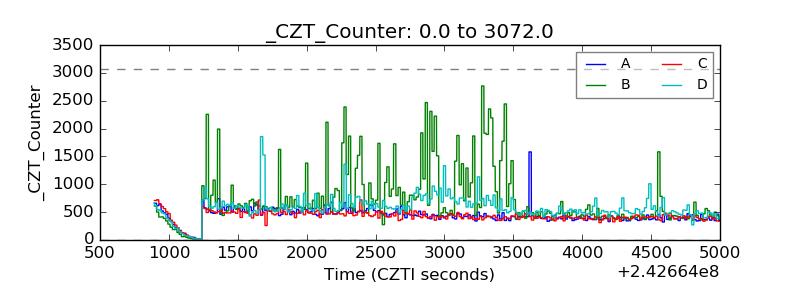 |
| +2.5 Volts monitor |  |
| +5 Volts monitor |  |
| _ROLL_ROT | 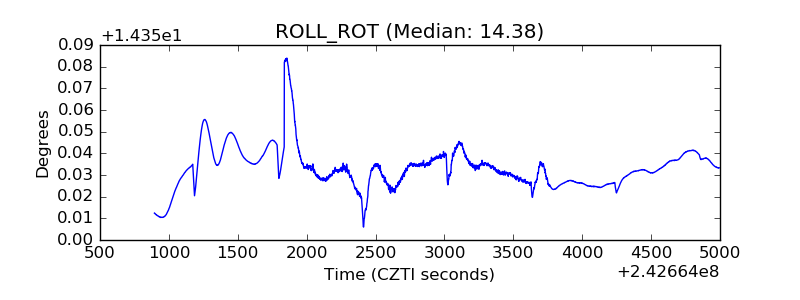 |
| _Roll_DEC | 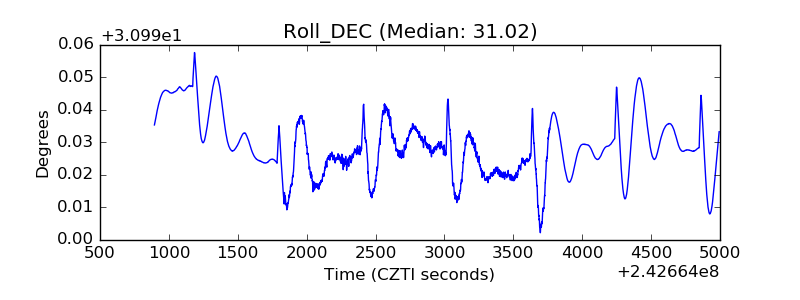 |
| _Roll_RA | 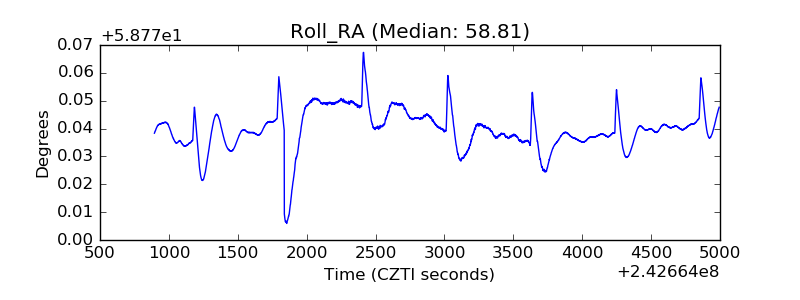 |
| Veto Counter | 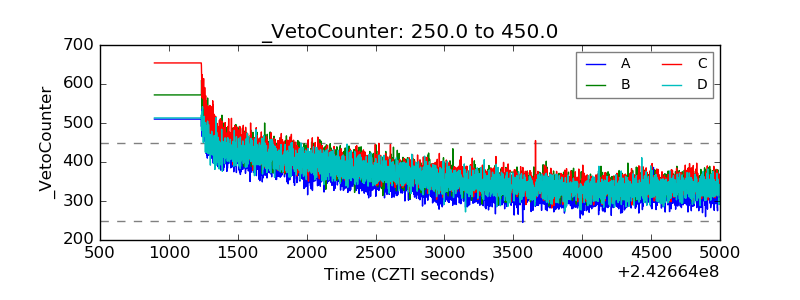 |