| Param | Original file | Final file |
|---|---|---|
| Filename | modeM0/AS1G07_004T01_9000001532_10556cztM0_level2.evt | modeM0/AS1G07_004T01_9000001532_10556cztM0_level2_quad_clean.evt |
| Size (bytes) | 179,046,720 | 32,590,080 |
| Size | 170.8 MB | 31.1 MB |
| Events in quadrant A | 1,163,178 | 201,080 |
| Events in quadrant B | 1,428,645 | 201,527 |
| Events in quadrant C | 1,135,375 | 214,302 |
| Events in quadrant D | 1,531,440 | 198,396 |
| Mode M0 | |||
|---|---|---|---|
| Quadrant | BADHDUFLAG | Total packets | Discarded packets |
| A | 0 | 5152 | 2 |
| B | 0 | 5871 | 1 |
| C | 0 | 5126 | 1 |
| D | 0 | 5983 | 1 |
| Mode SS | |||
|---|---|---|---|
| Quadrant | BADHDUFLAG | Total packets | Discarded packets |
| A | 0 | 48 | 0 |
| B | 0 | 48 | 0 |
| C | 0 | 48 | 0 |
| D | 0 | 48 | 0 |
| Quadrant | Total seconds | Saturated seconds | Saturation percentage |
|---|---|---|---|
| A | 2370 | 194 | 8.185654% |
| B | 2370 | 286 | 12.067511% |
| C | 2370 | 90 | 3.797468% |
| D | 2370 | 192 | 8.101266% |
Noise dominated data is calculated using 1-second bins in cleaned event files. If a bin has >2000 counts, and if more than 50% of those come from <1% of pixels, then it is considered to be noise-dominated and hence unusable.
| Quadrant | # 1 sec bins | Bins with >0 counts | Bins with >2000 counts | High rate bins dominated by noise | Noise dominated (total time) | Noise dominated (detector-on time) | Marked lightcurve |
|---|---|---|---|---|---|---|---|
| A | 2385 | 2371 | 0 | 0 | 0.00% | 0.00% | 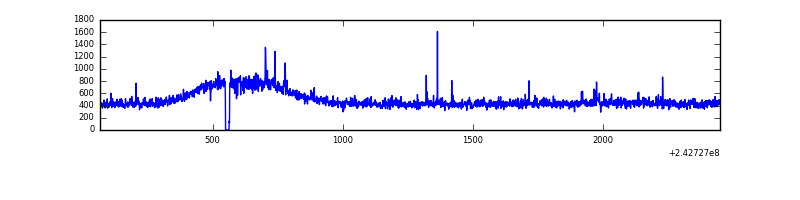 |
| B | 2385 | 2371 | 27 | 27 | 1.13% | 1.14% | 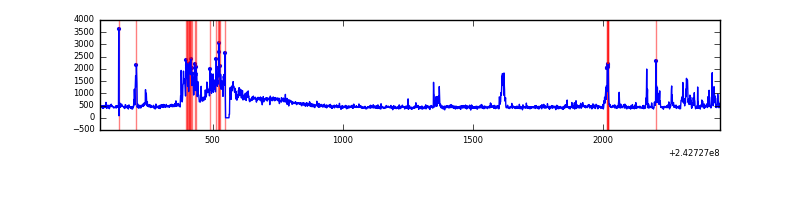 |
| C | 2385 | 2371 | 0 | 0 | 0.00% | 0.00% | 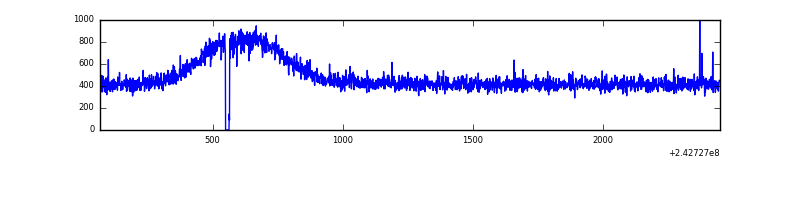 |
| D | 2385 | 2371 | 71 | 71 | 2.98% | 2.99% | 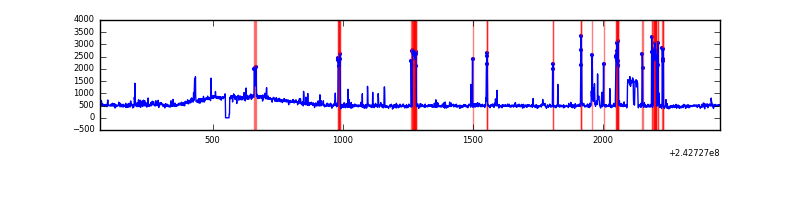 |
Top three noisy pixels from each quadrant. If the there are fewer than three noisy pixels in the level2.evt file, extra rows are filled as -1
| Pixel properties | Quadrant properties | ||||||
|---|---|---|---|---|---|---|---|
| Quadrant | DetID | PixID | Counts | Sigma | Mean | Median | Sigma |
| A | 1 | 162 | 8852 | 135.59 | 294 | 286 | 63.2 |
| A | 14 | 254 | 7555 | 115.06 | 294 | 286 | 63.2 |
| A | 13 | 251 | 5239 | 78.4 | 294 | 286 | 63.2 |
| B | 4 | 239 | 296911 | 5041.72 | 285 | 276 | 58.8 |
| B | 0 | 214 | 10364 | 171.46 | 285 | 276 | 58.8 |
| B | 12 | 111 | 6587 | 107.26 | 285 | 276 | 58.8 |
| C | 8 | 128 | 3858 | 52.45 | 287 | 287 | 68.1 |
| C | 14 | 234 | 3019 | 40.13 | 287 | 287 | 68.1 |
| C | 4 | 175 | 2379 | 30.73 | 287 | 287 | 68.1 |
| D | 1 | 52 | 214634 | 3094.81 | 282 | 273 | 69.3 |
| D | 8 | 195 | 122886 | 1770.21 | 282 | 273 | 69.3 |
| D | 2 | 16 | 68257 | 981.51 | 282 | 273 | 69.3 |
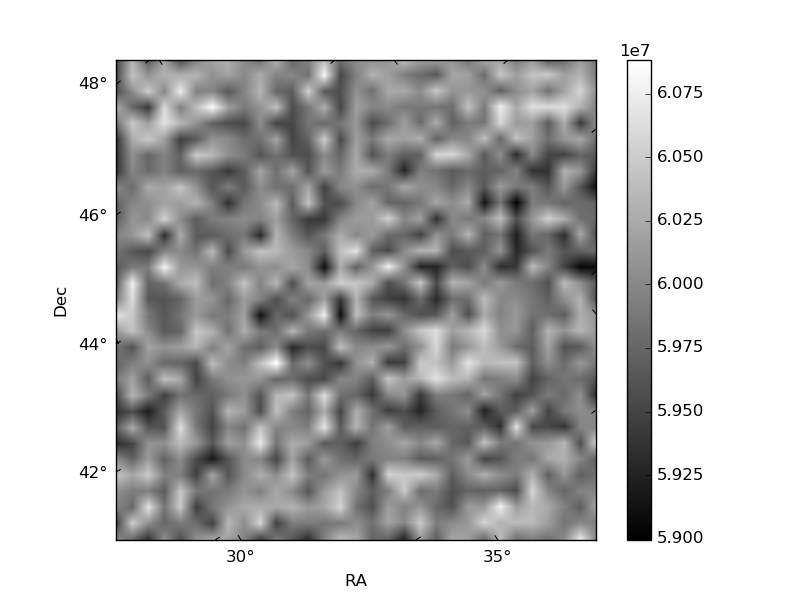
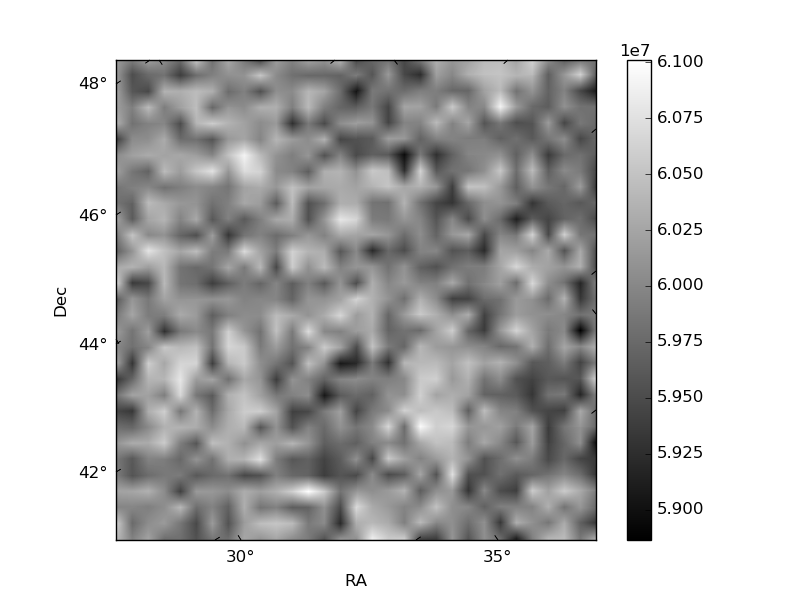
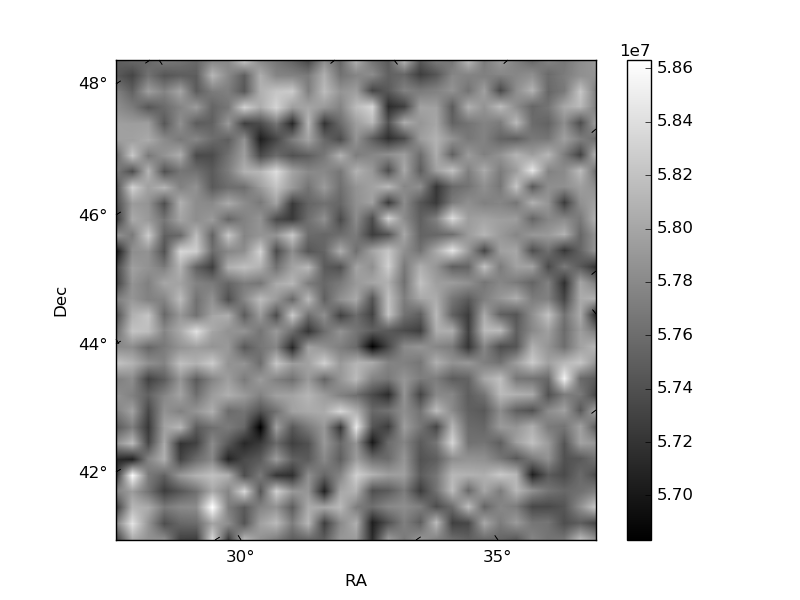
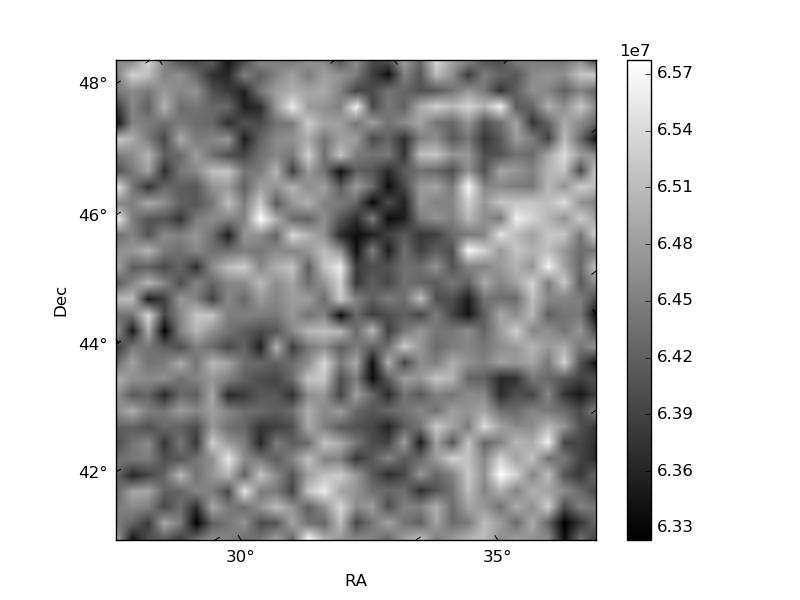
Histogram calculated using DETX and DETY for each event in the final _common_clean file
| Quadrant A |  |
 |
Quadrant B |
|---|---|---|---|
| Quadrant D |  |
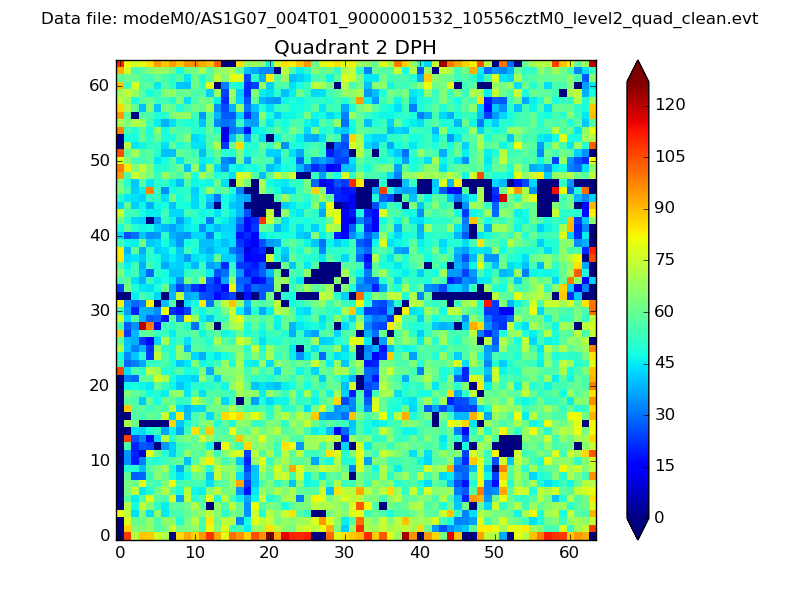 |
Quadrant C |
| Plot type | Count rate plots | Images |
|---|---|---|
| Comparison with Poisson distribution Blue bars denote a histogram of data divided into 1 sec bins. Red curve is a Poisson curve with rate = median count rate of data. |
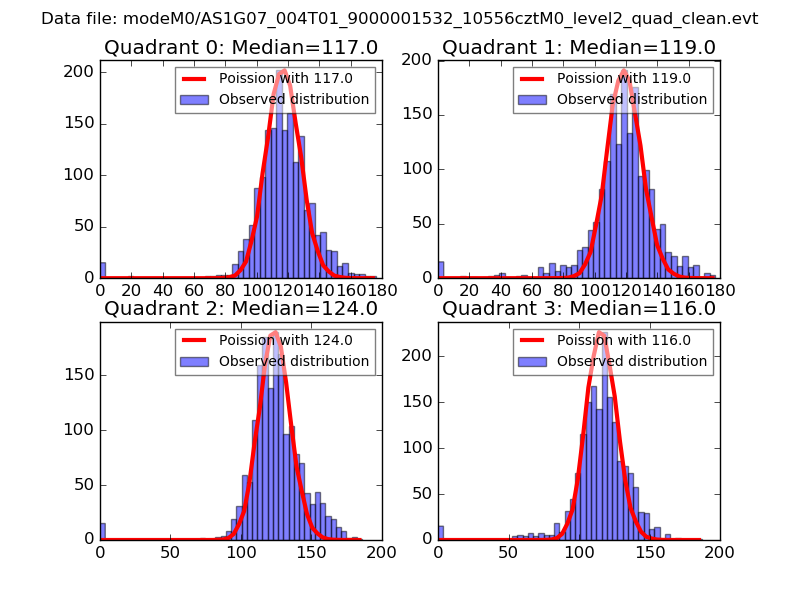 |
 |
| Quadrant-wise count rates Data is divided into 100 sec bins |
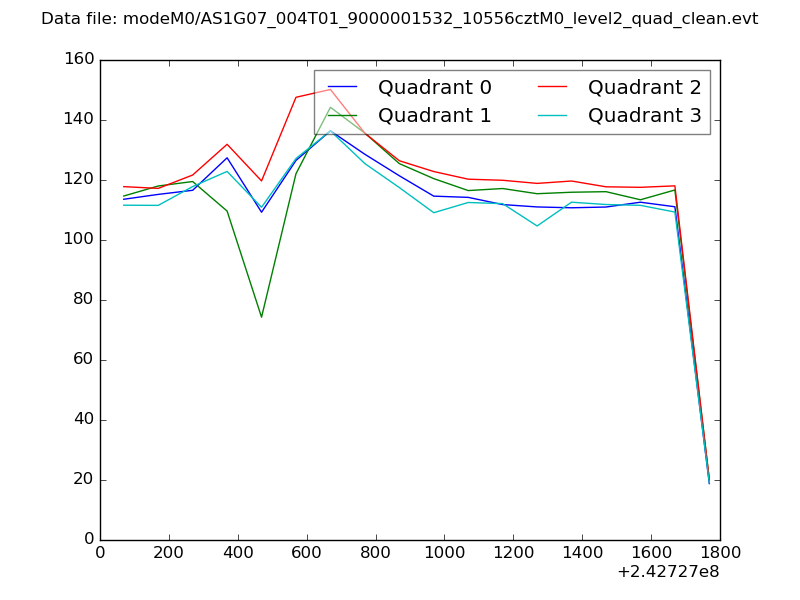 |
|
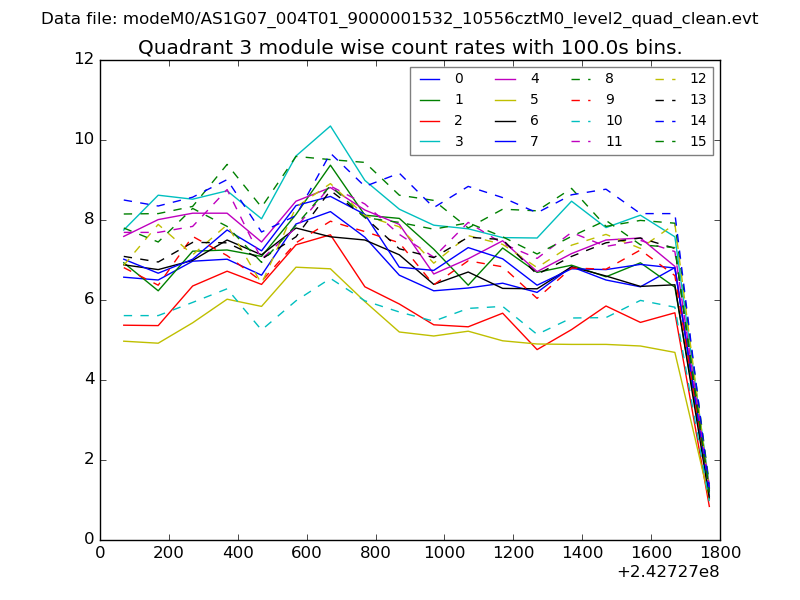
| Module-wise count rates for Quadrant A Data is divided into 100 sec bins |
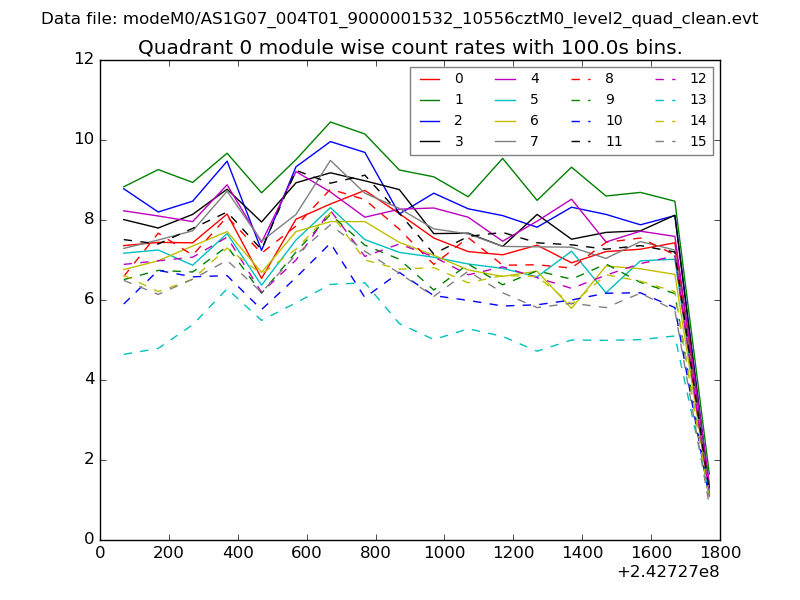 |
 |
| Module-wise count rates for Quadrant B Data is divided into 100 sec bins |
 |
 |
| Module-wise count rates for Quadrant C Data is divided into 100 sec bins |
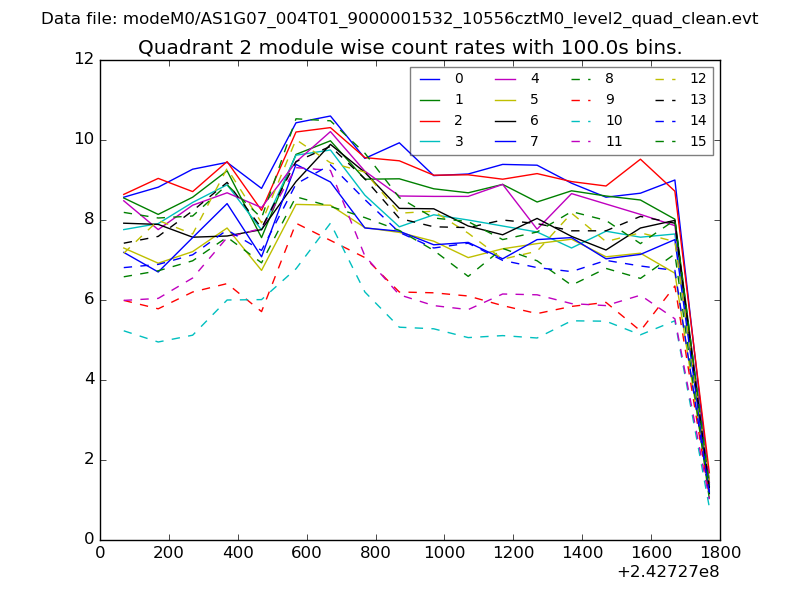 |
 |
| Module-wise count rates for Quadrant D Data is divided into 100 sec bins |
 |
 |
| Parameter | Plot |
|---|---|
| CZT HV Monitor | 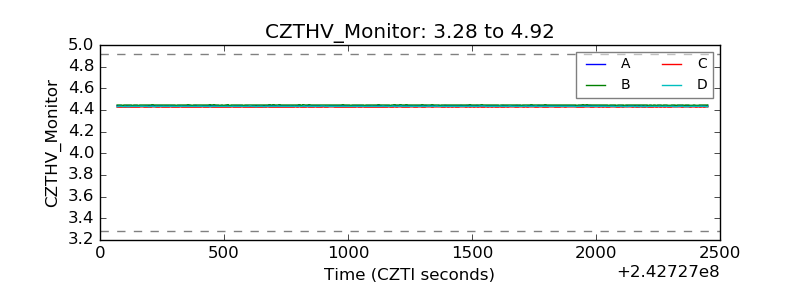 |
| D_VDD | 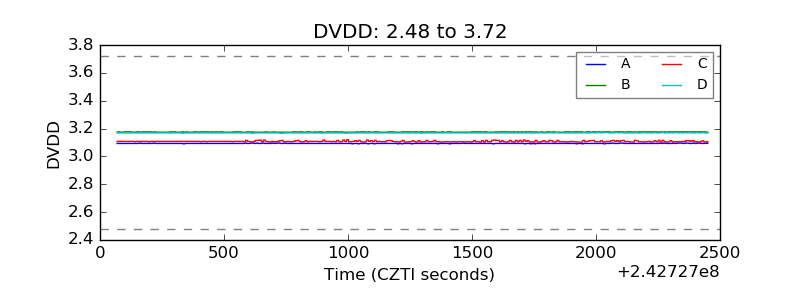 |
| Temperature 1 | 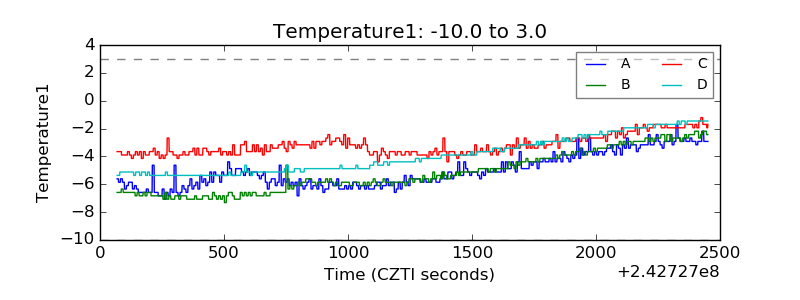 |
| Veto HV Monitor | 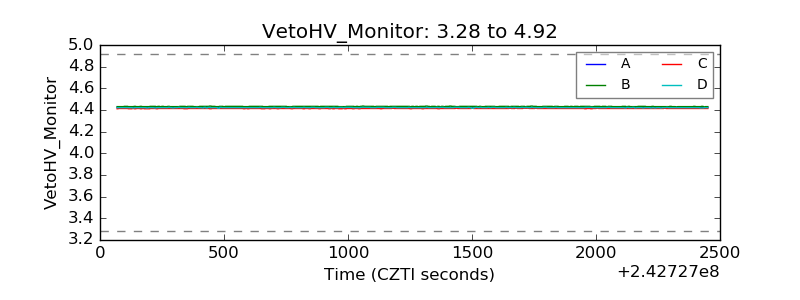 |
| Veto LLD | 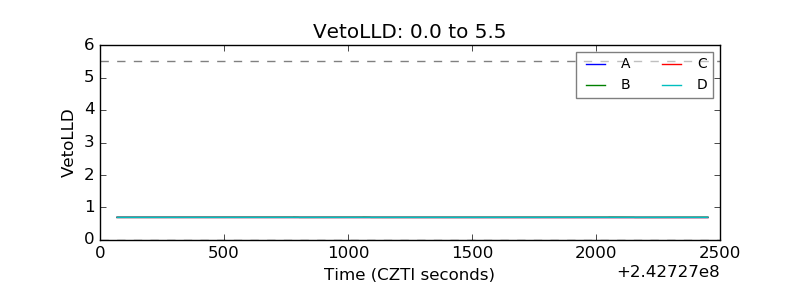 |
| Alpha Counter | 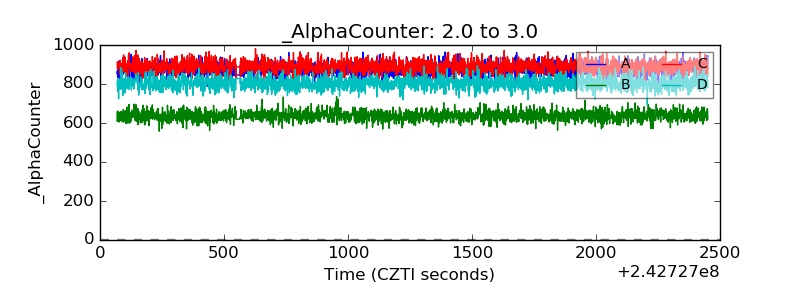 |
| _CPM_Rate | 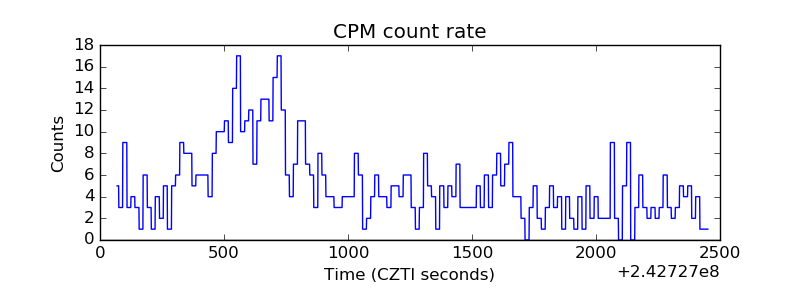 |
| CZT Counter | 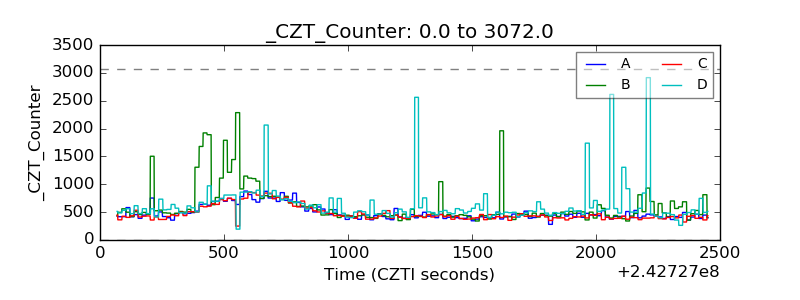 |
| +2.5 Volts monitor |  |
| +5 Volts monitor | 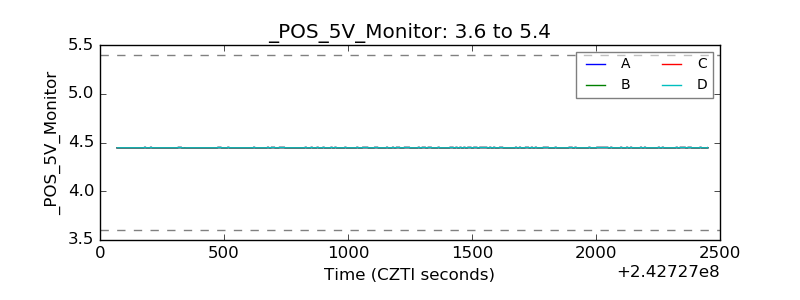 |
| _ROLL_ROT | 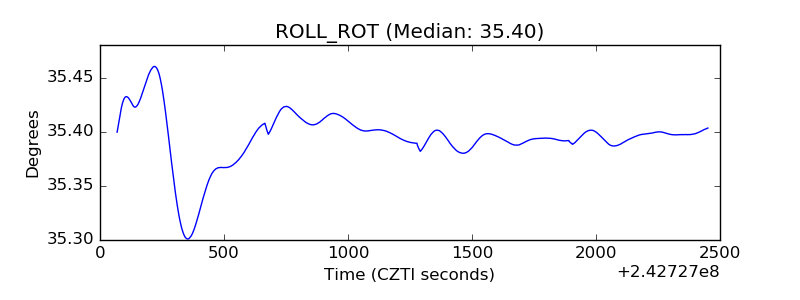 |
| _Roll_DEC | 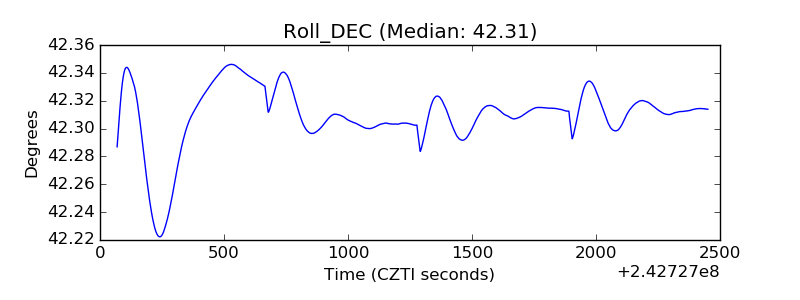 |
| _Roll_RA | 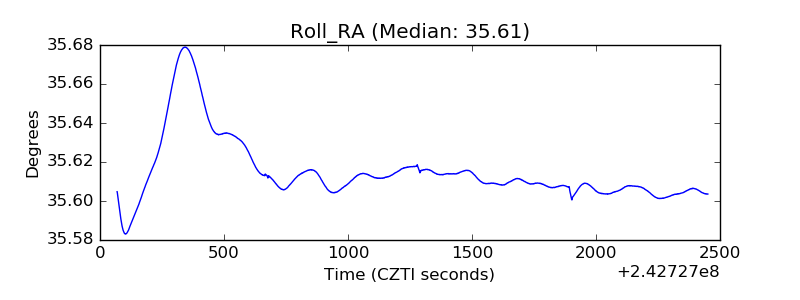 |
| Veto Counter | 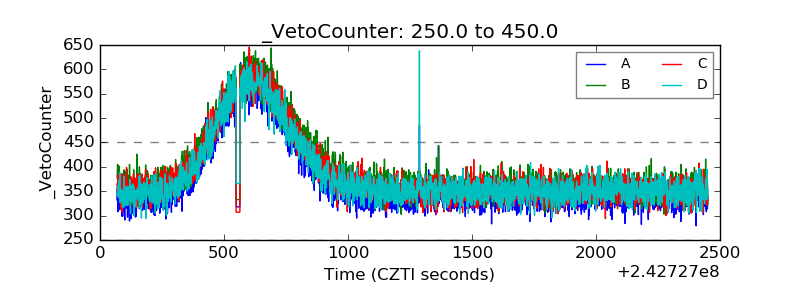 |